

Candlestick Patterns Cheat Sheet: 50+ Patterns Sorted by What They Tell You
Want the daily routine? Get the free 15-Minute Swing Trader’s Checklist. Get it free →
By Spencer Li, CFTe · Last updated: 13 August 2026
A candlestick pattern is a single candle, or a short run of two or three, whose shape shows how the fight between buyers and sellers went. Most patterns fall into four groups: bullish reversals that form after a fall, bearish reversals that form after a rise, continuation patterns that say the trend will probably carry on, and indecision candles like the doji that point nowhere yet.
This cheat sheet sorts more than 50 of them, each in one line with a link to its full guide. Before the tables, one odd fact is worth knowing, because it explains why so many traders memorise every pattern and still lose money on them.

Why does the same candle get two different names?
The hammer and the hanging man are exactly the same candle.
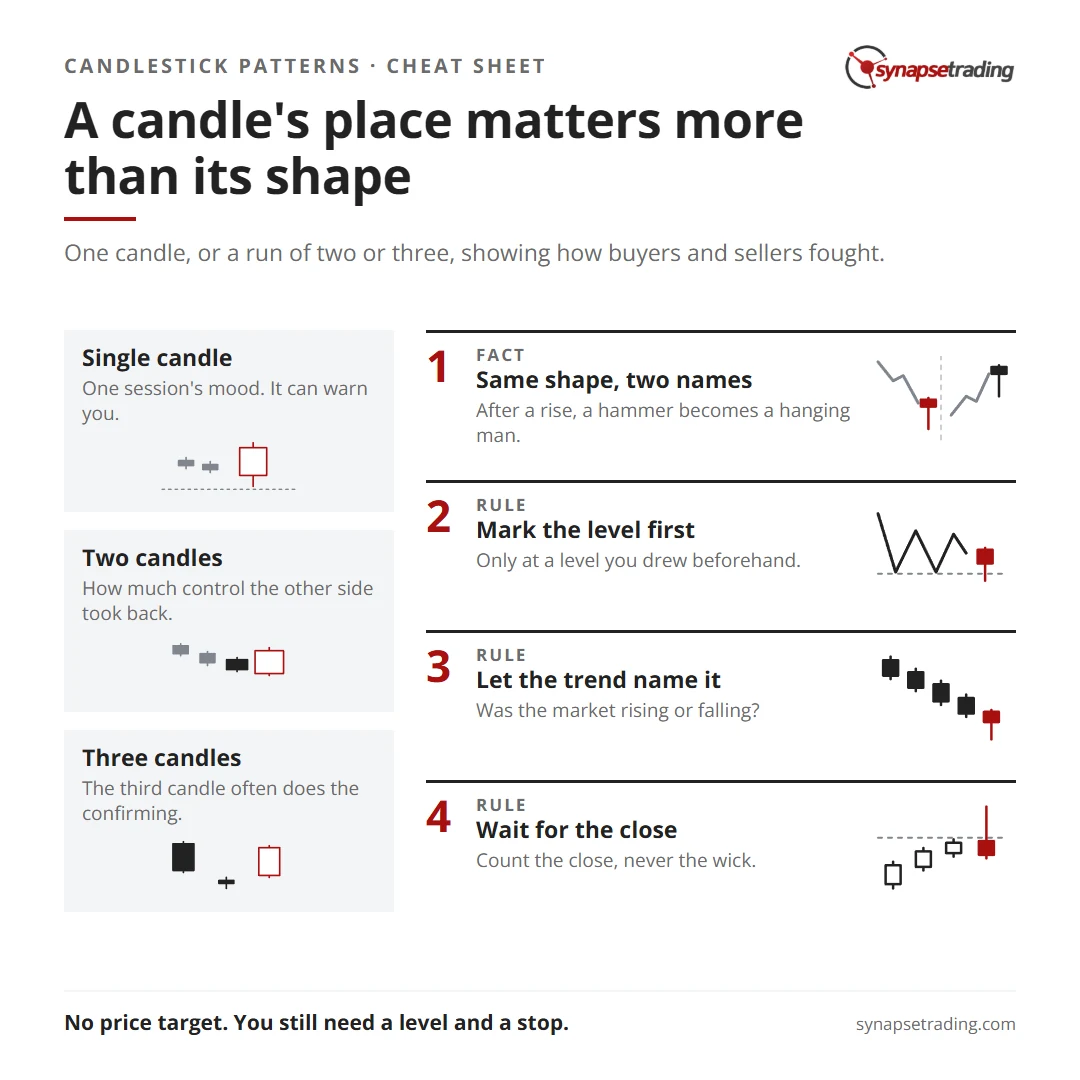
Both have a small real body, the thick part between the open and the close, sitting at the top of the session’s range, with a long lower shadow underneath that is at least twice the height of the body. Steve Nison, whose 1991 book brought candlesticks to most Western traders, calls it a hammer when it forms after a fall, because there it hints that the selling is ending. When the very same shape forms after a rise, he calls it a hanging man, a warning that the buying is running out.
The same trick works with the shadow on top. A small body with a long upper shadow is an inverted hammer after a fall and a shooting star after a rise.
So a candle’s name is really two facts glued together, the shape and the place it appears, and the place usually matters more. A scanner that only reads shapes will hand you a long list of signals. Most of them mean nothing.
If you are new to the body, the shadows and the colours, start with how to read candlestick bars.
Which single candles should you know?
A single candle is one session’s mood. It can warn you. It rarely gives you enough reason to act.
| Pattern | What it looks like | What it suggests |
|---|---|---|
| Hammer | Small body on top, long lower shadow, after a fall | Bullish reversal |
| Hanging man | The hammer’s shape, after a rise | Bearish warning |
| Inverted hammer | Small body at the bottom, long upper shadow, after a fall | Bullish, needs confirming |
| Shooting star | The inverted hammer’s shape, after a rise | Bearish, usually minor |
| Doji | Open and close at almost the same price | Indecision |
| Long-legged doji | A doji with long shadows both ways | Lost its sense of direction |
| Gravestone doji | Open and close at the low, long upper shadow | A strong top warning |
| Dragonfly doji | Open and close at the high, long lower shadow | Bullish lean after a fall |
| Spinning top | Small body, small shadows | Indecision |
| High-wave candle | Small body, very long shadows | Indecision near a turn |
| Marubozu | A long body with little or no shadow | One side in full control |
| Bullish and bearish belt hold | A long candle that opens on its low, or on its high | Taller means stronger |
Do note that a doji only counts when doji are rare around it. Gregory Morris makes the point in Candlestick Charting Explained that a doji among other doji tells you nothing, and Nison adds that doji call tops better than bottoms, since a falling market can keep falling under its own weight.
What does a second candle add?
Nison had a lovely image for this. A dark cloud cover, where the second candle closes more than halfway down into the first, is a partial eclipse of the sun. A bearish engulfing pattern, where the second body swallows the first whole, is the total eclipse.
That is what the second candle is for. The first shows one side in control, and the second shows how much of that control the other side took back, so you are reading a change of mind rather than a mood.
| Pattern | What it looks like | What it suggests |
|---|---|---|
| Bullish and bearish engulfing | A body that fully covers the prior opposite-colour body | Reversal |
| Piercing pattern | Opens below the prior low, closes over halfway up the black body | Bullish reversal |
| Dark cloud cover | Opens above the prior high, closes over halfway down the white body | Bearish reversal |
| Bullish and bearish harami | A small body inside the prior long body | The trend is stalling |
| Harami cross | A harami whose second candle is a doji | A stronger stall |
| Tweezer top and bottom | Matching highs, or matching lows | Stronger on a weekly chart |
| Counterattack lines | Opposite colours, same close | A weaker piercing or dark cloud |
| Kicker | Two opposite marubozu with a gap between | A sharp change of mind |
Reading candles is a daily habit, and habits are easier to keep with a routine. The free 15-minute swing trader checklist is the one I run myself.
Why do so many patterns come in threes?
Nison noticed that Japanese traders had a soft spot for the number three, and that four was considered unlucky because the word sounds like “death”. Whatever the reason, many of the famous patterns take three sessions, and the third candle often does the confirming you would otherwise have to wait for.
| Pattern | What it looks like | What it suggests |
|---|---|---|
| Morning star | Long black, a small star gapping lower, a long white closing well into the first | Bullish reversal |
| Evening star | Long white, a small star gapping higher, a long black closing deep into the first | Bearish reversal |
| Doji star | Either of the above with a doji as the star | Stronger |
| Bullish and bearish abandoned baby | A doji star gapping away on both sides | Rare reversal |
| Three inside up and down | A harami, then a close in the new direction | A confirmed harami |
| Three outside up and down | An engulfing, then a close in the new direction | A confirmed engulfing |
| Three white soldiers | Three white candles with higher closes, from a low base | Strength ahead |
| Three black crows | Three long black candles closing near their lows | Bearish after a high |
| Advance block | Soldiers with shrinking bodies or long upper shadows | Protect your longs |
| Stalled pattern | Two long white candles, then a small one | The rally is pausing |
| Upside-gap two crows | Two black candles gap up and fail to hold | Bearish |
| Tri-star | Three doji in a row | Very rare, a major reversal |
Which patterns say the trend will carry on?
Nison quotes an old Japanese line that there are times to buy, times to sell, and “times to rest”. Continuation patterns are the rest.
| Pattern | What it looks like | What it suggests |
|---|---|---|
| Rising and falling window | The Japanese name for a gap | Continuation, later support or resistance |
| Upside and downside tasuki gap | A gap, then a candle closing into it without filling it | Continuation |
| Rising and falling three methods | A long candle, small ones inside its range, another long one | Continuation |
| On-neck and thrusting | A weak bounce short of the prior body’s middle | Bearish continuation |
The rarer ones are the mat hold, separating lines, side-by-side white lines and gapping plays. A few more take weeks to form. The dumpling top and frying pan bottom are rounded turns confirmed by a gap. The tower top and bottom has long candles on both sides of the turn, and the sanku rests on old lore that after three gaps in one direction, a turn is probably near.
Do candlestick patterns actually work?
On 3 May 2021, a trader on Reddit’s r/technicalanalysis asked a question every cheat sheet should answer. Were these patterns “derived by statistically counting their frequency of recurrence”?
Mostly, no. The names grew out of the rice market of 18th-century Osaka, where traders on the Dojima Rice Exchange watched the same crowd behaviour repeat and gave it names like crows, soldiers and abandoned babies. Only much later did Morris turn many of them into precise rules a computer could test.
Nison was quite honest about the limits. He called the label “reversal pattern” a misnomer and compared it to the brake lights of the car in front of you, which can mean a stop or just a slower car. Candles also give no price target. You still need a level and a stop.
Personally, I use far fewer patterns than this page lists. The method I teach leans on a small handful of signal bars at a level, and without one of them, a good setup is still not a trade.
A real example shows how little weight one pattern gets. In my weekly outlook on 9 June 2026, I walked viewers through Goldman Sachs, which we still held, and pointed out “one long white bar and one long black bar”. I called it “maybe slightly bearish”. The stock was still in its uptrend, though, so I kept trailing my stop. The candles raised a doubt. The trend decided.
I owe you one concession. As at October 2026, my public trade log records the entry date, the stock and the result of every trade, but not which candle triggered it, so I cannot tell you which of these patterns made me money.
If you would rather check a few things daily than memorise 50 names, the free 15-minute swing trader checklist is my routine.
How do you use this cheat sheet without getting whipsawed?
Imagine your scanner flags 40 hammers tonight. Most sit in the middle of nowhere, and if you buy them all, the bad ones will wipe out the good ones long before you learn anything, along with a fair amount of your confidence. Three habits cut the list down.
- Mark the level first. Only pay attention to a pattern at support or resistance you drew beforehand. Nison called this the Rule of Multiple Technical Techniques: the more independent signals at one price, the better the odds.
- Let the trend name the candle. Decide whether the market was rising or falling before you name the pattern.
- Wait for the close. A hammer still forming can become something else by the bell, so I count the close, never the wick.
None of this makes a pattern reliable. It just stops you trading the ones that never had a reason to work, which is most of them.
FAQ
What is a candlestick pattern?
One candle, or a run of two or three, whose shape shows how the fight between buyers and sellers went. Traders use them to spot a likely change of trend, a pause or indecision.
How many candlestick patterns are there?
More than 50 have names, and Japanese charting has many more variations. This cheat sheet covers the ones you are likely to meet.
What is the difference between a hammer and a hanging man?
Nothing in the shape. After a fall it is a bullish hammer, and after a rise it is a bearish hanging man.
Which candlestick patterns are bullish and which are bearish?
The main bullish reversals are the hammer, inverted hammer, bullish engulfing, piercing pattern, morning star and three white soldiers. Their bearish mirrors are the hanging man, shooting star, bearish engulfing, dark cloud cover, evening star and three black crows.
Can you trade candlestick patterns on their own?
I would not. They fire often and give no price target, so they work best as a trigger at a level you marked beforehand, in line with the trend.
Which of these patterns do you actually trade, and which have you quietly stopped trusting? Let me know in the comments.
For the background on each family, read my definitive guide to candlestick patterns, and for where they fall short, see the limitations of candlestick patterns. The rest of my free trading guides are here.

If you would like to learn more about all the different candlestick patterns, also check out: “The Definitive Guide to Candlestick Patterns”
And if you want a routine that finds the few candles worth acting on in 15 minutes a day, grab the free 15-minute swing trader checklist.
About the author. Spencer Li is The 15-Minute Trader and the founder of Synapse Trading. He is a Certified Financial Technician (CFTe) with 15+ years of trading, run from 70+ countries. He holds a B.Acc and B.BM from SMU. Every trade he takes is public, dated, losses left in. He teaches rules-based swing trading in 15 minutes a day, one system for any market.
Education, not financial advice. Synapse Trading is not licensed by MAS to advise on investment products. Trading carries risk of loss, and past performance is not indicative of future results.
Want the daily routine? Enter your email for the free 15-Minute Swing Trader's Checklist.
Free 5-page PDF, then occasional trading emails. Education only, not financial advice. Unsubscribe anytime. Kit stores your email in the US: see our privacy policy.
Want to learn the full method? The Trading Mastery Program teaches the 4 strategies I have traded since 2011. It suits beginners and experienced traders.
Rather follow the trades as they happen? Daily Trading Signals is our Telegram channel: my trade ideas with entry, stop and exit, and every trade is public.
Questions about this post? Ask in the free Telegram channel →
Educational content only, not personalised financial advice. Trading carries risk, including loss of capital. Past performance is not indicative of future results. Synapse Trading is not licensed or regulated by MAS.

