

Bullish Counterattack Lines & Bearish Counterattack Lines
Want the daily routine? Get the free 15-Minute Swing Trader’s Checklist. Get it free →
The counterattack lines pattern is a two-candle reversal pattern observed on candlestick charts.
This pattern can emerge during either an uptrend or a downtrend.
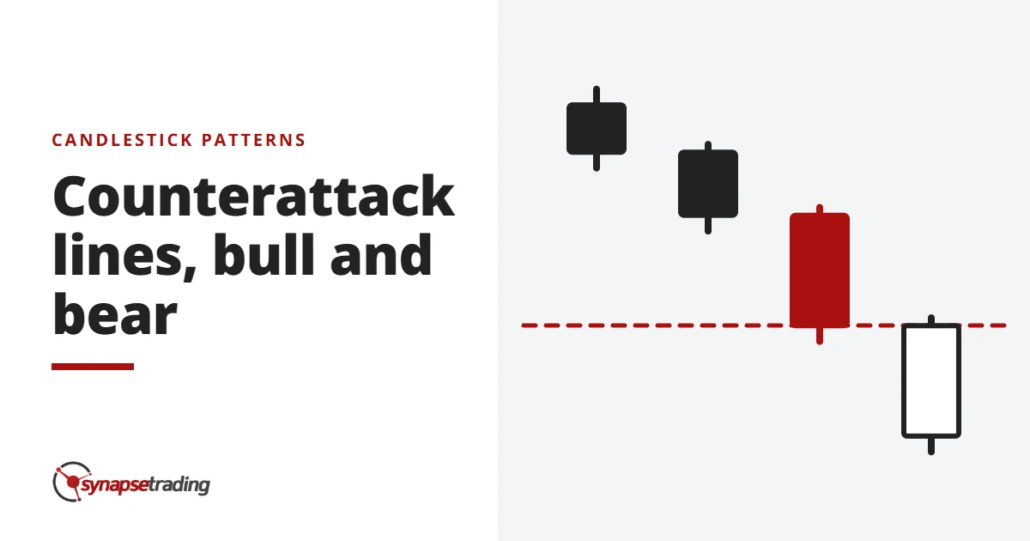
In the case of a bullish reversal during a downtrend, the first candle is a long black (down) candle, followed by a second candle that gaps down but then closes higher, near the close of the first candle.
This pattern indicates that while sellers were initially in control, they might be losing that control as buyers manage to close the gap down.
For a bearish reversal during an uptrend, the first candle is a long white (up) candle.
The second candle gaps higher but then closes lower, near the close of the first candle.
Understanding Counterattack Lines
The counterattack lines pattern shows that buyers might be losing control during an uptrend or that sellers might be losing control in a downtrend.
Bullish Counterattack Lines:
- The market is in a downtrend.
- The first candle is black (down) with a long real body.
- The second candle gaps down on the open, is white with a real body similar in size to the first candle, and closes near the first candle’s close.
Bearish Counterattack Lines:
- The market is in an uptrend.
- The first candle is white (up) with a long real body.
- The second candle gaps higher on the open, is black with a real body similar in size to the first candle, and closes near the first candle’s close.
The pattern typically signals that the initial trend may be unsustainable, leading to a potential reversal in the opposite direction of the initial trend.
Example of How to Use Counterattack Lines
Counterattack lines are most effective when used alongside other forms of technical analysis, as they do not always result in a trend reversal.
In the case of Apple Inc. (AAPL), a bullish counterattack line appeared during a downtrend.
While the strong buying on the second candle suggested a potential reversal, the price moved only slightly higher before continuing its downward trend.
However, in subsequent examples, the price did move higher following the pattern, confirming the bullish reversal.
Counterattack Lines vs. Engulfing Pattern
Both counterattack lines and engulfing patterns involve candles of opposite colors or directions.
However, in the engulfing pattern, the second candle’s real body fully envelops the real body of the first candle, whereas in counterattack lines, the candles are not required to overlap fully.
Limitations of Using Counterattack Lines
Counterattack lines may not be reliable on their own and typically require confirmation candles.
They are best used in conjunction with other technical analysis methods.
Additionally, candlestick patterns like counterattack lines do not provide profit targets, leaving the potential size of the reversal unknown.
The pattern may signal a long-term reversal or a short-lived one, and its infrequency means that opportunities to use it are limited.
Concluding Thoughts
Counterattack lines are useful for identifying potential reversals in market trends but should not be relied upon in isolation.
Their effectiveness increases when combined with other technical indicators and confirmation candles.
Traders should be mindful of the pattern’s limitations, including the lack of profit targets and its relatively rare occurrence.
Want the daily routine? Enter your email for the free 15-Minute Swing Trader's Checklist.
Free 5-page PDF, then occasional trading emails. Education only, not financial advice. Unsubscribe anytime. Kit stores your email in the US: see our privacy policy.
Want to learn the full method? The Trading Mastery Program teaches the 4 strategies I have traded since 2011. It suits beginners and experienced traders.
Rather follow the trades as they happen? Daily Trading Signals is our Telegram channel: my trade ideas with entry, stop and exit, and every trade is public.
Questions about this post? Ask in the free Telegram channel →
Educational content only, not personalised financial advice. Trading carries risk, including loss of capital. Past performance is not indicative of future results. Synapse Trading is not licensed or regulated by MAS.

