Performance Summary
Every figure below is calculated from the 470 closed trades published in the log on this page, covering 22 April 2024 to 3 August 2026. Open positions are excluded. The table is rebuilt from the log below, which updates itself as trades close.
Returns against the benchmarks
| Period | Daily Trading Signals | S&P 500 (SPY) | Nasdaq 100 (QQQ) |
|---|
| Trades entered 22 Apr to 31 Dec 2024 | +70.9% | +17.3% | +22.1% |
| Trades entered in 2025 | +110.0% | +16.4% | +20.2% |
| Trades entered in 2026, to 3 Aug | +23.2% | +11.1% | +14.0% |
| Since the first logged trade | +204.1% | +51.6% | +67.2% |
| Annualised equivalent | +62.9% | +20.0% | +25.3% |
A note on the yearly rows. The trade log records the date a trade was opened, not the date it was closed. The yearly rows above therefore group trades by the year they were entered, so a position opened in December 2025 and closed in February 2026 is counted in the 2025 row. The benchmark columns are calendar-period price returns. The two sides are close, but they are not exactly like for like.
Trade statistics
| Closed trades | 470 |
| Win rate | 50.2% (236 wins, 232 losses, 2 breakeven) |
| Average winning trade | +12.5% |
| Average losing trade | -3.9% |
| Win to loss ratio | 3.2 to 1 |
| Profit factor, gross wins divided by gross losses | 3.3 |
| Average result per trade | +4.3% |
| Largest single winner | +161.4% (QBTS) |
| Largest single loser | -19.0% (UBER) |
| Longest run of consecutive losses | 10 trades |
| Largest fall from a peak in the running total | -5.6% |
| Trade frequency | About 17 per month |
Where the returns came from
| Asset class | Trades | Win rate | Average per trade |
|---|
| Stocks | 229 | 50.2% | +6.1% |
| ETFs | 129 | 44.2% | +1.3% |
| Commodities | 60 | 65.0% | +6.0% |
| Crypto | 43 | 46.5% | +2.7% |
| Forex | 8 | 50.0% | +0.8% |
| Bonds | 1 | 100.0% | +5.7% |
How these numbers are calculated. Each trade is recorded as the price move from entry to exit. Portfolio returns assume 10% of capital per position, with no leverage and no compounding, which is the same basis used in the summary at the top of this page. The annualised row compounds the cumulative figure over the 2.28 years since the first logged trade, so it reads lower than the simple per-year figure in the summary box above, which divides the total by the months elapsed and includes open positions. Benchmark figures are price returns for SPY and QQQ measured over the same calendar dates, taken from Interactive Brokers market data on 21 August 2026, and they do not include dividends. Only closed trades are counted. Past performance is not indicative of future results, and results are not typical.
How to Read the Trade Log
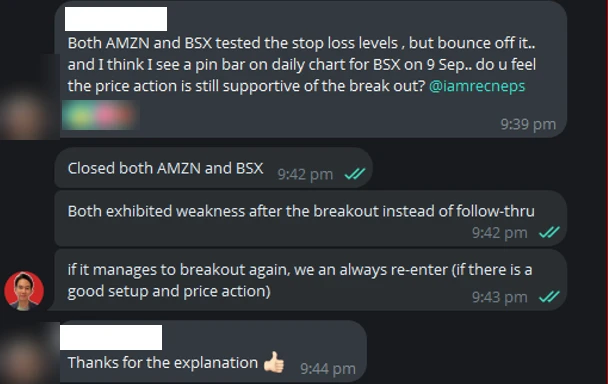
This is a record of all the trades posted in our “Daily Trading Signals” chat. Every trade is posted and time-stamped in the groupchat.
The cumulative gains shown include open trades, but only closed trades are posted here. Once existing trades are closed, they wil automatically be updated here for full transparency.
What do the results mean?
Net profit/loss shows the total profit you would make if you took every trade with 100% of your capital. In reality, a trader would risk about 1% of the trading capital, and take about 10 trades at a time (using 10% of the capital for each trade).
So if the net profit/loss shows 800%, your expected annual returns would be 800%/10 = 80%. This is because you only use 1/10 of your capital for each trade, assuming no leverage.