

Dumpling Top Candlestick Pattern: How to Read a Rounded Top Without Calling It Early
Want the daily routine? Get the free 15-Minute Swing Trader’s Checklist. Get it free →
By Spencer Li, CFTe · Last updated: 26 October 2026
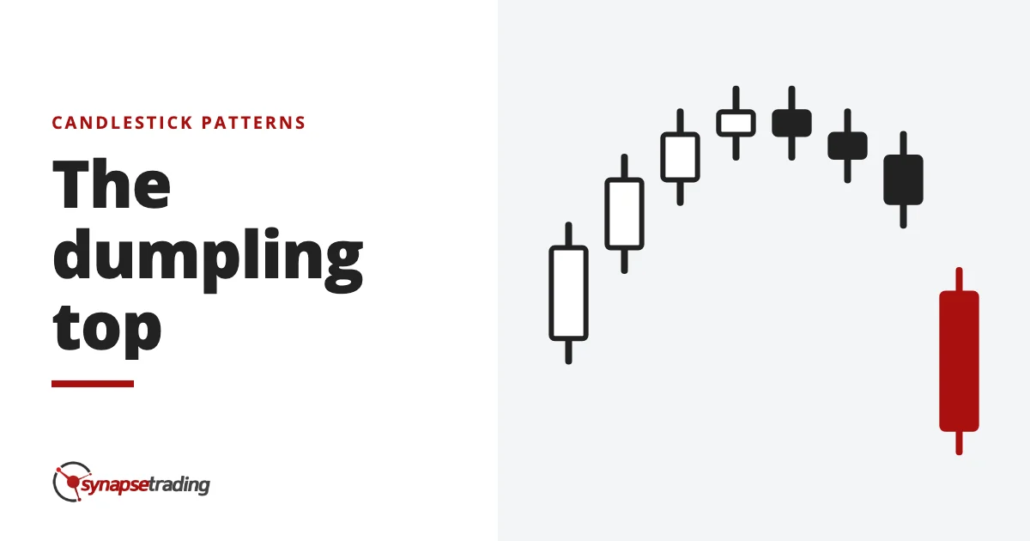
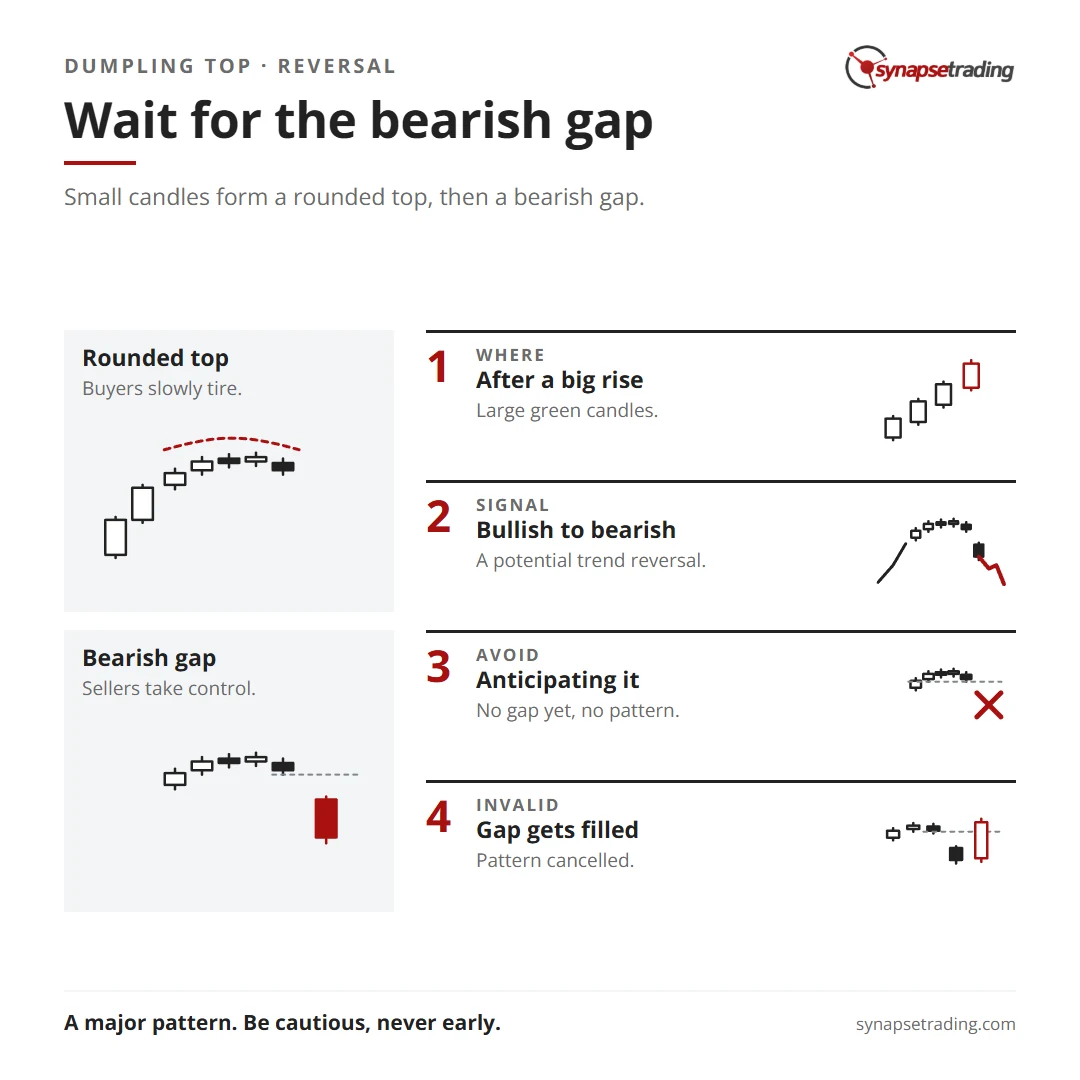
A dumpling top is a bearish reversal pattern made of several small candles that curve over into a rounded dome after a rise, followed by a candle that gaps down and closes lower. The dome shows buyers running out of energy, and the gap shows sellers finally taking over. The pattern only counts once that gap appears, and if price climbs back through the gap, the signal is cancelled. It is the mirror image of the frying pan bottom, and the single most useful thing to know about it is that the dome on its own tells you nothing you can act on.
What is a dumpling top?
Why would anyone name a chart pattern after a dumpling?
Look at a few small candles drifting up, flattening out and drifting back down, and the outline is a soft rounded lump sitting on the chart. That is the dumpling. Gregory Morris, in Candlestick Charting Explained, keeps the definition short. A dumpling top “is a rounded top similar to the rounded top in traditional technical jargon. The downtrend is confirmed by a gap to a black body.”
So the pattern has three parts, and each one has a job.
- The rise. There has to be an advance for the dome to sit on top of. Without one, there is nothing to reverse.
- The dome. A run of small candles, any colour, that rounds over. Small bodies mean neither side is pushing hard any more.
- The gap. A candle that opens below the dome and closes as a black, or red, body. This is the confirmation, and the Japanese call the gap a window.
Steve Nison, whose 1991 book Japanese Candlestick Charting Techniques brought candlesticks to most Western traders, files the dumpling top beside the fry-pan bottom as rounded turns that need a window in the new direction to count.
Why does a market round over instead of falling off a cliff?
Throw a ball straight up and watch the top of the throw. Gravity takes about 9.8 metres per second off its speed every second, so the ball slows steadily, hangs for a moment at zero, and only then starts to fall. Nobody pushed it down. It simply ran out of upward speed.
A dumpling top is the price version of that apex. Through the rise, each new buyer pays a little more than the last, and the candles are long because the buying is urgent. Then the urgent buyers are already in. The candles shrink, the highs stop rising, and price drifts over the top with nobody in a hurry on either side. Nison made a similar point about tops in general, that an up-move can die of its own weight, while a down-move usually needs active selling to get going.
Robert Edwards and John Magee, in Technical Analysis of Stock Trends, first published in 1948, studied the Western version of this shape, the rounding top. They found it rare in speculative stocks, where bull runs tend to end in “excited public buying” instead. The slow dome showed up most in quiet, high-grade issues, where demand changes as slowly as interest rates do. So when you see a clean dome on a fast-moving stock, it is worth asking whether the excitement really has drained out, or whether it is just taking a breath.
Reading which phase a chart is in is a daily habit, and my free 15-minute swing trader checklist is the routine I use to keep it.
Why is the gap the whole pattern?
The dome has an uncomfortable habit of keeping quiet. Edwards and Magee noticed that at rounding tops, volume is “apt to be rather high and irregular throughout the entire rounding-over movement”, and the warnings “do not become conspicuous in most cases until the downtrend has begun to accelerate”. In other words, the dome gives you very little to go on while it forms. It looks the same as a pause before the next leg up, right until it does not.
The gap is what separates the two. When a candle opens below the whole dome, everyone who bought on the way over is now holding a loss from the open, and they had no chance to sell in between. That is a very particular kind of regret, and it is the moment the balance tips.
Nison treats a window as more than a signal. It becomes a level. A falling window acts as resistance, so rallies back up to it tend to stall, and a close back above it voids the bearish read. In his follow-up book, Beyond Candlesticks, he puts the rule for a rising window plainly, that a close under the bottom of the window means the uptrend “can be considered over”. Flip it for a dumpling top. A close back above the top of the gap means the reversal did not take, and the pattern is cancelled.
I have watched this play out on live charts many times. In my weekly outlook on 11 December 2025, the morning after the Fed’s rate decision, I pointed to “a gap down that never really got closed” sitting right where price was trading. My read was simple. “If the prices get resisted here and it goes back down, then that will be the bearish sign.” The open gap was the level, and what price did at it was the answer.
How is a dumpling top different from a frying pan bottom and a tower top?
The three patterns are easy to mix up, because they all describe a slow change of direction. The difference is in the size of the candles and where the gap sits.
| Dumpling top | Frying pan bottom | Tower top | |
|---|---|---|---|
| Comes after | A rise | A fall | A rise |
| The turn | Small candles rounding over | Small candles rounding under | A long candle, a stall, then a long candle the other way |
| Confirmation | A gap down to a black candle | A gap up to a white candle | The long falling candle |
| What it signals | A possible turn lower | A possible turn higher | A possible turn lower |
Morris describes the frying pan bottom as a tower bottom made of small bodies, rounding out and confirmed by a gap up to a white day. The tower top carries the reversal in long candles and needs no window at all. So if you remember one thing, small candles and a gap make a dumpling, while long candles and no gap make a tower.
Why do traders get run over calling the top early?
On 6 April 2021, a trader on Reddit’s r/technicalanalysis posted a chart and asked about a rounding top that had formed after a fall: “What does it mean when it’s coming after a downtrend?”
It is a fair question, and the answer is that it is no longer a dumpling top. Morris and Nison both place the pattern after a rise, because its job is to end one. A dome after a decline is just a bounce that ran out of steam, and the gap that follows is more likely a continuation of the fall than a reversal of anything.
The more expensive mistake runs the other way. Imagine a stock that has run up for weeks, then prints five or six small candles that start to curve over. It feels obvious. You can almost see the dome finishing itself, and the fear of missing the top is real. So you sell short before the gap, and the next week the stock breaks out to a new high, because the dome was a rest, never a top. Being right too early costs the same as being wrong, and the books saw it coming. Nison called reversal patterns brake lights. They tell you the car may be slowing, which is a long way from telling you it is about to reverse.
Personally, I only act on a candle once it has closed, and never on the anticipation of one. My own playbook writes it as a rule, wait for the candle close, never the wick, never anticipation. For a dumpling top, the close that matters is the black candle below the gap.
If you would rather check this once a day than stare at a dome for a week, the free 15-minute swing trader checklist is the routine I run myself.
What will a dumpling top not tell you?
It will not tell you how far price will fall. Edwards and Magee were unusually blunt about rounding turns. “We know of no measuring formula that can be applied to Rounding Turns,” they wrote, and in the same breath, “But they almost never deceive.” That was a judgment from their study of stock charts up to 1948, without a count attached, and nobody should read it as a hit rate.
My own records cannot fill that gap either. As at 12 October 2026, 216 of my 478 closed trades carried a setup tag, but those tags name the setup, such as a breakout or a pullback, and not the candle pattern that triggered the entry. So I can tell you how the books describe a dumpling top, and I cannot tell you how many I have traded.
What it does tell you is who is in control, and when that changed. The dome says the buyers got tired. The gap says the sellers noticed. Everything after that, where to get in, where you are wrong and how big to go, is a separate decision, and it belongs to your plan, never to the shape.
FAQ
Is a dumpling top bullish or bearish?
Bearish. It forms after a rise and warns that the uptrend may be ending, once a gap down to a black candle confirms it.
What is the difference between a dumpling top and a frying pan bottom?
A dumpling top rounds over after a rise and gaps down, while a frying pan bottom rounds under after a fall and gaps up, so each is the other turned upside down.
What cancels a dumpling top?
A close back above the top of the gap. Nison treats a falling window as resistance, so price closing back through it voids the bearish read.
Should you act before the gap appears?
No. Before the gap, the dome looks the same as a pause before another leg up, and volume at rounding tops gives few clear warnings.
How is a dumpling top different from a rounding top?
They describe the same shape. Morris calls the dumpling top the candlestick version of the Western rounding top, with the added rule that a gap down confirms it.
Does a dumpling top tell you how far price will fall?
No. Edwards and Magee knew of no measuring formula for rounding turns. Targets come from the chart’s support levels and your own plan.
Have you ever sold a dome that turned out to be a rest? And when you see a gap down after a slow top, do you wait for the close, or does the fear of missing it get you in early? Let me know in the comments.
For every pattern in one place, read The Definitive Guide to Candlestick Patterns. Gaps have their own lore in candlestick charting, which I cover in the sanku, or three gaps, pattern. For the wider picture, start with my free trading guides.
And if you want a routine that reads these patterns without hours at the screen, grab the free 15-minute swing trader checklist.
About the author. Spencer Li is The 15-Minute Trader and the founder of Synapse Trading. He is a Certified Financial Technician (CFTe) with 15+ years of trading, run from 70+ countries. He holds a B.Acc and B.BM from SMU. Every trade he takes is public, dated, losses left in. He teaches rules-based swing trading in 15 minutes a day, one system for any market.
Education, not financial advice. Synapse Trading is not licensed by MAS to advise on investment products. Trading carries risk of loss, and past performance is not indicative of future results.
Want the daily routine? Enter your email for the free 15-Minute Swing Trader's Checklist.
Free 5-page PDF, then occasional trading emails. Education only, not financial advice. Unsubscribe anytime. Kit stores your email in the US: see our privacy policy.
Want to learn the full method? The Trading Mastery Program teaches the 4 strategies I have traded since 2011. It suits beginners and experienced traders.
Rather follow the trades as they happen? Daily Trading Signals is our Telegram channel: my trade ideas with entry, stop and exit, and every trade is public.
Questions about this post? Ask in the free Telegram channel →
Educational content only, not personalised financial advice. Trading carries risk, including loss of capital. Past performance is not indicative of future results. Synapse Trading is not licensed or regulated by MAS.

