Sanku (Three Gaps) Pattern
Join our Telegram channel for more market analysis & trading tips: t.me/synapsetrading
Sanku, also known as the Three Gaps pattern, is a Japanese candlestick pattern that consists of three distinct gaps occurring within a well-defined trend.
These gaps may occur consecutively or be separated by several candles.
The appearance of this pattern often suggests that the trend may be nearing exhaustion, signaling traders to watch for potential signs of a reversal.
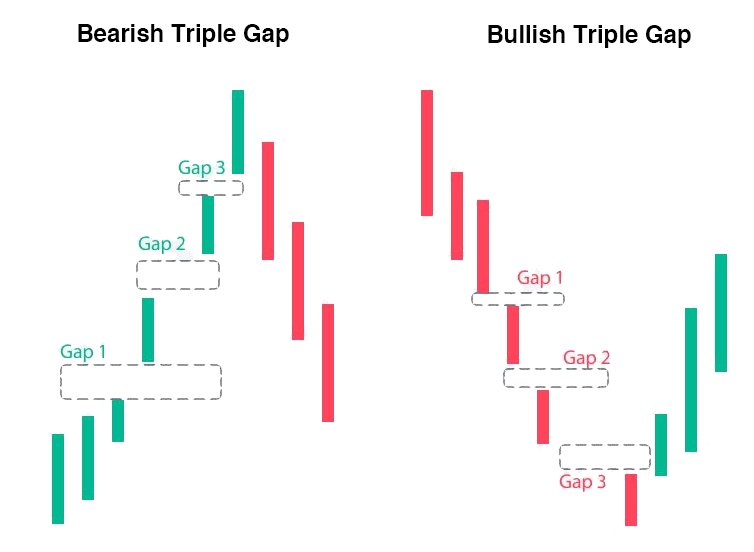
Table of Contents
Understanding the Sanku (Three Gaps) Pattern
The Sanku pattern can occur in both uptrends and downtrends.
In an uptrend, the pattern is referred to as the Rising Three Gaps, where three gaps higher are separated by rising candles.
Conversely, in a downtrend, the pattern is called the Falling Three Gaps, with three gaps lower separated by declining candles.
The gaps may be spaced out over several candles, not just one.
The Sanku pattern indicates strong price action, but it may not be sustainable for long.
In the Rising Three Gaps pattern, the gaps represent aggressive buying.
As the number of buyers diminishes, former buyers may start selling to lock in profits, which can signal the beginning of a reversal.
The pattern is a warning that the trend might be overheating, although it is not a definitive sign of reversal.
A reversal is more likely when the price fills the third gap by moving in the opposite direction.
For example, in an uptrend, if the price drops below the entire third gap, it could indicate that a reversal to the downside is in progress.
The same concept applies in a downtrend when the price moves up through the third gap.
Examples of How to Use the Sanku (Three Gaps) Pattern
The Sanku pattern is typically formed by a bullish candle, followed by a gap higher, another bullish candle, another gap higher, and then a final gap higher with another candle.
Each of these candles could consist of multiple smaller candles, especially in fast-moving markets.
Even two gaps with significant price moves between them can signal that the trend is nearing exhaustion.
For traders looking to lock in profits, the Sanku pattern suggests trailing stop losses behind recent candle lows or the lows of the most recent gap.
When the price drops below the most recent gap higher, it could indicate that the trend is reversing.
This could be a temporary pullback or a long-term top, depending on the context and size of the price moves during the pattern.
If the pattern leads to a long-term decline, it may be indicative of a climax top, especially if accompanied by very high volume.
Some traders may initiate short positions once the reversal begins, placing stop losses above the recent candle or the high of the entire pattern.
The Difference Between the Sanku (Three Gaps) Pattern and Three White Soldiers
The Sanku (Three Gaps) pattern and the Three White Soldiers pattern are both candlestick patterns, but they signal different market behaviors.
The Three White Soldiers pattern occurs after a downtrend and consists of three large upward candles, indicating a potential new uptrend.
In contrast, the Falling Three Gaps pattern occurs during a downtrend and is part of the Sanku pattern.
Limitations of the Sanku (Three Gaps) Pattern
Not all Sanku patterns will result in a reversal.
Consecutive small gaps can occur in uptrends or downtrends for extended periods, which might lead traders to exit positions prematurely and miss out on further gains.
Determining which three gap patterns are significant is subjective.
The larger the price moves and gaps, the more important the pattern is likely to be.
The overall context and market outlook are also crucial.
The Sanku pattern may result in only a minor pullback, or it could precede a full trend reversal.
Finally, the Sanku pattern does not provide a specific profit target, so traders need to use other analysis methods to determine when to exit trades based on this pattern.
Concluding Thoughts
The Sanku (Three Gaps) pattern is a powerful candlestick formation that can signal the potential exhaustion of a trend.
While it can indicate an impending reversal, traders should be cautious and consider the overall context before making trading decisions based on this pattern.
As with any technical analysis tool, combining the Sanku pattern with other indicators and analysis methods can help improve the reliability of trading decisions.
 Our flagship mentoring program is suitable for both beginners and advanced traders, covering the 4 strategies which I used over the past 15 years to build up my 7-figure personal trading portfolio.
 If you're looking for the best trading opportunities every day across various markets, and don't want to spend hours doing the research yourself, check out our private Telegram channel!

Leave a Reply
Want to join the discussion?Feel free to contribute!