The yen carry trade has long been a cornerstone of global financial strategies, allowing investors to leverage Japan’s low-interest rates for higher returns abroad.
However, recent developments have put this once-reliable trade under pressure.
In this blog post, I will explain what the yen carry trade is, its historical context, the reasons behind its current unwinding, and how it will affect the various financial markets.
What is the Yen Carry Trade?
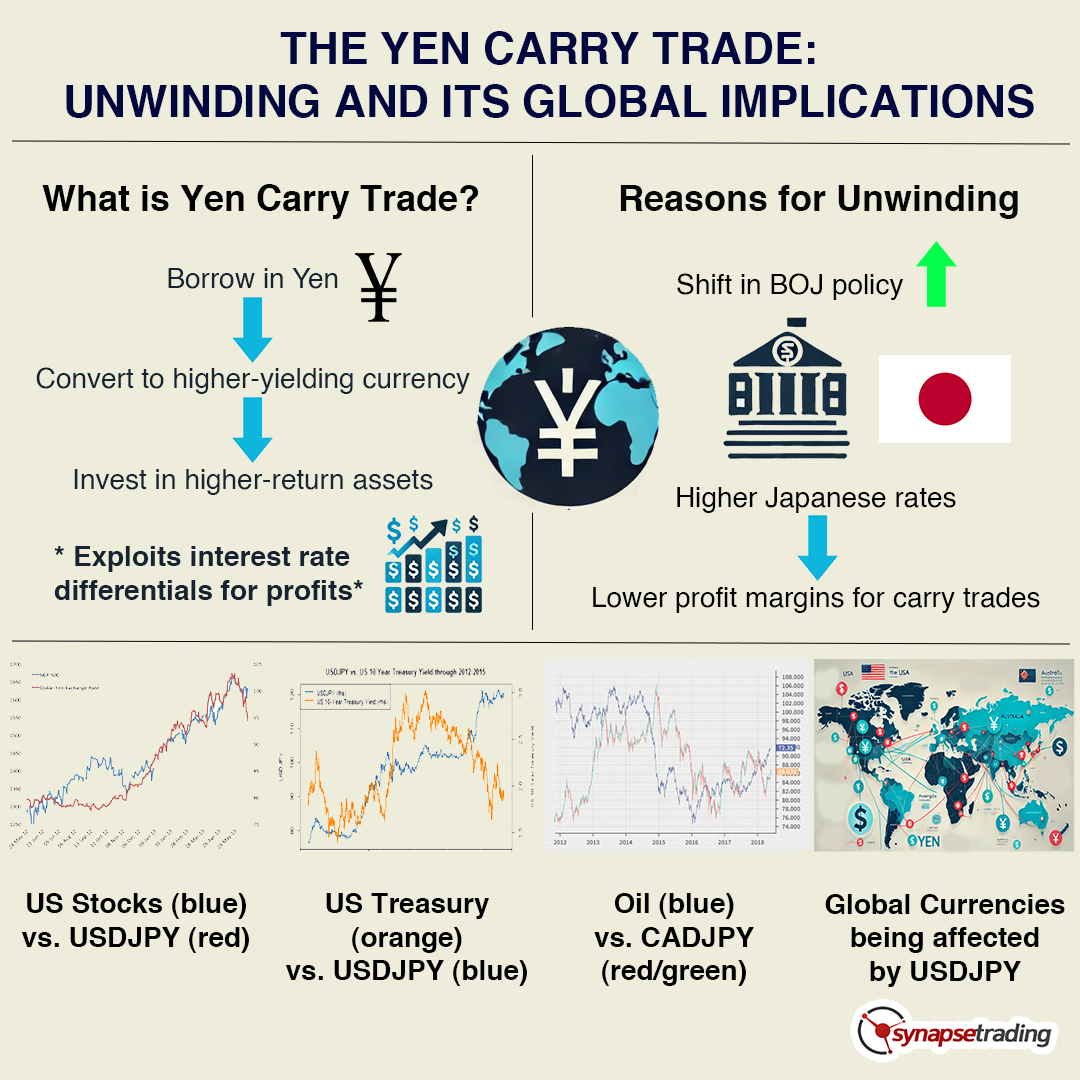
The yen carry trade involves borrowing funds in Japanese yen, where interest rates are typically very low, and then converting these funds into a currency with higher interest rates to invest in assets that yield better returns.
This strategy exploits the differential in interest rates between Japan and other countries, allowing investors to profit from the spread. Historically, it has been a lucrative endeavor, with minimal cost for borrowing in yen and potential for significant gains in higher-yielding currencies and assets.
To elaborate, the core mechanism of the yen carry trade is based on the interest rate differential. Japan has maintained one of the lowest interest rates among developed countries, often near or at zero.
Investors borrow in yen at these low rates and convert the yen into currencies like the U.S. dollar or Australian dollar, where interest rates are higher. The borrowed funds are then invested in assets that provide higher returns, such as government bonds, corporate bonds, equities, or real estate in those higher-yielding currencies.
The profit for the investor comes from the difference between the low cost of borrowing in yen and the higher returns on the investments made in other currencies.
For example, if an investor borrows yen at an interest rate of 0.1% and invests in U.S. Treasury bonds yielding 2%, the investor earns the difference, minus any exchange rate changes. This trade is particularly attractive during periods of stable or appreciating currencies against the yen, as any gain in the target currency further enhances returns.
Historical Context
The yen carry trade gained popularity in the late 1990s and early 2000s as Japan maintained ultra-low interest rates in response to its prolonged economic stagnation. The Bank of Japan’s (BOJ) commitment to near-zero rates created a fertile ground for this strategy.
Investors flocked to borrow in yen and invest in higher-yielding assets worldwide, driving significant capital flows across global markets. This trade contributed to liquidity in financial markets and often amplified asset price movements.
In the 1990s, Japan’s economy was grappling with the aftermath of the asset bubble burst. The BOJ slashed interest rates to stimulate economic activity, making borrowing extremely cheap.
This environment catalyzed the yen carry trade, attracting global investors who could borrow yen at negligible costs. By the early 2000s, this strategy was widespread, influencing capital flows and asset prices globally.
The 2008 financial crisis marked a significant moment for the carry trade. As global markets plunged, investors scrambled to unwind their yen positions, leading to a sharp appreciation of the yen.
This episode highlighted the inherent risks of the carry trade—while it could be highly profitable in stable times, it also posed substantial risks during periods of market turbulence.
Why is the Trade Unwinding Now?
The yen carry trade is unwinding primarily due to the recent policy shifts by the Bank of Japan. For the first time in many years, the BOJ has signaled an end to its ultra-loose monetary policy by lifting its main interest rate. This move, aimed at combating inflation and stabilizing the economy, has had profound implications for the carry trade.
As Japan’s interest rates rise, the cost of borrowing in yen increases, reducing the profitability of the carry trade. Consequently, investors are beginning to unwind their positions, repaying yen-denominated debt and selling off foreign assets.
In detail, the BOJ’s decision to raise interest rates is a response to rising inflationary pressures. Japan, historically plagued by deflation, is now facing inflationary trends similar to other advanced economies.
To curb inflation, the BOJ has started to tighten its monetary policy, which includes raising interest rates. This change increases the cost of borrowing in yen, thereby diminishing the appeal of the carry trade.
As the yen appreciates, the cost of repaying yen-denominated loans increases, prompting investors to close their positions.
The rapid unwinding has created significant volatility in financial markets, particularly in assets that were popular targets of the carry trade, such as U.S. equities and emerging market currencies.
What is the Significance of This?
The unwinding of the yen carry trade is significant for several reasons.
Firstly, it signals a major shift in Japanese monetary policy, which has been a cornerstone of global financial markets for decades.
Secondly, it highlights the interconnectedness of global markets, where a policy change in Japan can ripple through to impact asset prices and capital flows worldwide. The yen exchange rate has become a key driver of global markets, indicating the profound influence of Japanese monetary policy on international financial dynamics.
This shift underscores the global dependency on Japanese monetary policy.
For years, the yen carry trade has been a source of global liquidity, supporting asset prices and economic growth in various regions. The BOJ’s policy shift not only affects Japan but also has broad implications for global financial stability.
The yen’s appreciation and the subsequent market reactions demonstrate how deeply intertwined global financial systems are, with Japan playing a pivotal role.
How Does it Affect the Markets?
The impact of the yen carry trade unwinding is already being felt across various markets.
The rapid appreciation of the yen against the U.S. dollar has caught many market participants off guard. Over the last month, the yen has surged approximately 8% against the dollar, a stark contrast from its depreciation earlier in the year. This sudden rally has triggered a sell-off in U.S. equities, as investors unwind their carry trade positions, leading to downward pressure on asset prices.
This market reaction highlights the vulnerabilities in financial markets to changes in the yen exchange rate. The appreciation of the yen increases the cost of repaying yen-denominated debt, prompting investors to liquidate assets to meet these obligations. This selling pressure has led to declines in equity prices and increased volatility in financial markets.
Deep Dive on Specific Markets
- U.S. Equities: The U.S. stock market has experienced increased volatility and a broad slump as the yen appreciates. The unwinding of the carry trade leads to selling pressure on U.S. equities, exacerbating declines in stock prices. This negative reaction of U.S. equity prices is an early warning of the challenges ahead.The relationship between the yen carry trade and U.S. equities is significant because many investors use borrowed yen to invest in U.S. stocks. When the yen strengthens, these investors face higher costs to repay their loans, leading them to sell their U.S. stock holdings. This selling pressure contributes to market declines and increased volatility.
- U.S. Government Debt: The yields on U.S. government bonds have also been affected. As investors sell foreign assets to repay yen-denominated debt, there is a shift in demand dynamics for U.S. Treasuries, influencing yields and bond prices.Typically, during periods of financial stress, U.S. Treasuries are seen as a safe haven. However, the unwinding of the carry trade can lead to complex dynamics. While some investors may flock to Treasuries for safety, others may sell them to cover their yen-denominated liabilities, leading to fluctuating yields.
- Global Currency Markets: The yen’s rally has had a ripple effect on other currencies, particularly those that were heavily borrowed against in carry trades. This includes higher-yielding currencies like the Australian dollar and emerging market currencies, which have seen increased volatility and depreciation against the yen.The strength of the yen affects global currency markets by altering the dynamics of capital flows. Currencies that were favored in carry trades may experience significant depreciation as investors unwind their positions. This can lead to heightened volatility and potential financial instability in countries reliant on these capital flows.
- Commodities: Commodity markets are also impacted as the unwinding of the carry trade affects global liquidity and risk sentiment. A stronger yen can lead to reduced commodity prices, as Japan is a significant importer of raw materials.Commodities are sensitive to changes in global liquidity and risk sentiment.The unwinding of the carry trade can reduce liquidity, leading to lower demand for commodities. Additionally, a stronger yen makes imports cheaper for Japan, potentially reducing the global prices of commodities such as oil and metals.
Concluding Thoughts
The unwinding of the yen carry trade is a pivotal development in global financial markets, driven by the Bank of Japan’s shift in monetary policy. Its effects are far-reaching, impacting equities, bonds, currencies, and commodities worldwide. As the yen appreciates, the vulnerabilities in global markets are laid bare, underscoring the interconnectedness of financial systems.
Investors and policymakers alike must navigate these changes with an understanding of the intricate dynamics at play, ensuring strategies are adapted to this new financial landscape.
Now that I have shared all about the Yen carry trade unwinding, here are some questions to ponder about:
- How might the unwinding of the yen carry trade influence the stability and valuation of emerging market currencies that were previously beneficiaries of this strategy?
- What potential long-term impacts could the shift in Japanese monetary policy have on global equity markets, particularly in terms of investment flows and asset allocation strategies?
Let me know your answers in the comments below.