

What is the FOMC (Federal Open Market Committee) Meeting and How to Trade it?
Want the daily routine? Get the free 15-Minute Swing Trader’s Checklist. Get it free →
What is the FOMC, and Why Does It Move the Market?
Last updated: 1 September 2026 · By Spencer Li, CFTe
The FOMC (Federal Open Market Committee) is the branch of the U.S. Federal Reserve that sets monetary policy, mainly the federal funds rate (the interest rate at which banks lend to each other overnight). It meets eight times a year, about every six weeks, and after each meeting it releases a statement, economic projections, and forward guidance (its signal about where policy is headed). Markets move on these meetings because interest rates set the price of money: when the Fed raises rates, bond yields tend to rise and bond prices fall, and riskier assets like stocks often come under pressure; when it cuts, the reverse tends to happen. So when traders ask “why does the FOMC matter,” the short answer is that it is one of the few scheduled events that can re-price stocks, bonds, and currencies all at once, on a known date and time. That last part is the useful bit. You always know when it is coming.
Here is what the FOMC is, what it actually decides, and how traders read it without getting run over.
What is the FOMC and where did it come from?
The FOMC is part of the Federal Reserve System, the central bank of the United States. It took its current form under the Banking Act of 1935. Its job is monetary policy: setting interest rates and using other tools to influence the economy.
It has 12 voting members:
- The seven members of the Board of Governors (appointed by the U.S. President, confirmed by the Senate, serving 14-year terms).
- The president of the New York Fed, plus four of the other 11 Reserve Bank presidents, who rotate on one-year terms.
So it is not one person turning a dial. It is a committee, and committees disagree, which is why the dissents in a vote are worth reading.
How does the FOMC operate?
The committee meets eight times a year, roughly every six weeks, on a schedule set well in advance and published on the Federal Reserve’s website. Meetings are held in Washington, D.C., and usually run two days.
The “set well in advance” part is the trader’s gift here. Unlike most market-moving news, an FOMC meeting is on the calendar months ahead. You can plan around it.
What comes out of an FOMC meeting?
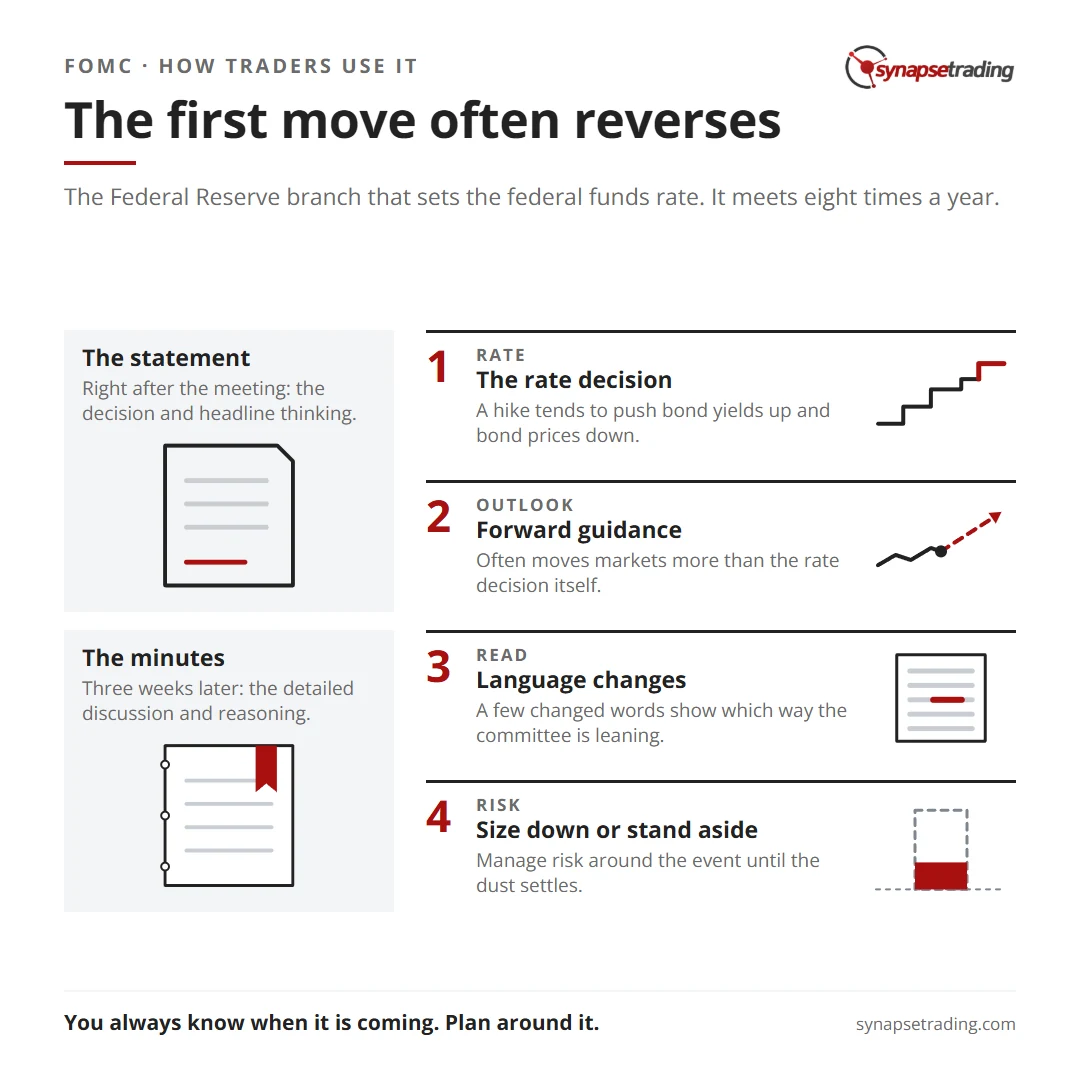
After each meeting, the FOMC publishes a statement. It covers current economic conditions, the policy decision, and anything else the committee wants on the record. It is one of the most closely read documents in finance because it shows the committee’s thinking, not just its action.
Here is what the statement and its companion releases actually contain, and why each line matters to a trader:
| What is released | What it tells you | Why a trader watches it |
|---|---|---|
| Federal funds target range | The current overnight interest rate band | Direct driver of bond yields and the cost of money |
| The vote (and any dissents) | How united the committee is | Dissents hint at where policy could swing next |
| Economic projections (four meetings a year) | Expected path of rates, GDP, unemployment, inflation | Shapes the outlook for stocks and riskier assets |
| Assessment and balance of risks | The committee’s read on the economy | Frames whether the bias is toward tightening or easing |
| Forward guidance / language changes | Signal about future policy | Often moves markets more than the rate decision itself |
Two more timing notes worth knowing. The data in the statement is not revised after the meeting, but the committee may tweak the statement language at every meeting, and it publishes fresh economic projections at four of the eight (March, June, September, December). And the minutes, the detailed account of the discussion and reasoning, come out three weeks later. The statement is the headline; the minutes are the footnotes, and the footnotes sometimes move the market a second time.
How do traders and investors actually use FOMC data?
The statement and projections shape the direction of interest rates, and through rates, the value of stocks, bonds, and currencies. Most traders watch a few specific things:
- The rate decision itself. A hike tends to push bond yields up and bond prices down; a cut tends to do the opposite. Fixed-income positions react first.
- The economic projections. If the committee expects strong growth, traders may lean toward stocks. If it expects weakness, money often rotates toward the relative stability of bonds.
- The forward guidance. If the Fed signals rates will stay low for a while, that can support stocks in the short term. If it signals hikes are coming, traders may tilt defensive.
- The language changes. A few changed words on inflation or the balance of risks can tell you which way the committee is leaning before the numbers do.
Notice the pattern. None of this is about predicting the decision. It is about reading the committee’s bias and positioning for the direction of travel.
News trading on FOMC data
“News trading” means trading the reaction to a scheduled release, in this case the FOMC. A few ways traders approach it:
- Interest rate decisions. A surprise hike can knock bond prices down as yields jump; a surprise cut can lift them. Traders adjust positions around the gap between what was expected and what was delivered.
- Economic projections. Stronger-than-expected growth projections can support stocks; weaker ones can weigh on them.
- Forward guidance. A shift in guidance changes expectations for future policy. A signal of near-term hikes, for instance, can pressure bond prices ahead of the actual move.
- Statement language changes. A change in tone on inflation or risk can reset expectations for rates, GDP, unemployment, and inflation all at once.
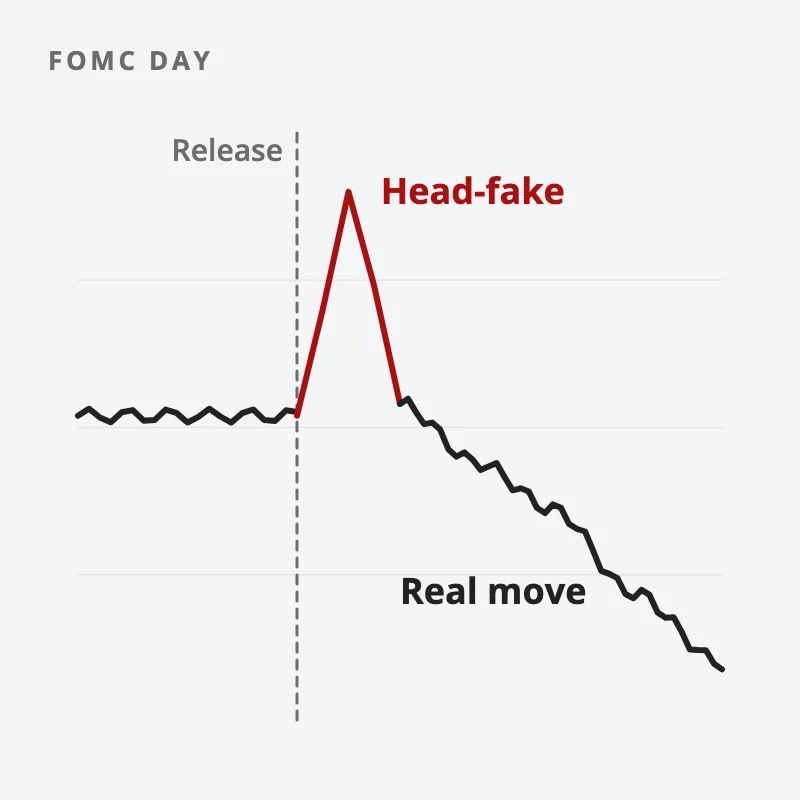
The first move is often a head-fake: price spikes one way on the headline, then reverses once traders finish reading the detail. The spread widens, the volatility is brutal, and the algorithms are faster than you are. For most swing traders, the better edge is not guessing the number. It is knowing a high-volatility event is on the calendar and managing risk around it, sizing down, or simply standing aside until the dust settles.
Where the human edge comes in
A news calendar will flag the FOMC date for you. A model can even forecast the rate decision. Neither will tell you to ignore the first 15-minute whipsaw, or to skip the trade entirely on a day when the edge is just noise. Should you size down into the event? No AI you can buy in Singapore is allowed to tell you, and a calendar was never built to. The calendar is the easy part. Knowing when not to trade an event this volatile is judgment, the first of the Five Edges that no algorithm trades for you.
FAQ
What does FOMC stand for?
FOMC stands for the Federal Open Market Committee, the branch of the U.S. Federal Reserve that sets monetary policy, mainly the federal funds interest rate.
How often does the FOMC meet?
The FOMC meets eight times a year, about every six weeks, on a schedule published in advance on the Federal Reserve’s website. Each meeting usually runs two days in Washington, D.C.
Why does the stock market move on FOMC days?
Because the FOMC sets interest rates, which set the price of money. A rate change or a shift in forward guidance can re-price bonds, stocks, and currencies at once, so traders react fast to even small surprises.
What is the difference between the FOMC statement and the minutes?
The statement comes out right after the meeting and gives the decision and the committee’s headline thinking. The minutes come out three weeks later and give the detailed discussion and reasoning behind the decision.
Should beginners trade the FOMC announcement?
For most beginners, no. The first move after the release is often a head-fake that reverses once the detail is read, and the volatility is hard to manage. It is usually safer to size down or stand aside around the event than to trade the headline.
Now that you know what the FOMC is and how its decisions ripple through the market, is it something you will add to your trading toolbox? Let me know in the comments.
And if you want the bigger picture on trading scheduled news without getting whipsawed, read the pillar: The Complete Guide to News Trading and Economic Events.
Want a calmer way to trade? Grab the free 15-Minute Swing Trading Starter Kit. It’s the exact routine I use to scan once a day and trade any market in 15 minutes, FOMC week included.
About the author. Spencer Li is The 15-Minute Trader and the founder of Synapse Trading. He is a Certified Financial Technician (CFTe) with 15+ years of trading, run from 70+ countries. He holds a B.Acc and B.BM from SMU. Every trade he takes is public, dated, losses left in. He teaches rules-based swing trading in 15 minutes a day, one system for any market.
Education, not financial advice. Synapse Trading is not licensed by MAS to advise on investment products. Trading carries risk of loss; past performance is not indicative of future results.
Related
The Complete Guide to News Trading and Economic Events · How to Profit from Interest Rate Cuts? · How to Trade the News (Especially When There is Too Much Market News)
Want the daily routine? Enter your email for the free 15-Minute Swing Trader's Checklist.
Free 5-page PDF, then occasional trading emails. Education only, not financial advice. Unsubscribe anytime. Kit stores your email in the US: see our privacy policy.
Want to learn the full method? The Trading Mastery Program teaches the 4 strategies I have traded since 2011. It suits beginners and experienced traders.
Rather follow the trades as they happen? Daily Trading Signals is our Telegram channel: my trade ideas with entry, stop and exit, and every trade is public.
Questions about this post? Ask in the free Telegram channel →
Educational content only, not personalised financial advice. Trading carries risk, including loss of capital. Past performance is not indicative of future results. Synapse Trading is not licensed or regulated by MAS.

