

Book Summary: Evidence-Based Technical Analysis by David Aronson
Want the daily routine? Get the free 15-Minute Swing Trader’s Checklist. Get it free →
Evidence-Based Technical Analysis by David Aronson: Summary and Key Lessons
Last updated: 11 August 2026 · By Spencer Li, CFTe
Evidence-Based Technical Analysis by David Aronson is a 2006 book that applies the scientific method and statistical inference to chart-based trading signals, arguing that most traditional technical analysis is subjective interpretation that has never been properly tested. Aronson’s core claim is simple: a pattern or indicator only earns a place in your trading if it survives a rigorous statistical test, not because it looks good on a hand-picked chart. The book teaches you how to run those tests yourself, using hypothesis testing, Monte Carlo simulation (running thousands of randomised what-if scenarios to see if a result could be luck), and Bayesian inference (updating your probability estimate as new data arrives). It is worth reading if you want to stop trading on stories and start trading on evidence. Do note that it is dense, stats-heavy, and aimed at short-term traders working mostly with stocks, so it is not a casual beach read.
Here is what the book actually argues, the ideas worth keeping, and how to apply them without a statistics degree.
Who is David Aronson?
David Aronson is a statistician and quantitative analyst who has applied data analysis to markets since 1982, when he founded Raden Research Group. He is a CMT, an adjunct professor of finance at Baruch College and a former proprietary trader at Spear Leeds & Kellogg. His later book, with Timothy Masters, is Statistically Sound Machine Learning for Algorithmic Trading of Financial Instruments (2013).
That background matters, because it tells you the lens. Aronson is not a chart guru selling you a pattern. He is a statistician asking an uncomfortable question: can you prove any of this works? Most technical analysis books never ask it. This one is built around it.
What is Evidence-Based Technical Analysis about?
The book is about using scientific methods to separate the technical analysis that works from the technical analysis that only looks like it works.
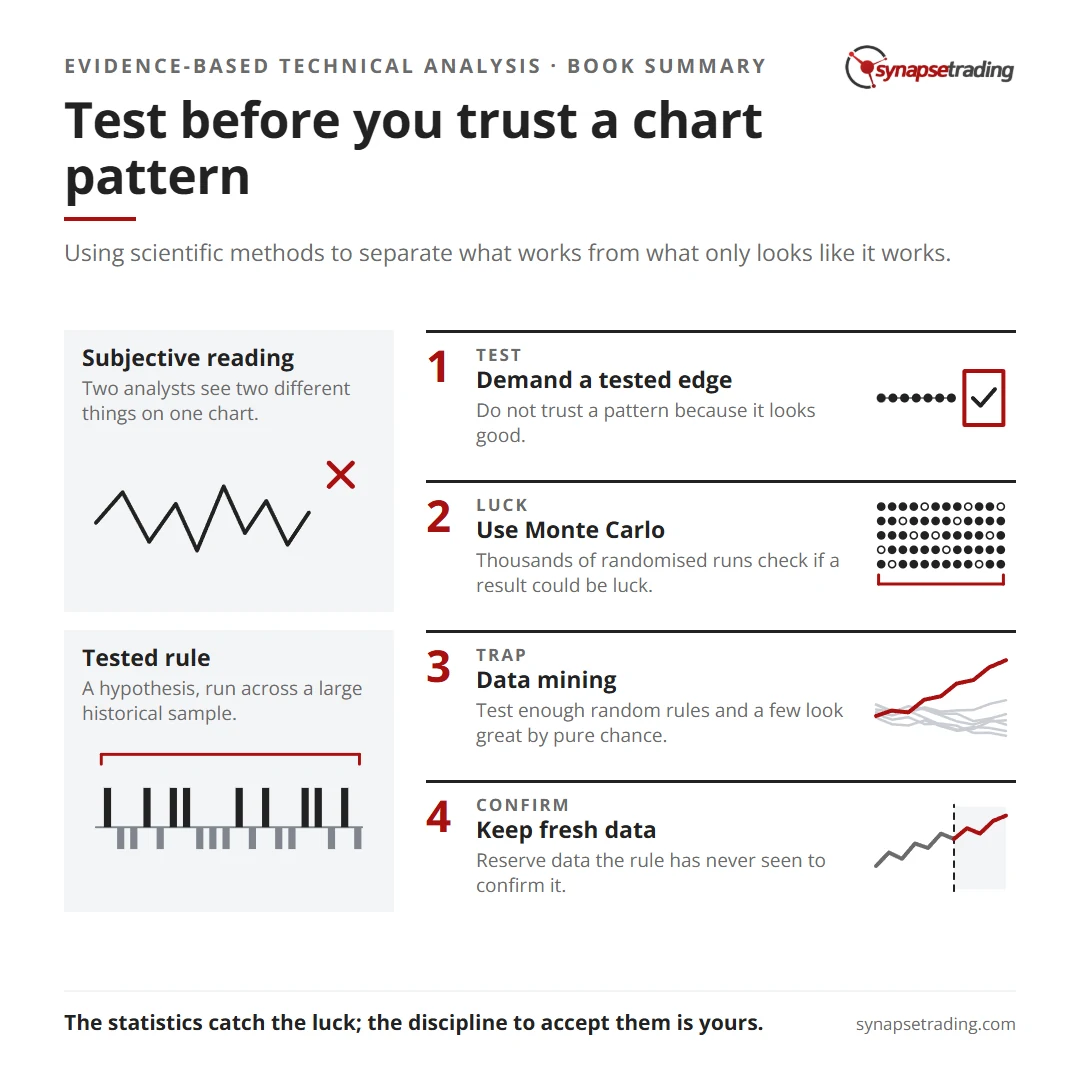
Aronson’s argument runs like this. Traditional technical analysis leans on subjective reading of charts and patterns. Two analysts look at the same chart and see two different things. That subjectivity produces inconsistent, unreliable results, and worse, it is unfalsifiable: if the pattern fails, you can always say you read it wrong rather than admit the pattern itself is useless.
His fix is to treat every trading rule as a hypothesis to be tested against data. Run the rule across a large historical sample. Measure whether its returns are genuinely better than random. If they are not, throw the rule out, no matter how convincing the chart looked. He walks through the statistical machinery to do this honestly, including how to avoid fooling yourself with data mining (testing so many rules that one looks good by pure chance).
Personally, this is the part I value most. It is not the specific tests. It is the mindset shift from “this pattern feels right” to “show me the numbers, then show me they are not luck.”
The 10 key ideas, and how to actually use each one
The book gives you ideas and a method. Most readers absorb the ideas and never apply them. So here is each core idea paired with the one practical move that turns it into something you do, not just something you nodded at.
| Key idea from the book | How to apply it |
|---|---|
| Traditional technical analysis is subjective and often unreliable | Stop trusting a pattern because it “looks good”; demand a tested edge before you risk money |
| Statistical methods raise the accuracy of your predictions | Treat every trading rule as a hypothesis and test it on data before you trade it |
| Use data to test your trading ideas | Keep a historical sample and run your rule across all of it |
| Hypothesis testing and Monte Carlo simulation evaluate strategies | Use Monte Carlo (thousands of randomised runs) to check whether a result could just be luck |
| Indicators like moving averages and RSI are tools, with limits | Know what each indicator actually measures, then test if it adds edge in your market |
| Bayesian inference updates probabilities as new data arrives | Adjust your confidence in a setup as fresh results come in, do not anchor to the first read |
| Risk management and stop-loss orders limit losses | Define your stop and position size before entry, every time, no exceptions |
| Combine technical with fundamental and news analysis | Use chart signals alongside context |
| Backtesting evaluates a strategy on historical data | Backtest honestly, and reserve fresh data the rule has never seen to confirm it |
| Excel and software tools implement the methods | You do not need to code; a spreadsheet is enough to start testing rules properly |
The thread running through every row is the same: test before you trust.
The trap the book is really warning you about
Here is the quiet danger Aronson keeps circling, and it is the most useful thing in the book.
If you test enough rules against enough data, some of them will look profitable by pure chance. Test a thousand random rules and a handful will have a great-looking equity curve that means absolutely nothing. This is data mining, and it has wrecked more “backtested” systems than bad luck ever has.
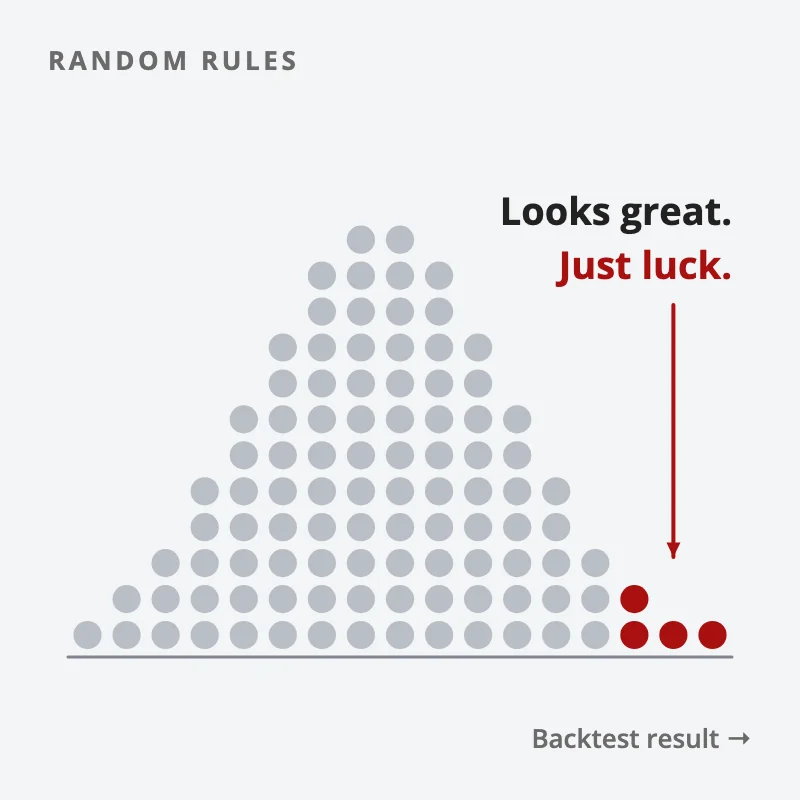
The cure is statistical discipline. You account for how many rules you tested. You use methods like Monte Carlo to ask, “could this result have happened by random chance?” And you keep a slice of data the rule has never touched, so a strategy that only memorised the past gets caught before it costs you real money.
Most traders skip this and wonder why their amazing backtest dies in live trading. The book exists to stop that.
Where the human edge comes in
Aronson hands you the toolkit to test signals, and that toolkit gets cheaper and faster every year. A modern scanner or AI can backtest a thousand rules before you finish your coffee. That part is close to free now.
What it will not do is keep you honest. It will not stop you from running the test a hundred ways until one version looks good. It will not tell you that your beautiful backtest curve is overfit nonsense, or that you cherry-picked the sample, or that you should walk away from a system that “works” only on data it has already seen. The statistics catch the luck; the discipline to accept what the statistics say is yours. That judgment, the willingness to kill your own good-looking idea because the evidence says so, is the first of the Five Edges no machine can trade for you.
Who should read this book?
Read it if you are a short-term trader who wants to stop guessing and start testing, and you are comfortable with a book that takes statistics seriously. It includes an introductory chapter for readers new to the stats, so you do not need to arrive fluent, but you do need patience.
Skip it, or save it for later, if you want quick setups you can trade tomorrow morning. This book changes how you think about markets. It is focused on short-term trading, mostly in stocks, though the testing mindset travels to any market. And it explains the statistical methods clearly without giving you step-by-step software instructions, so you bring the implementation.
Personally, I would put it on the list of any serious trader who has ever lost money on a pattern that “always works.” It is the book that explains why it did not.
FAQ
What is Evidence-Based Technical Analysis about?
It argues that most traditional technical analysis is subjective and untested, and shows how to use statistical methods, hypothesis testing, Monte Carlo simulation, and Bayesian inference, to test whether a trading signal genuinely works or only looks good on a chart.
Is Evidence-Based Technical Analysis worth reading?
Yes, if you are a short-term trader who wants to test your ideas rigorously and you are comfortable with statistics. It is dense and stats-heavy, so it is less suited to beginners wanting ready-made setups.
Who is David Aronson?
David Aronson is a statistician and quantitative analyst who has applied data analysis to markets since 1982, when he founded Raden Research Group. He is a CMT, an adjunct professor of finance at Baruch College and a former proprietary trader at Spear Leeds & Kellogg. He wrote Evidence-Based Technical Analysis and, with Timothy Masters, Statistically Sound Machine Learning for Algorithmic Trading of Financial Instruments (2013).
Do I need to know statistics to read it?
Some basic statistics helps, but the book includes an introductory chapter for newcomers. You do not need to code; a spreadsheet is enough to start applying the methods.
What is the main lesson of the book?
Do not trust a pattern or indicator because it looks good. Treat every trading rule as a hypothesis, test it against data, and use statistical discipline (especially guarding against data mining) to make sure the result is not just luck.
So, would you add Evidence-Based Technical Analysis to your reading list? And if you have already read it, what stuck with you? Let me know in the comments.
If you want the wider map of which trading books are worth your time, read the pillar: Best Investing and Trading Books of All Time.
Want the system behind the testing? Grab the free 15-Minute Swing Trading Starter Kit, the exact routine I use to scan once a day and trade any market in 15 minutes, built on rules I have actually tested.
About the author. Spencer Li is The 15-Minute Trader and the founder of Synapse Trading. He is a Certified Financial Technician (CFTe) with 15+ years of trading, run from 70+ countries. He holds a B.Acc and B.BM from SMU. Every trade he takes is public, dated, losses left in. He teaches rules-based swing trading in 15 minutes a day, one system for any market.
Education, not financial advice. Synapse Trading is not licensed by MAS to advise on investment products. Trading carries risk of loss; past performance is not indicative of future results.
Related
Best Investing and Trading Books of All Time · Trading in the Zone by Mark Douglas · Reminiscences of a Stock Operator · How to start backtesting a trading strategy
Want the daily routine? Enter your email for the free 15-Minute Swing Trader's Checklist.
Free 5-page PDF, then occasional trading emails. Education only, not financial advice. Unsubscribe anytime. Kit stores your email in the US: see our privacy policy.
Want to learn the full method? The Trading Mastery Program teaches the 4 strategies I have traded since 2011. It suits beginners and experienced traders.
Rather follow the trades as they happen? Daily Trading Signals is our Telegram channel: my trade ideas with entry, stop and exit, and every trade is public.
Questions about this post? Ask in the free Telegram channel →
Educational content only, not personalised financial advice. Trading carries risk, including loss of capital. Past performance is not indicative of future results. Synapse Trading is not licensed or regulated by MAS.

