

Fibonacci Analysis by Constance Brown: A Summary, and How to Pick a Range That Holds Up
Want the daily routine? Get the free 15-Minute Swing Trader’s Checklist. Get it free →
By Spencer Li, CFTe · Last updated: 26 October 2026
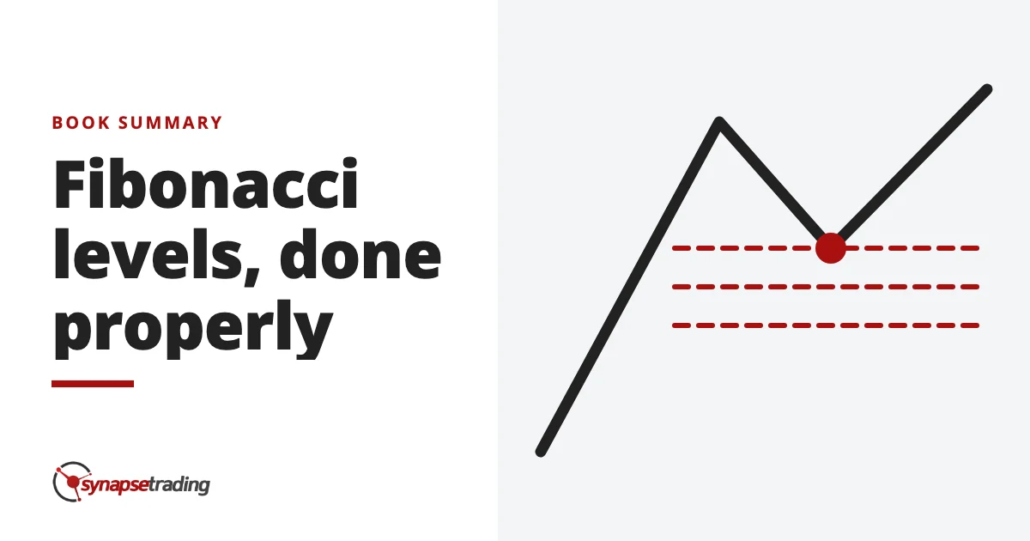
Fibonacci Analysis is a 2008 book by Constance Brown, published by Bloomberg Press, and its main argument is that most traders draw Fibonacci retracements the wrong way. They anchor the tool on the most obvious swing high and swing low, and then wonder why price keeps missing the level. Brown builds her levels from the market’s internal pivots instead, such as gaps, strong bars and the start of a forceful move. She draws several ranges from the same starting point and only pays attention where their levels pile up into what she calls a confluence zone. The stop goes just outside that zone, never inside it.
I have read three of Brown’s books, and my copy of this one has 86 highlighted passages. Nearly all of them sit in the first five chapters, which is where she teaches the grid. The later chapters move into Gann, astronomy and musical harmonics, and the highlights thin out quite a lot from there.
Who is Constance Brown?
Before she wrote a word about Fibonacci, Connie Brown spent 12 years as an institutional trader and then ran a futures hedge fund for 6 years. That is according to her profile on the CMT Association’s website, which also says she founded her firm, Aerodynamic Investments Inc., in 1996 to research Gann theory.
She holds the Master of Financial Technical Analysis from the International Federation of Technical Analysts, the same body that awards the CFTe. Fibonacci Analysis won the gold medal at the 2009 Axiom Business Book Awards.
It shows in the questions she sets out to answer. Where is the market going, where does the stop belong, how much should you put on, and which price warns you before the stop is hit? Three of the four are about risk. For a book with a golden spiral on the cover, that is quite unusual.
Why does the usual Fibonacci retracement miss?
The nautilus shell is the picture on half the Fibonacci books ever printed, and Brown uses it to make the opposite point. The shell follows the ideal golden spiral up to about 21 units, and then it curls tighter than the maths says it should. “This contraction is reality. The math model is theory.”
Markets behave the same way. Future swings “expand or contract in measurable ratios derived from multiple prior price swings,” so a retracement drawn from the extreme high to the extreme low only lands well when the market happens to be moving in even, symmetrical swings. And markets spend more time expanding or contracting than being symmetrical.
She gives you a way to check which state you are in. Draw several nested ranges around the strongest swing, each a little longer than the last, and watch where the 50% line of each one falls. If the 50% lines step higher, the market is expanding. If they step lower, it is contracting. Only when they sit on top of one another is the market symmetrical, and that is the one case where the textbook high-to-low retracement really works.
So when a retracement fails, Brown checks the range before she blames the market.
How does Brown pick the range?
On 27 August 2026, a trader on Reddit’s r/technicalanalysis posted a chart with two different retracements on it. “How do you know which low to high to use?”
Most of the book is an answer to that question. It starts with direction. To find support, start at a price high and drag down to a low, and every level must fall below the current price. To find resistance, start at a low and drag up. Get this backwards, she warns, and “the method will force you to remain a beginner.”
Then comes where a range should end. It is rarely the obvious extreme. “The internal subtleties are of greater significance than the blatant swing highs and lows,” she writes. The points she trusts are gaps, strong bars, the longest single candle body in the swing, and the bar that starts a forceful move. One of her rules is short enough to remember on the first read. “Always align a gap near the 50 percent retracement line.”
Two more corrections fill most of her appendix on common errors, and the first is that a key-reversal spike usually gets cut back, so the range starts at the bar behind it. And a range never ends at a low that a later swing has already retraced, because every level behind that low has been broken already.
Once the range is drawn, leave it alone. “Do not select a range to make the look-back price internals fit the resulting Fibonacci grid,” she writes. Try hard enough and some grid will always explain the past.
If you would rather check levels like these once a day than stare at them all day, my free 15-minute swing trader checklist is the routine I run myself.
What is a confluence zone?
On 8 November 2025, I was looking at USD/SGD in my weekly outlook. It had broken up from a double bottom and was pulling back to test the breakout, right where almost all five of my moving averages had bunched together. “Rarely do you get like so many confluence of different moving averages,” I told viewers, so I suspected it would consolidate there for a while.
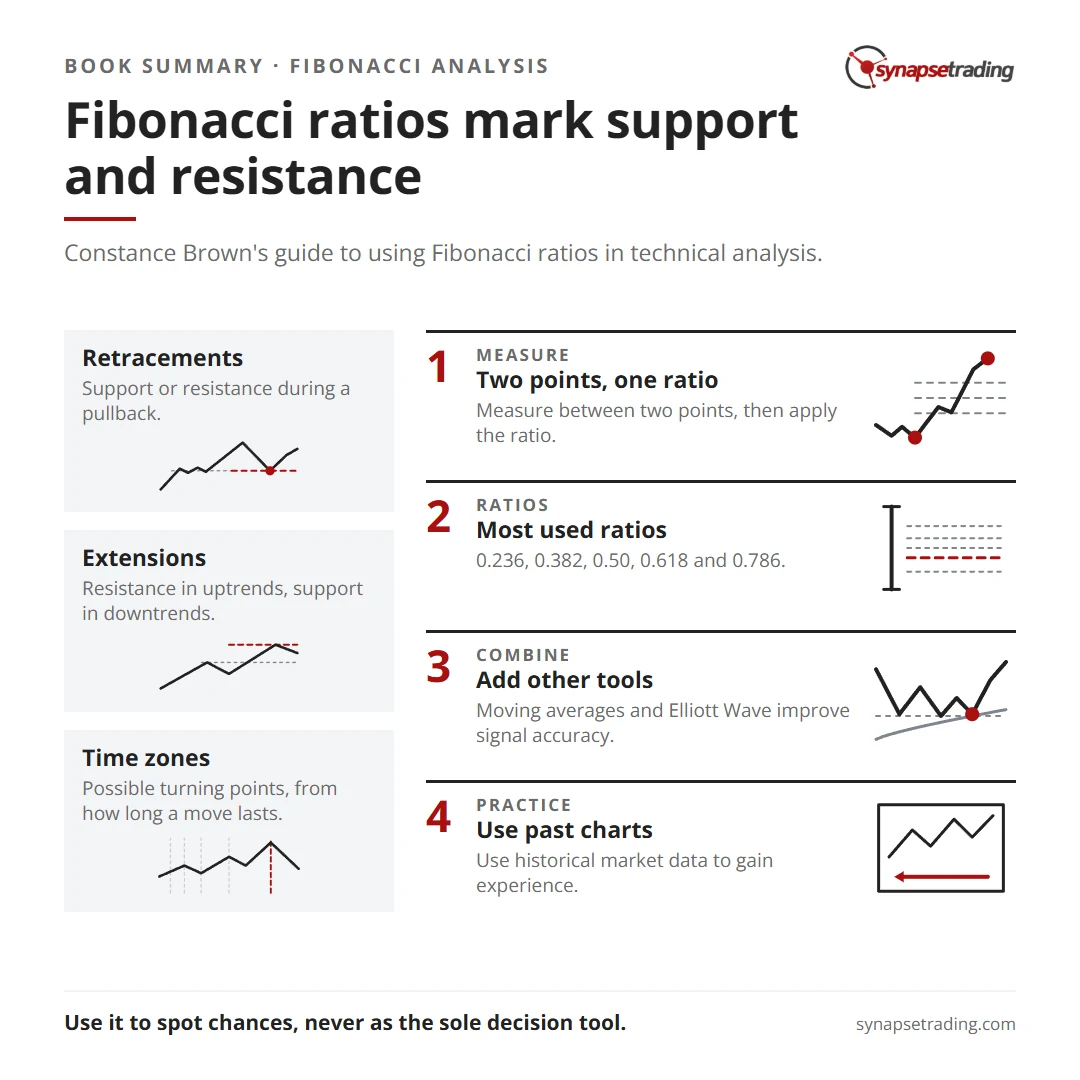
That word, confluence, is the centre of Brown’s book, where a confluence zone forms wherever different Fibonacci ratios, taken from different ranges, land close together. Every range starts from the same pivot, and each must be a different length, because two ranges of almost the same size give you no new information. A single ratio standing alone is minor, and she is happy to grey it out.
She also cuts the menu of ratios down hard.
| Use | Ratios Brown keeps | What she changes |
|---|---|---|
| Retracements, for support and resistance | 38.2%, 50%, 61.8% | Removes 75% and the other extras |
| Projections, for targets | 61.8%, 100%, 138.2%, 150%, 161.8% | Adds 138.2% and 150%, which most defaults leave out |
| Far projections | 261.8% | Avoids it as too far away to be useful |
The empty space matters too. When there is a void with no ratios between two major zones, she expects price to accelerate straight through it, to “fall like a rock” on the way down. So the grid tells you where price might stop, and also where it probably will not.
In my own swing trading, a Fibonacci zone shows up in only one of my four setups, the Bounce. Even there it is one of several things that must line up at the same level, with a prior swing low and a moving average. A Fibonacci line never triggers a trade by itself.
Where does the stop go?
“Stops are not within the zone, but just above the zone,” Brown writes, in an example where the zone is resistance. If the zone is where the market should turn, then the normal noise of that turn happens inside it, and a stop placed there gets hit by exactly the move you were waiting for.
She adds a small rule that sounds fussy until you think about how many traders put their stops on round numbers. “When you enter stops, never use an even number in any market.”
Here is how the grid turns into a trade plan, with made-up round numbers: say a stock pulls back into a support zone between 100 and 101, and you buy at 102 once price turns up.
Stop just below the zone, at 99.70 = risk of 2.30 a share
Brown wants at least 3 times the risk in reward. So the target has to sit at 102 + 3 × 2.30 = 108.90 or higher.
If the next zone overhead sits at 106, the trade offers only about 1.7 times the risk, and on her rules you pass. The method gives you as many reasons to skip a trade as to take one, which is a large part of its value.
If you want a routine that keeps the stop question in front of you every day, the free 15-minute swing trader checklist is the one I use.
Do Fibonacci levels only work because everyone watches them?
In May 2024, a trader on Reddit’s r/Daytrading put it bluntly. Do Fibonacci levels “fit so well because the market and its traders use them?”
It is a fair challenge. The strongest version of it comes from another field entirely, the branch of economics called game theory. In 1960, the economist Thomas Schelling asked his students where they would meet a stranger in New York if neither could contact the other. The most popular answer was noon at Grand Central. The station had no special merit as a meeting place, and people picked it because they expected everyone else to pick it. Schelling called a spot like that a focal point, and a price level that millions of traders have drawn can work the same way, through shared expectation rather than any law of nature.
There is a sharper objection too, and it is worth conceding. In 2009, Al Brooks wrote in Reading Price Charts Bar by Bar that “every pullback is ‘close enough’ to some Fibonacci number, making the Fibonacci numbers essentially meaningless.” The arithmetic backs him up. With the usual five lines at 23.6%, 38.2%, 50%, 61.8% and 78.6%, the widest gap between two neighbours is 14.6 points, so no pullback between 23.6% and 78.6% can land more than about 7.3 points from a line. A tool that always has a line nearby will always look like it worked afterwards.
Brown’s book came out a year before Brooks wrote that, and it already guards against both. She cuts the ratios to three, insists that several ranges agree before a level counts, and uses the grid mainly to decide where risk sits, which is a far more modest job than forecasting. She admits the limit plainly too. You only learn that you picked the right range after the fact, when the internal pivots start to respect your levels, and her charts stop at the end of 2007.
Should you read Fibonacci Analysis?
Imagine handing this book to someone who has never drawn a retracement. By chapter 8 they are watching the S&P 500 get mapped onto the musical scale.
So it is a second book on the subject, for a trader who already draws Fibonacci levels and wants them to be less hit-and-miss. The back half leans on astronomy and harmonics that most readers cannot test, and several techniques assume Market Analyst Software or a physical proportional divider. And picking the right pivot takes a trained eye rather than a rule, which makes the method hard to backtest.
Personally, I would read the first five chapters with a chart open beside you, redraw a few of your own old retracements by her rules, and treat the rest as optional. If you are new to the tool itself, start with my guide on how to use Fibonacci retracement, then come back to Brown.
FAQ
What is Fibonacci Analysis by Constance Brown about?
It argues that markets expand and contract, so a retracement drawn from the obvious high and low usually misses. Brown builds levels from internal pivots and trusts only zones where several ratios from different ranges overlap.
Which Fibonacci ratios does Constance Brown use?
For retracements, 38.2%, 50% and 61.8%. For projections, 61.8%, 100%, 138.2%, 150% and 161.8%. She drops 75% and avoids 261.8% as too far away.
What is a Fibonacci confluence zone?
A price area where levels from two or more ranges, all starting at the same pivot, land close together. Brown treats it as major support or resistance, and a single level on its own as minor.
Where does Brown put the stop loss?
Just outside the confluence zone, never inside it, and never on an even number. She looks for a reward of at least 3 times the risk.
Is Fibonacci Analysis good for beginners?
It works better as a second book. It assumes you already draw retracements, and the back half moves into Gann, astronomy and harmonics.
When your last retracement failed, was it the market, or the range you picked? Let me know in the comments, and tell me whether you draw your levels from the obvious extremes or from inside the move.
For the Gann side, read my summary of Fibonacci and Gann Applications in Financial Markets. For the stop and target side, read where to put your stop loss and take profit. My full reading list is in Best Investing and Trading Books of All Time, and the rest is in my free trading guides.
And if you want a trading routine that fits into 15 minutes a day, grab the free 15-minute swing trader checklist.
About the author. Spencer Li is The 15-Minute Trader and the founder of Synapse Trading. He is a Certified Financial Technician (CFTe) with 15+ years of trading, run from 70+ countries. He holds a B.Acc and B.BM from SMU. Every trade he takes is public, dated, losses left in. He teaches rules-based swing trading in 15 minutes a day, one system for any market.
Education, not financial advice. Synapse Trading is not licensed by MAS to advise on investment products. Trading carries risk of loss, and past performance is not indicative of future results.
Want the daily routine? Enter your email for the free 15-Minute Swing Trader's Checklist.
Free 5-page PDF, then occasional trading emails. Education only, not financial advice. Unsubscribe anytime. Kit stores your email in the US: see our privacy policy.
Want to learn the full method? The Trading Mastery Program teaches the 4 strategies I have traded since 2011. It suits beginners and experienced traders.
Rather follow the trades as they happen? Daily Trading Signals is our Telegram channel: my trade ideas with entry, stop and exit, and every trade is public.
Questions about this post? Ask in the free Telegram channel →
Educational content only, not personalised financial advice. Trading carries risk, including loss of capital. Past performance is not indicative of future results. Synapse Trading is not licensed or regulated by MAS.

