

Technical Analysis vs Fundamental Analysis: Which Should You Use, and How to Combine Them
Want the daily routine? Get the free 15-Minute Swing Trader’s Checklist. Get it free →
By Spencer Li, CFTe · Last updated: 26 October 2026
Technical analysis studies price and volume on a chart to decide when to act, while fundamental analysis studies the business or economy behind the price to decide why something is worth owning. Neither is better in general, because they answer different questions, so the useful choice is which one leads for your time horizon. A swing trader holding for days or weeks leans on technical analysis, a long-term investor leans on fundamental analysis, and most people do best using one to check the other.
In 2018, one of the questions new traders asked me most often was which method to learn. I wrote back that “Personally, I find that the best approach is to combine them to get the best of both worlds.” Eight years later, that has not changed. What has changed is how clearly I can explain why.
What is fundamental analysis really asking?
In my weekly outlook on 18 December 2025, I compared the AI boom with the dot-com bubble. I pointed out that the dot-com bubble burst because “the valuations were way higher than the reality”. The tricky part with AI was whether prices had run too far ahead of the fundamentals, or were roughly in line with them. Nobody could answer that from a chart.
That question is fundamental analysis in one sentence. You estimate what something is genuinely worth, and then you compare that value to the price the market is asking. For a company, the inputs are earnings, revenue, debt, the quality of management and the industry around it. For a currency or a commodity, they are interest rates, growth, supply and demand, which is why reports like the US jobs report can move a whole market in one evening.
When the value is well above the price, the asset may be cheap. When it is well below, the asset may be expensive. The catch is the word “may”, because the market can disagree with your valuation for far longer than you expect, and fundamental analysis on its own gives you no idea when the disagreement will end.
What is technical analysis really asking?
John Murphy, the author of Technical Analysis of the Financial Markets, put the split in one line: “The fundamentalist studies the cause of market movement, while the technician studies the effect.”
So technical analysis reads the effect. It studies price, volume and the patterns they form, on the idea that whatever people know or fear about an asset shows up in what they are willing to pay for it. A chart cannot tell you what a company is worth. It can tell you what the crowd is doing about it right now, whether the trend is up or down, and roughly where the price would have to go to prove your idea wrong.
Its biggest advantage is speed. You can scan dozens of charts in the time it takes to read one annual report, find the handful that are setting up, and leave the rest alone. If you are starting from zero, my guide on what technical analysis is covers the basics.

If you would like to learn how to get started in trading, also check out: “The Beginner’s Guide to Trading & Technical Analysis”
How do the two compare side by side?
The easiest way to see the difference is to put them next to each other.
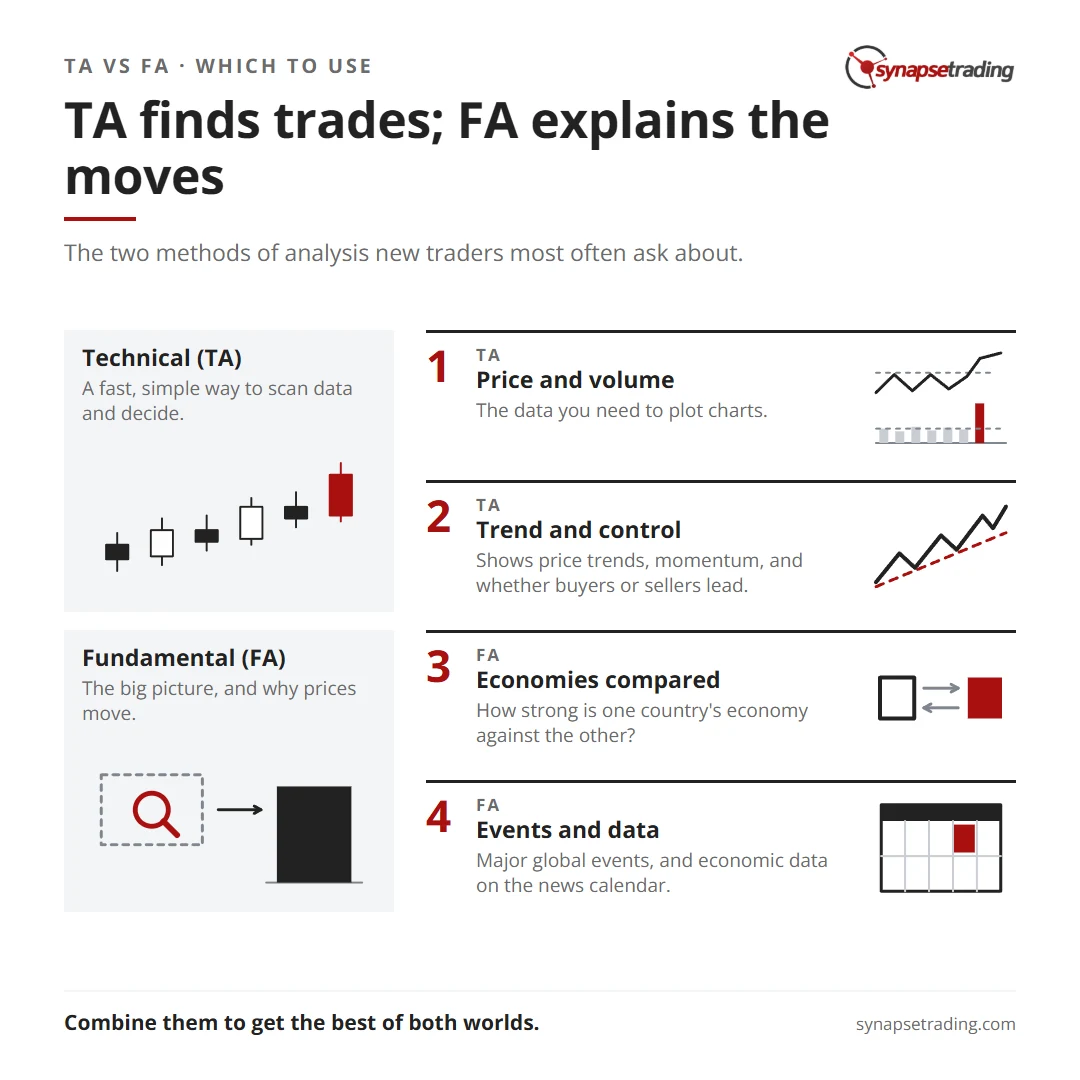
| Technical analysis | Fundamental analysis | |
|---|---|---|
| What it studies | Price, volume, chart patterns | Earnings, value, economic and industry data |
| Main question | When should I act? | Why is this worth owning? |
| Typical horizon | Days to weeks | Months to years |
| Speed | Fast, many charts at once | Slow, deep work on one asset |
| Strength | Timing, and knowing where you are wrong | The big picture and the reason behind a move |
| Blind spot | Says nothing about why | Says little about when |
Read the bottom two rows together and a pattern jumps out. Each method’s strength sits exactly where the other one is blind, which is the whole case for using both.
If you trade around a full-time job and want a routine that keeps both in view, my free 15-minute swing trader checklist is the one I use myself.
Isn’t technical analysis just astrology?
In December 2020, someone on Reddit’s r/stocks started a thread titled “Technical Analysis is like Astrology and Anyone who Believes in it is a Fool”. The title did not leave much room for nuance.
They have a point, and the best evidence for it comes from a technician. In Evidence-Based Technical Analysis, published in 2007, David Aronson tested 6,402 technical rules on the S&P 500 from 1980 to 2005. Once he corrected for the fact that testing that many rules will throw up some lucky winners by chance, not one of them was statistically significant. He also argued that much of the subjective side of charting, the hand-drawn lines and the pattern spotting, cannot be tested at all, because nobody can write it down precisely enough to prove it wrong. I wrote up the whole argument in my summary of Aronson’s book.
So I would never use a chart as a crystal ball. What a chart does well is far more modest, and far more useful. It shows you whether buyers or sellers are in control right now. It also tells you in advance the price at which your idea is wrong, so a bad trade costs you a small, known amount instead of a nasty surprise. Astrology never offers to tell you when it has failed. A stop loss does exactly that.
Why does the crowd’s opinion matter as much as the value?
In 1936, the economist John Maynard Keynes compared investing to a newspaper beauty contest, where readers won a prize for picking the faces that other readers would pick. To win, you could not choose the face you found prettiest. You had to guess what everyone else would choose, and one step further, what everyone else expected everyone else to choose. Keynes called it devoting our intelligence to “anticipating what average opinion expects the average opinion to be”.
That idea comes from economics and psychology rather than from trading, and it explains why the two methods need each other. Fundamental analysis tells you what a thing is worth. But the price you can sell at tomorrow is set by the crowd, and the crowd is busy guessing what everybody else thinks. A chart is simply the scoreboard of that guessing game.
So when your valuation and the chart disagree, neither one is automatically lying. Either the crowd knows something you have missed, or the crowd has not caught on yet, and the honest response is usually to wait until the two line up.
How do I combine them in practice?
On 7 May 2026, in my weekly outlook, I mentioned that I had just taken a position in a copper ETF. The fundamental reason was one I had talked about in earlier videos. Copper has “very strong fundamentals”, with a shortage of supply that I called “a fundamental force driving this commodity”. But that story had been true for a while, and I did not act on it until the chart agreed, after a decline, when price gapped back above all its moving averages. A week later, I said I was simply waiting for it to break to new highs.
That is the whole method in one trade. The fundamentals told me what was worth watching and why, and the chart told me when to act and where I would be wrong. In practice it runs in three steps.
- Let fundamentals build the shortlist. Look for things with a real reason to move, such as a supply shortage, a strong business or a clear shift in interest rates.
- Let the chart decide the timing. Wait until price confirms the story, and decide before you enter where the idea stops working.
- Treat a disagreement as information. When a great story sits on an ugly chart, it is often better to wait than to argue with the market.
There is one more place where fundamentals protect a chart trader, and it is the earnings calendar. The single news rule in my daily routine is not to hold a stock through its earnings report, because a chart cannot see the number coming and the price can gap straight past any stop. That is fundamental analysis at its most practical, and it takes about five seconds a day.
If you want to see how this fits with the four main trade types, my guide on the types of trading strategies shows which ones lean on each method. And if you want the routine I run every day in 15 minutes, grab the free 15-minute swing trader checklist.
So which one should you use?
It depends mostly on how long you plan to hold. If you swing trade for days or weeks, technical analysis does most of the work, because over that horizon timing and risk control matter more than next year’s earnings. If you invest for years, fundamental analysis leads, because over that horizon the business, rather than this week’s candle, decides how it goes.
Even then, the other method still earns its place. An investor who glances at a chart can avoid buying a good business in the middle of a crash, and a trader who checks the earnings date avoids being blindsided by one. You do not have to master both to the same depth. You only have to stop pretending one of them does not exist.
FAQ
Is technical analysis or fundamental analysis better?
Neither is better in general, because they answer different questions. Technical analysis is better for timing and short holding periods, and fundamental analysis is better for judging value over years.
Can you use technical and fundamental analysis together?
Yes. A common approach is to use fundamental analysis to decide what is worth trading and why, and technical analysis to decide when to enter and where the idea is wrong.
Which should a beginner learn first?
If you want to trade actively, technical analysis is usually the faster start, because it gives you a repeatable way to scan charts and make decisions. Fundamental analysis matters more as your holding period gets longer.
Do swing traders need fundamental analysis?
A little. Most swing traders rely on charts for timing, but they still check the earnings calendar and big economic releases so they are not caught on the wrong side of a known event.
Does technical analysis actually work?
The evidence is mixed. Aronson’s 2007 test of 6,402 rules on the S&P 500 found none that survived a correction for luck, so a chart is best used for timing and risk control rather than prediction.
What is the main difference between technical and fundamental analysis?
Technical analysis studies price and volume to answer when. Fundamental analysis studies the business or economy behind the price to answer why.
Which one do you lean on more, and has a great story on an ugly chart ever cost you? Let me know in the comments.
If you want to go further, my free trading guides cover both sides in more depth.
And if you want a daily routine that keeps the chart and the earnings calendar in view without hours at the screen, grab the free 15-minute swing trader checklist.
About the author. Spencer Li is The 15-Minute Trader and the founder of Synapse Trading. He is a Certified Financial Technician (CFTe) with 15+ years of trading, run from 70+ countries. He holds a B.Acc and B.BM from SMU. Every trade he takes is public, dated, losses left in. He teaches rules-based swing trading in 15 minutes a day, one system for any market.
Education, not financial advice. Synapse Trading is not licensed by MAS to advise on investment products. Trading carries risk of loss, and past performance is not indicative of future results.
Want the daily routine? Enter your email for the free 15-Minute Swing Trader's Checklist.
Free 5-page PDF, then occasional trading emails. Education only, not financial advice. Unsubscribe anytime. Kit stores your email in the US: see our privacy policy.
Want to learn the full method? The Trading Mastery Program teaches the 4 strategies I have traded since 2011. It suits beginners and experienced traders.
Rather follow the trades as they happen? Daily Trading Signals is our Telegram channel: my trade ideas with entry, stop and exit, and every trade is public.
Questions about this post? Ask in the free Telegram channel →
Educational content only, not personalised financial advice. Trading carries risk, including loss of capital. Past performance is not indicative of future results. Synapse Trading is not licensed or regulated by MAS.

