

How to Read Candlestick Bars: What the Body, Shadows and Colour Tell You
Want the daily routine? Get the free 15-Minute Swing Trader’s Checklist. Get it free →
By Spencer Li, CFTe · Last updated: 26 October 2026
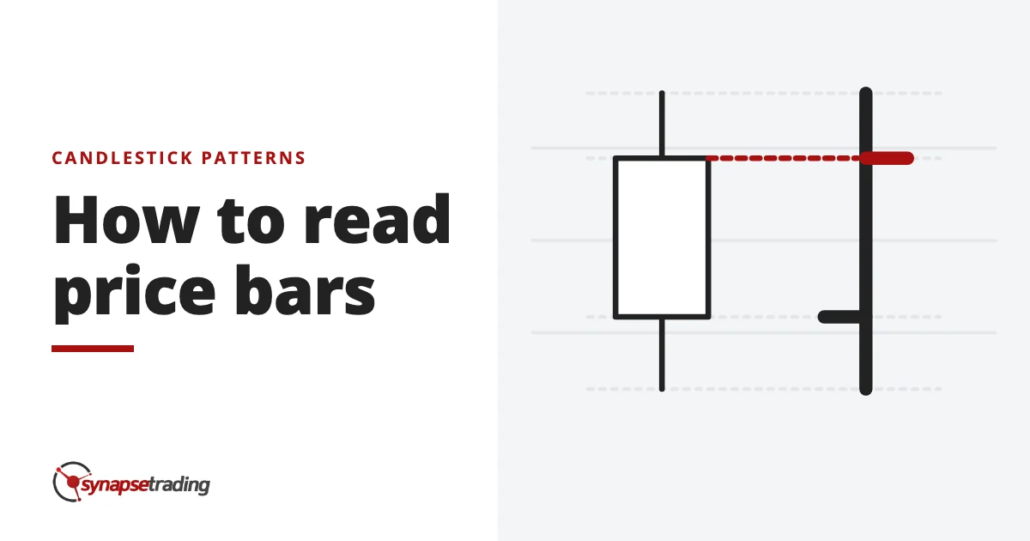
A candlestick bar shows four prices for one period of time, the open, the high, the low and the close. The thick part, called the real body, runs from the open to the close. A white or green body means price closed above where it opened, and a black or red body means it closed below. The thin lines above and below the body, called shadows or wicks, mark the highest and lowest prices traded in that period. So the body tells you who won the period and by how much, and the shadows tell you how much of a fight there was along the way. Once you can read those two parts, you can read a candlestick chart in any market and on any timeframe.
What is a candlestick bar?
Every candle on your chart is a summary of hundreds or thousands of trades, squeezed down to four numbers.
Once you know how to read a price chart, the next step is to zoom in on the bars it is built from. These charts are called candlestick charts, so each bar is a candlestick bar, and most people just call them price bars. I will use the two names the same way here.
- Open is the first price traded in the period.
- High is the highest price traded in the period.
- Low is the lowest price traded in the period.
- Close is the last price traded in the period.
The period is your chart setting. On a daily chart, each candle is one day, and on a weekly chart it is one week. Steve Nison, whose 1991 book Japanese Candlestick Charting Techniques brought candles to most Western traders, points out that they can be drawn on any timeframe from intraday to monthly. The four prices mean the same thing on all of them.
If you sat through a statistics class, the shape may look familiar. A box plot squeezes a whole spread of numbers into one box and two whiskers, and a candle does something very similar with a trading session. The difference is in what the box holds. A box plot’s box holds the middle of the data, while a candle’s box holds the open and the close, the two prices the Japanese cared about most.
What do the body and the shadows tell you?
The Japanese have names for the two colours. Nison notes that a white candle is called yo-sen and a black one in-sen, which line up with the Chinese yang and yin. It is a nice reminder that a candle shows a balance between two forces, and the body shows which one won.
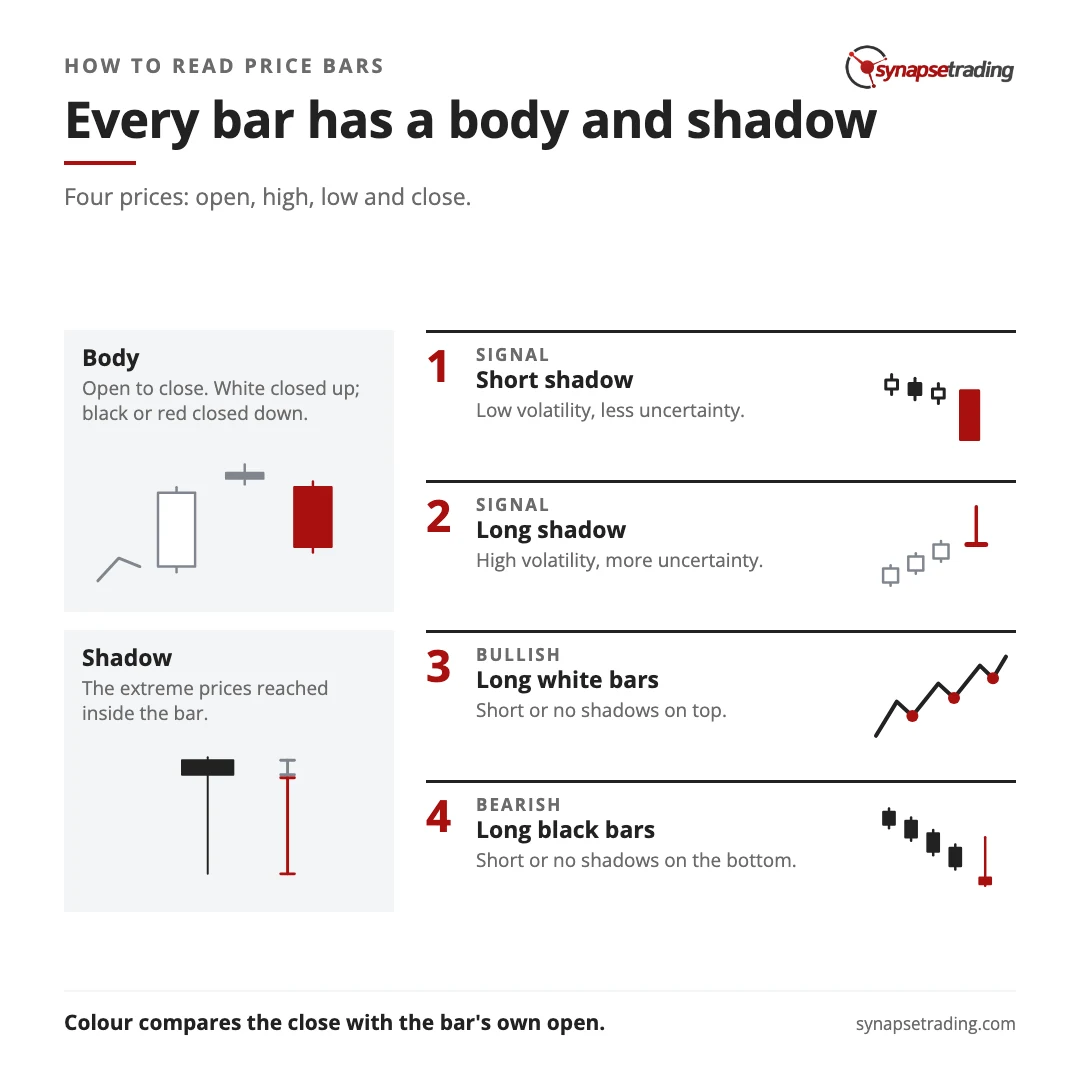
The body is the fat part of the candle, and its length is the distance between the open and the close.
- A white body, often drawn green, means the close was higher than the open. Price moved up over the period, which is bullish.
- A black body, often drawn red, means the close was lower than the open. Price moved down, which is bearish.
Do note that the colour compares the close with the candle’s own open, and never with yesterday’s close. That catches a lot of beginners. On 19 March 2026, QQQ, the Nasdaq-100 fund, opened lower, climbed through the day and printed a white candle, even though it still closed below the previous day’s close. So a white candle can sit on a losing day, and the colour only tells you what happened after the open.
The shadow is the thin part of the candle, and it marks the extreme prices reached inside the bar. A short shadow means price never strayed far from the body, which signals low volatility and less uncertainty. A long shadow means price stretched a long way and then got pulled back, which signals high volatility and more uncertainty.

| Part of the candle | Built from | What it tells you |
|---|---|---|
| Body length | The distance from the open to the close | How decisively price moved |
| Body colour | The close compared with the open | Which side won the period |
| Upper shadow | The high compared with the top of the body | How far buyers pushed before they were beaten back |
| Lower shadow | The low compared with the bottom of the body | How far sellers pushed before they were beaten back |
Nison writes that the Japanese usually treat shadows as “extraneous price fluctuations”, because they put so much weight on the open and the close. I read them a little more closely than that, but I take his point that the body comes first.
Habits like reading the body first stick better inside a fixed daily routine, and my free 15-minute swing trader checklist is the one I run myself.
Which candles are worth knowing by name?
How long does a body have to be before it counts as long?
Gregory Morris asks exactly this in Candlestick Charting Explained, and his answer is “Long compared to what?” A long candle is only long next to the five to ten candles before it. A move that looks huge on a sleepy utility stock can be quite ordinary for a small biotech, so you always judge a candle against its neighbours.
With that in mind, a handful of single candles have names worth knowing.
| Candle | What it looks like | What it suggests |
|---|---|---|
| Doji | The open and the close are equal or almost equal, so the body is a thin line, and the shadows can be any length | Neither side won the period |
| Long-legged doji | A doji with long upper and lower shadows | A session that lost its sense of direction |
| Gravestone doji | A doji with the open and close at the low, and a long upper shadow | Buyers pushed up and could not hold any of it |
| Spinning top | A small body of either colour | Indecision, a little milder than a doji |
| High-wave line | A small body with very long shadows on both sides | A big fight that ended roughly where it started |
| Marubozu | A long body with no shadows | One side had the period completely to itself |
A doji is defined by its body alone. Its shadows can be short or long. Morris describes it as “complete and total uncertainty” about direction, and he adds that a doji in the middle of lots of other doji means very little. The marubozu sits at the other extreme. The candlestick course I took in Singapore back in 2009 described it as the strongest show of buying or selling conviction, since price never traded beyond the open or the close at all.
How do you read a run of candles?
A single candle is one sentence. Most of what I read on a chart comes from the paragraph, which is the run of candles over the last few weeks. These are the simple rules I first wrote down in this post back in 2021.
| Bullish factors | Bearish factors | |
|---|---|---|
| Bodies | A lot of long white bars | A lot of long black bars |
| Upper shadows | Short or no shadows on the top of bars | Long or no shadows on the top of bars |
| Lower shadows | Long or no shadows on the bottom of bars | Short or no shadows on the bottom of bars |
The logic behind them is the same on both sides. When buyers are in control, closes keep landing near the highs, so the bodies are long and white and the upper shadows stay short. A long lower shadow is fine, even helpful, because it shows sellers tried to push price down and failed.
In my weekly outlook on 4 December 2025, I pointed at the S&P 500 and QQQ near their all-time highs and counted “almost eight days in a row” of white bars, which I called “surely a sign of bullishness”. It was a plain tally of which side had closed each day ahead.
By 12 March 2026, QQQ looked different. It was moving up and down inside a box, and every time it tried to push higher, it got pushed back down. One day “it went up, it went down” and closed in the middle, and there were “a lot of like long shadows” above the bodies, showing buyers trying and failing to close higher. I said that was “not a very bullish sign”, which is why I was not going in aggressively.
That read had limits. QQQ did fall for most of the next three weeks, but those long shadows could not have told me how far it would go or when the fall would stop. Nison makes the same point about candles in general, which is that they give no price targets. They tell you how the fight is going, and the rest of the chart has to tell you where it might end.
If you would rather look at your charts once a day than watch every bar form, the free 15-minute swing trader checklist is the routine I use.
Why not just use a line chart?
In July 2025, a new trader on Reddit’s r/Daytrading said they had been advised it is “better to focus on reading the graphs/trends using the line chart”. They wanted to know whether candles and wicks were really necessary.
That advice is fine for a week. A line chart joins up the closing prices and nothing else, which makes the trend very easy to see. And the close is the price that matters most. Morris calls it the price that many traders use to make decisions about their positions and about what to do at the next open.
But a line chart throws away three of the four prices. It cannot show you a session that opened high and collapsed, or one that dropped hard and was bought all the way back by the close. Those are exactly the sessions that tell you something has changed. So I would start with a line chart if candles feel overwhelming, and switch to candles once the trend stops being the hard part.
There is a second, quieter limit worth knowing. On very short timeframes, long wicks can come from thin trading or a single odd print. A long shadow on a 5-minute chart usually carries far less meaning than one on a daily or weekly chart. That is one reason I prefer daily candles and leave the minute-by-minute ones alone.
For a one-page view of the patterns these candles build, see my candlestick patterns cheat sheet.

If you would like to learn how to get started in trading, also check out: “The Beginner’s Guide to Trading & Technical Analysis”
FAQ
What are the four prices in a candlestick bar?
The open, the high, the low and the close, often shortened to OHLC. The open is the first price of the period, the close is the last, and the high and low are the extremes in between.
What does a green or white candle mean?
It means the close was higher than the open, so price rose during that period. A red or black candle means the close was lower than the open. The colour compares the close with the candle’s own open, never with the previous close.
What is the difference between the body and the wick?
The body is the thick part between the open and the close, and it shows direction and how far price moved. The wick, also called the shadow, is the thin line out to the high and the low, and it shows how far price stretched within the bar.
What is a doji candle?
A doji is a candle whose open and close are the same or almost the same, so the body is a thin line. Its shadows can be any length. It shows a period where neither buyers nor sellers won.
What does a long shadow on a candlestick mean?
It means price stretched a long way in one direction and was pulled back before the close. It signals high volatility and more uncertainty, and on a daily chart it often shows one side pushing hard and getting turned away.
Do candlestick bars work on every timeframe?
Yes. The open, high, low and close mean the same thing whether each candle is one minute or one month. Shadows on very short timeframes tend to carry more noise, so daily and weekly candles are easier to read.
When you look at a chart, do you read the bodies first or the shadows first? And has a candle’s colour ever fooled you on a day the market closed lower? Let me know in the comments.
Once you can read a single bar, the next step is the patterns they form, and what are candlestick patterns walks through how to read them. For the wider picture, start with my free trading guides.
And if you want to read your charts once a day instead of all day, grab the free 15-minute swing trader checklist.
About the author. Spencer Li is The 15-Minute Trader and the founder of Synapse Trading. He is a Certified Financial Technician (CFTe) with 15+ years of trading, run from 70+ countries. He holds a B.Acc and B.BM from SMU. Every trade he takes is public, dated, losses left in. He teaches rules-based swing trading in 15 minutes a day, one system for any market.
Education, not financial advice. Synapse Trading is not licensed by MAS to advise on investment products. Trading carries risk of loss, and past performance is not indicative of future results.
Want the daily routine? Enter your email for the free 15-Minute Swing Trader's Checklist.
Free 5-page PDF, then occasional trading emails. Education only, not financial advice. Unsubscribe anytime. Kit stores your email in the US: see our privacy policy.
Want to learn the full method? The Trading Mastery Program teaches the 4 strategies I have traded since 2011. It suits beginners and experienced traders.
Rather follow the trades as they happen? Daily Trading Signals is our Telegram channel: my trade ideas with entry, stop and exit, and every trade is public.
Questions about this post? Ask in the free Telegram channel →
Educational content only, not personalised financial advice. Trading carries risk, including loss of capital. Past performance is not indicative of future results. Synapse Trading is not licensed or regulated by MAS.

