

How to Combine Candlestick Patterns: Blend Them Into One Candle and See What They Really Say
Want the daily routine? Get the free 15-Minute Swing Trader’s Checklist. Get it free →
By Spencer Li, CFTe · Last updated: 26 October 2026
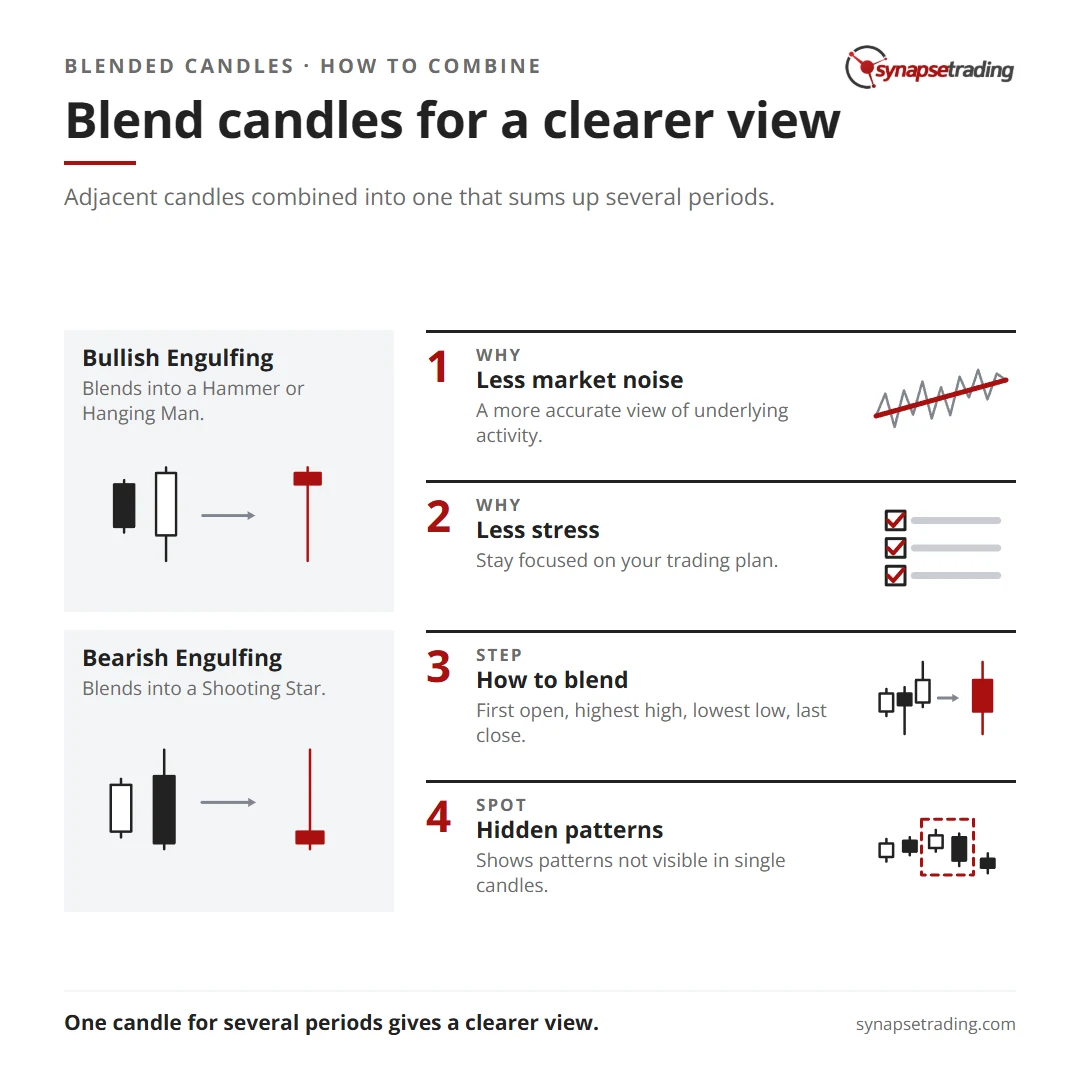
To combine candlestick patterns, you blend the candles into one. Take the open of the first candle, the highest high and the lowest low across all of them, and the close of the last candle, then draw a single candle from those four prices. That blended candle tells you what the whole group said once the arguing was over. A bullish engulfing pattern usually blends into a hammer, and a bearish engulfing pattern into a shooting star. And if that sounds like an obscure trick, it is the same arithmetic your charting platform runs every time you switch from the daily chart to the weekly one.
What does it mean to blend candlesticks?
Every weekly candle on a stock chart is five daily candles blended together, and every hourly candle is twelve five-minute candles, which is an odd fact most people never stop to think about. On a crypto chart, where the market never closes, a weekly candle is seven daily candles. So you have been reading blended candles for years, and the software chose the groups.
The rule takes four prices, whether you blend two candles or twenty.
| Part of the blended candle | Where it comes from |
|---|---|
| Open | The open of the first candle |
| High | The highest high of the group |
| Low | The lowest low of the group |
| Close | The close of the last candle |
I first met this idea in a candlestick course I took in Singapore back in 2009. After each two-candle pattern, the slides asked the same question: “how will the candle look if blended together?” At the time it felt like homework. Today I think it is one of the most useful habits in candlestick reading, because it turns a pattern you memorised into a candle you can reason about.
Why can a week be red when four of its days were green?
In May 2021, a trader on Reddit’s r/Daytrading posted a chart with a confused caption. “My brain is telling me this red candle stick should be green.” Their red candle sat higher than the green one before it, which feels like it should count as a gain.
The answer is that a candle’s colour only compares its close with its own open. A stock can open well above yesterday’s close, drift lower all session, and finish red while still closing higher than yesterday.
Blending does the same thing on a bigger scale. Say a stock opens on Monday at 100 and closes at 94. Then it rises by 1 a day for the rest of the week, finishing Friday at 98. That is four green days out of five, but the weekly candle opens at Monday’s 100 and closes at Friday’s 98, so the week is red.
Which candle is telling the truth? Both of them, which is a little annoying. The daily chart says buyers have been nibbling for four sessions, and the weekly chart says they have not yet won back what sellers took on Monday. Everything that happened in between survives only as the high and the low.
How does a bullish engulfing pattern become a hammer?
A bullish engulfing pattern is a black candle followed by a bigger white candle whose body swallows the first body whole. It was the 2009 course’s favourite example, because the two candles blend into a white hammer, a small body near the top of the range with a long lower shadow.
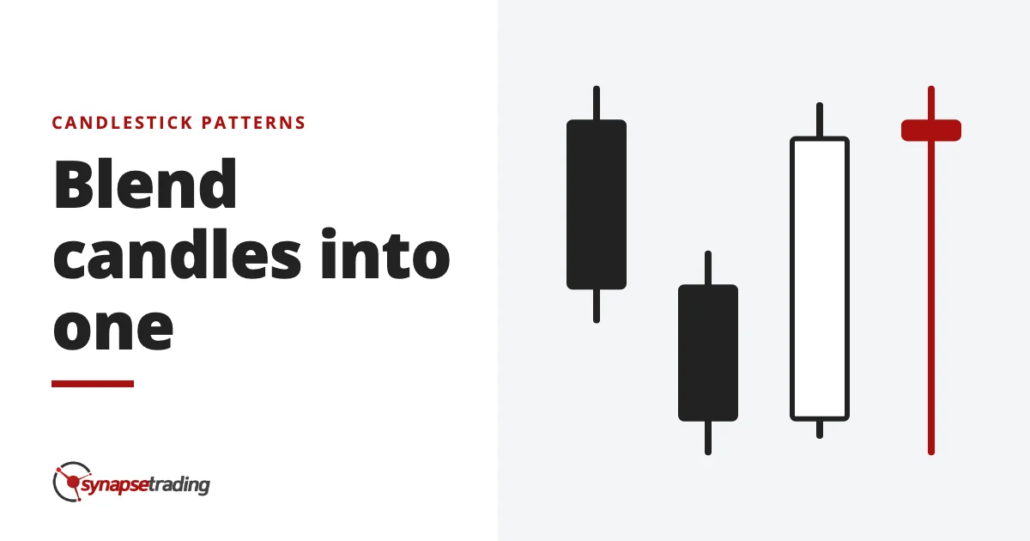
In the chart below, the two periods on the left blend into the one candle on the right. The open comes from Period 1, the close from Period 2, and the high and low from wherever they were made.

So why does it work? The first candle shows sellers in control. The second opens lower, which is the sellers’ last push, and then buyers take price all the way above the first candle’s open. Blend them, and the sellers’ push becomes the long lower shadow, while the buyers’ recovery becomes the small body on top.
The arithmetic also shows something the pattern’s name hides. Take a black candle that opens at 100 and closes at 96, with a low of 95, and compare two white candles that engulf it, neither of which trades below 95.
| Engulfing A | Engulfing B | |
|---|---|---|
| Second candle opens | 95.50 | 95.50 |
| Second candle closes | 101.00 | 104.00 |
| Blended body, from the first open at 100 | 1.00 | 4.00 |
| Blended lower shadow, down to 95 | 5.00, or 5 times the body | 5.00, or 1.25 times the body |
| What the blend looks like | A hammer | A long white candle |
Both are textbook bullish engulfing patterns. Only Engulfing A blends into a hammer, because a hammer needs a lower shadow at least twice the height of its body. Engulfing B closed so far above the first open that the blend becomes a strong white candle, which is a different kind of bullish. In A, buyers only just won the argument, while in B they won it with plenty to spare.
Memorising the name hides that difference, and blending shows it in seconds. If you want a routine that keeps this kind of check to a few minutes a day, my free 15-minute swing trader checklist is the one I run myself.
Why does a bearish engulfing pattern become a shooting star?
Flip everything over. A bearish engulfing pattern is a white candle followed by a bigger black candle that swallows it, usually after a rise. Blend the two, and you get a small body near the bottom of the range with a long upper shadow, which is a shooting star.

Buyers pushed price up hard, sellers took it all back, and the blended close landed below the blended open. On the raw chart, that tug of war was spread across two days of hope and then regret.
The same arithmetic explains a rule that otherwise sounds arbitrary. Steve Nison brought candlestick charts to the West with Japanese Candlestick Charting Techniques. He notes that some Japanese technicians want a dark cloud cover’s black candle to close more than 50% of the way down into the white candle’s body.
Say the white candle runs from 100 to 106, and the black candle opens at 107 after reaching 107.50. If it closes at 102, two thirds of the way down, the blend has a body of 2 and an upper shadow of 5.50, so it looks like a shooting star. If it only closes at 104, a third of the way down, the blend has a body of 4 and an upper shadow of 3.50, which is just a white candle with a wick on top.
Nison does not explain the 50% rule this way, so treat it as my own reading. But I find it quite satisfying that a shallow dark cloud cover simply does not blend into a bearish candle.
What happens when you blend three or more candles?
Blend three candles, and you get one candle that sums up three periods of trading.

Nison rates an engulfing pattern as stronger “if the second day of the engulfing pattern engulfs more than one real body.” Blending shows why. A black candle that swallows two or three white candles blends them into one candle whose upper shadow covers the whole rise it wiped out, so more buyers are left holding at higher prices.
Blending also explains why some patterns are weaker. A harami is the reverse of an engulfing pattern, a long candle followed by a small one whose body sits inside the first. Blend a black candle from 100 down to 94 with a small white one that closes at 97, and you get a black candle with a body of 3 and a lower shadow of about the same height. That is a pause rather than a turn. Nison describes the harami as a brake, after which the market “will often come to a lull”, and the blend draws exactly that lull.
There is a lesson here from engineering. A JPEG photo is smaller than the raw file because it throws away detail your eye is unlikely to miss, which engineers call lossy compression. A blended candle is lossy compression of price, keeping four numbers and throwing away the path between them. So the real skill in blending is choosing what you are happy to lose, and that depends on the question you are asking.
Why blend candles at all?
So what do you actually gain by squashing candles together? There are four reasons.
- A clearer signal. Two candles that each say something half-formed can blend into one that says it plainly, like the hammer inside an engulfing pattern.
- Less noise. Short-term candles are full of small moves that mean nothing, and the blend smooths them out.
- Hidden patterns. A bearish engulfing that falls just short of swallowing one candle may swallow the blend of the two before it.
- Less stress. Watching every small candle tempts you into exits you later regret, and the longer period makes the plan much easier to keep.
That last one is why I zoom out so often. On 5 November 2025, I told viewers of my weekly outlook that China stocks were having “a bit of a pullback” and were “off from the highs”, and that China was “a bit more volatile” than the US. On a daily chart, a pullback like that can look alarming. But “if you zoom out more”, I said, the market was “still in a very strong long term uptrend”, and the pullback was one of the short-term corrections you always meet along the way.
The catch is the boundary. Blend the wrong group of candles and you can create a pattern that is really an artefact of where you started counting. If you keep trying different groupings until one gives you the signal you wanted, you have stopped reading the chart and started negotiating with it.
When does blending hide more than it shows?
In August 2026, a trader on Reddit’s r/Daytrading reviewed a day trade that began with a strong 15-minute candle. They dropped to the 5-minute chart to see what had happened inside it, and summed up the lesson neatly: “The 15-minute candle shows the result”, while the smaller chart “shows the process”.
That is a fair objection to this whole post, and they are right about it. A blended candle cannot tell you whether price climbed steadily or crashed and recovered, and for someone timing an entry inside the day, that matters a lot.
Now, for a swing trader who checks the market once a day, the result is usually what you need. Personally, I would rather read the daily or weekly candle than the small candles inside it, because I cannot act on the process anyway, and watching it mostly produces fear and second-guessing.
I should also be honest about my own records. As at 12 October 2026, 216 of my 478 closed trades carried a setup tag, such as swing, break, bounce or turn. None of those tags records which candle I read, let alone whether I blended it, so I cannot give you a hit rate for blended candles.
To stack these candles with moving averages and oscillators, see how to combine candlestick patterns with other technical indicators. And if you would rather read charts in one short session a day, the free 15-minute swing trader checklist is the routine I use.
FAQ
What does it mean to blend candlesticks?
It means merging adjacent candles into one, using the first open, the highest high, the lowest low and the last close.
Does a bullish engulfing pattern always blend into a hammer?
No. It blends into a hammer when the second candle closes only a little above the first candle’s open. When it closes far above, the blend is a long white candle.
What does a bearish engulfing pattern blend into?
Usually a shooting star, a small body near the low with a long upper shadow.
Is blending candles the same as changing the timeframe?
In effect, yes. A weekly stock candle is five daily candles blended together. Blending by hand just lets you choose the group.
Can a blended candle be a different colour from most of the candles inside it?
Yes. Its colour compares the last close with the first open, so a week with four green days can still be red.
Which pattern do you trade most often, and what does it look like once you blend it? Have you ever found a hammer hiding inside an engulfing pattern? Let me know in the comments.
For every pattern in one place, read The Definitive Guide to Candlestick Patterns. The candles you met most here have their own guides, the hammer, the shooting star and the bullish engulfing pattern. For the wider picture, start with my free trading guides.
And if you want a routine that reads the bigger candle without hours at the screen, grab the free 15-minute swing trader checklist.
About the author. Spencer Li is The 15-Minute Trader and the founder of Synapse Trading. He is a Certified Financial Technician (CFTe) with 15+ years of trading, run from 70+ countries. He holds a B.Acc and B.BM from SMU. Every trade he takes is public, dated, losses left in. He teaches rules-based swing trading in 15 minutes a day, one system for any market.
Education, not financial advice. Synapse Trading is not licensed by MAS to advise on investment products. Trading carries risk of loss, and past performance is not indicative of future results.
Want the daily routine? Enter your email for the free 15-Minute Swing Trader's Checklist.
Free 5-page PDF, then occasional trading emails. Education only, not financial advice. Unsubscribe anytime. Kit stores your email in the US: see our privacy policy.
Want to learn the full method? The Trading Mastery Program teaches the 4 strategies I have traded since 2011. It suits beginners and experienced traders.
Rather follow the trades as they happen? Daily Trading Signals is our Telegram channel: my trade ideas with entry, stop and exit, and every trade is public.
Questions about this post? Ask in the free Telegram channel →
Educational content only, not personalised financial advice. Trading carries risk, including loss of capital. Past performance is not indicative of future results. Synapse Trading is not licensed or regulated by MAS.

