Hammer Candlestick Pattern Trading Strategy Guide
Join our Telegram channel for more market analysis & trading tips: t.me/synapsetrading
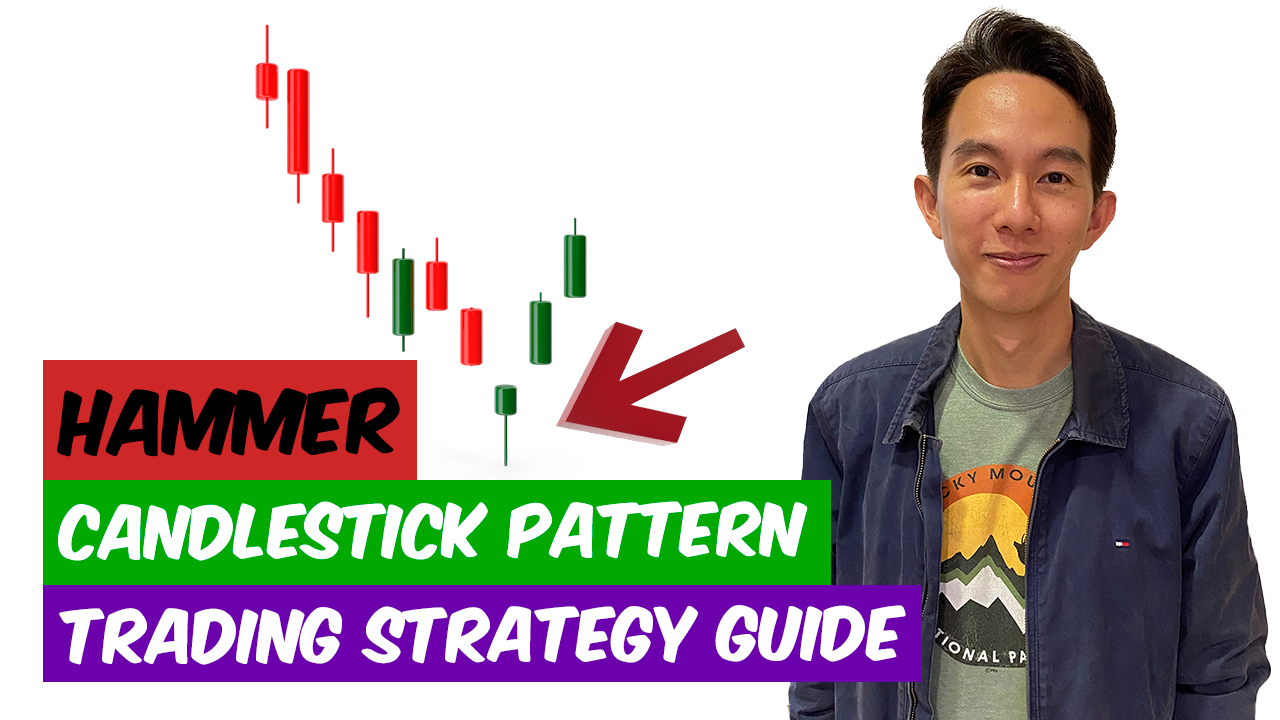
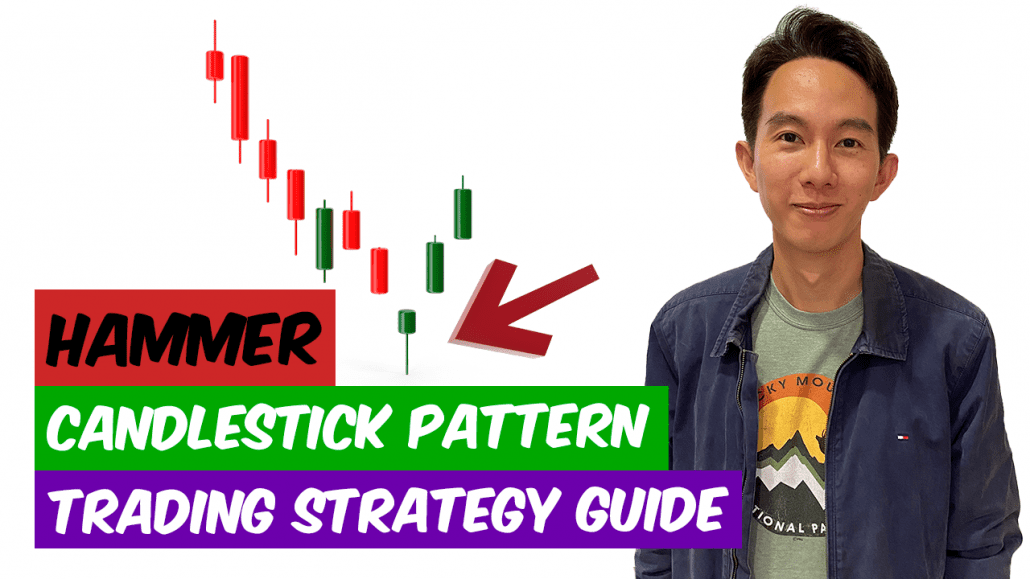
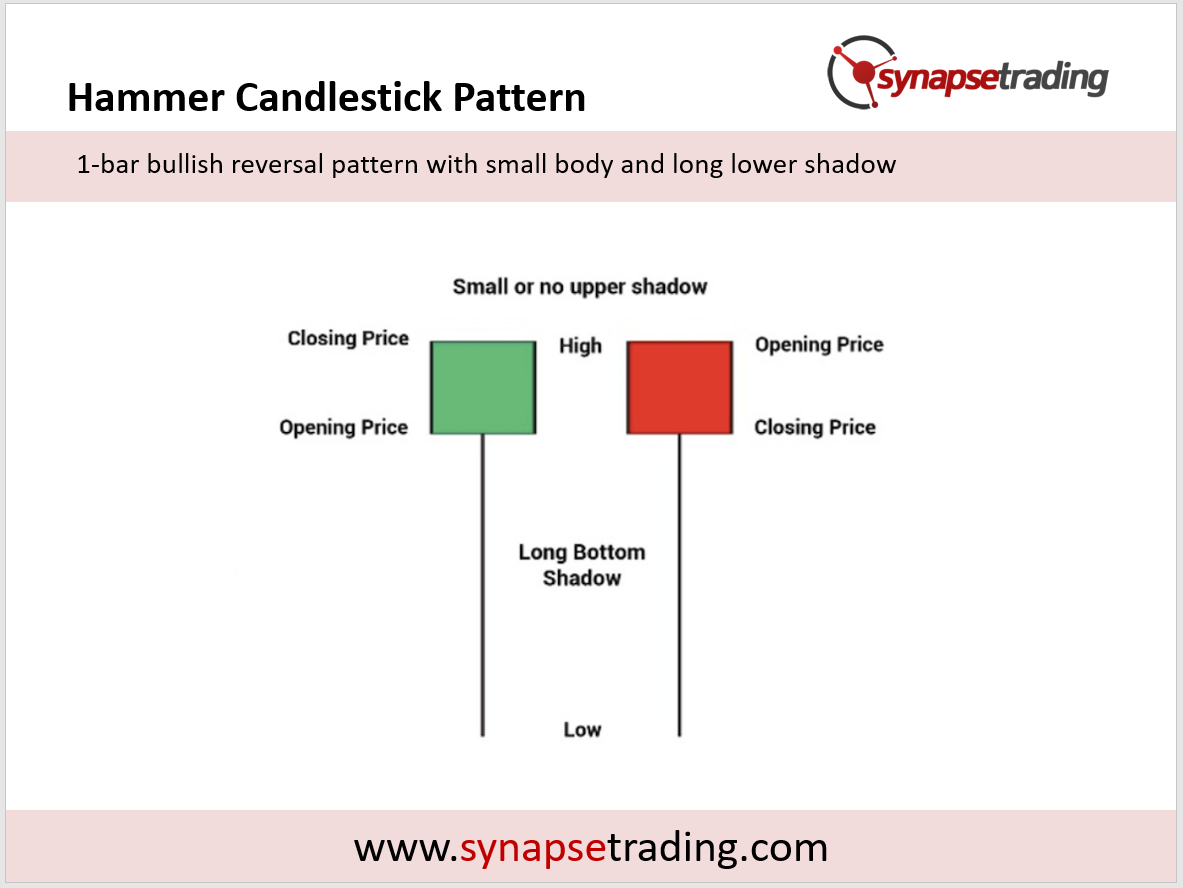
The hammer candlestick pattern is a bullish reversal pattern that consists of a single candlestick with a small body and a long lower shadow.
It is called a “hammer” because it looks like a hammer with the handle being the small body and the head being the long lower shadow.
The pattern is typically seen as a sign of bullish sentiment and indicates that the trend may be about to reverse from a downtrend to an uptrend.
In order to understand the psychology behind the hammer pattern, it’s important to understand the context in which it typically occurs.
The pattern usually forms after a significant price decline and indicates that the bulls (buyers) are starting to regain control of the market.
As the price falls, the bears (sellers) become more and more confident that the downtrend will continue. However, at some point, the bulls start to step in and start buying, pushing the price back up towards the opening price.
This causes the long lower shadow to form, as the price is pushed back up towards the opening price but ultimately closes lower than where it opened.
The long lower shadow of the hammer pattern indicates that the bulls were able to push the price back up towards the opening price, and this can be seen as a sign of strength.
It suggests that the bears may be losing control and that the trend may be about to reverse.
The most common way to use the hammer pattern in trading is to wait for the pattern to form and then enter a long position (buy) when the price breaks above the high of the hammer candlestick.
This is known as a “breakout” strategy and involves placing a stop loss order just below the low of the hammer candlestick.
The idea is to let the trade run until the price reaches a level where it is no longer considered favorable, at which point the stop loss order will be triggered and the trade will be closed.
In terms of where to place the stop loss and take profit orders, it’s important to consider the overall trend and the specific market conditions.
In a strong uptrend, it may be appropriate to place the stop loss order closer to the entry point, as the likelihood of a trend reversal is relatively low.
On the other hand, in a weaker or more uncertain market, it may be appropriate to place the stop loss order farther away from the entry point to allow for more room for the trade to develop.
As for the take profit order, it’s important to consider the potential reward relative to the risk.
In general, it’s a good idea to aim for a reward that is at least twice the size of the risk, as this allows for a higher probability of success.
It’s important to note that the hammer candlestick pattern is just one of many tools that traders can use to make informed decisions about the market.
While it can be a useful indicator of potential trend reversals, it should not be used in isolation and should be considered in conjunction with other technical and fundamental analysis tools.
One way to combine the hammer pattern with other technical analysis techniques is to use it in conjunction with trendline analysis.
For example, if the hammer pattern forms after a significant price decline and the price subsequently breaks above a downward-sloping trendline, it may be a strong indication of a trend reversal.
Similarly, if the hammer pattern forms after a significant price decline and the price subsequently breaks above a key resistance level, it may also be a strong indication of a trend reversal.
Another way to combine the hammer pattern with other technical analysis techniques is to use it in conjunction with oscillators such as the relative strength index (RSI) or the moving average convergence divergence (MACD).
For example, if the hammer pattern forms after a significant price decline and the RSI or MACD is showing an oversold condition, it may be a strong indication of a trend reversal.
It’s also important to consider the overall market environment when using the hammer pattern.
For example, if the pattern forms during a period of high volatility, it may be a less reliable indicator of a trend reversal compared to if it forms during a period of low volatility.
One of the limitations of the hammer pattern is that it can be prone to false signals.
For example, if the pattern forms after a relatively small price decline, it may not be a strong enough indication of bullish sentiment to warrant a trade.
In addition, if the pattern forms in the midst of a strong downtrend, it may not be a reliable indicator of a trend reversal.
Another limitation of the hammer pattern is that it does not provide any information about the duration or strength of the potential trend reversal.
While it may indicate that the trend is about to reverse, it does not provide any insight into how long the reversal may last or how strong it may be.
In summary, the hammer candlestick pattern is a useful tool for traders looking to identify potential trend reversals.
It should be used in conjunction with other technical and fundamental analysis tools and with a clear understanding of the limitations of the pattern.
By carefully considering the overall trend, market conditions, and the potential reward relative to the risk, traders can use the hammer pattern to make informed decisions about their trades.

If you would like to learn more about all the different candlestick patterns, also check out: “The Definitive Guide to Candlestick Patterns”
 Our flagship mentoring program is suitable for both beginners and advanced traders, covering the 4 strategies which I used over the past 15 years to build up my 7-figure personal trading portfolio.
 If you're looking for the best trading opportunities every day across various markets, and don't want to spend hours doing the research yourself, check out our private Telegram channel!


Leave a Reply
Want to join the discussion?Feel free to contribute!