

Frying Pan Bottom Pattern: How to Spot the Rounded Base and the Gap That Completes It
Want the daily routine? Get the free 15-Minute Swing Trader’s Checklist. Get it free →
By Spencer Li, CFTe · Last updated: 26 October 2026
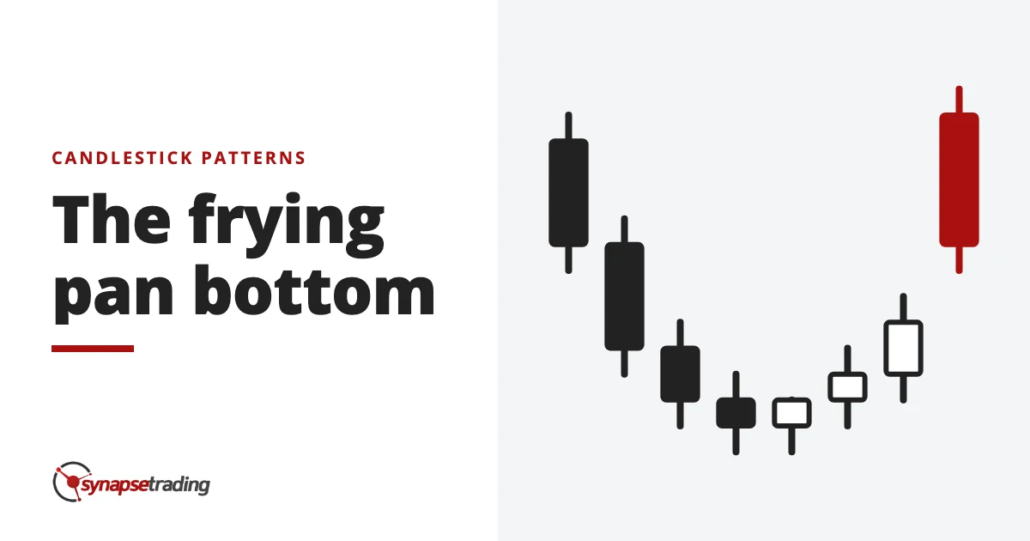
A frying pan bottom, also called a fry pan bottom, is a candlestick reversal pattern that forms after a fall in price. It starts as a run of small candles, of either colour, that curve gently into a rounded bottom, and it is completed when price gaps up into a white candle, leaving an empty space on the chart. The rounded base shows sellers slowly running out of steam. The gap shows buyers arriving in a hurry. Until that gap appears, all you have is a rounded base, which is why the candlestick books tell you not to anticipate the pattern. The same shape flipped upside down at a market top is called a dumpling top.
What does a frying pan bottom look like?
The name does most of the explaining. Seen from the side, the base of small candles looks like the curved bottom of a pan, and the gap up at the end is where the handle would be if you squint a little.
Steve Nison, whose 1991 book introduced candlestick charts to the West, groups it with the dumpling top as rounded turns confirmed by a window, the Japanese name for a gap. Gregory Morris, in Candlestick Charting Explained, writes that “the Fry Pan Bottom is similar to the Tower Bottom, except that the days are all small or short body days.” So if you know the tower bottom, think of the same turn made of quiet candles instead of loud ones.
Put together, the books ask for three things in order:
- A fall in price first. Usually several large down candles, because the pattern’s job is to end a decline.
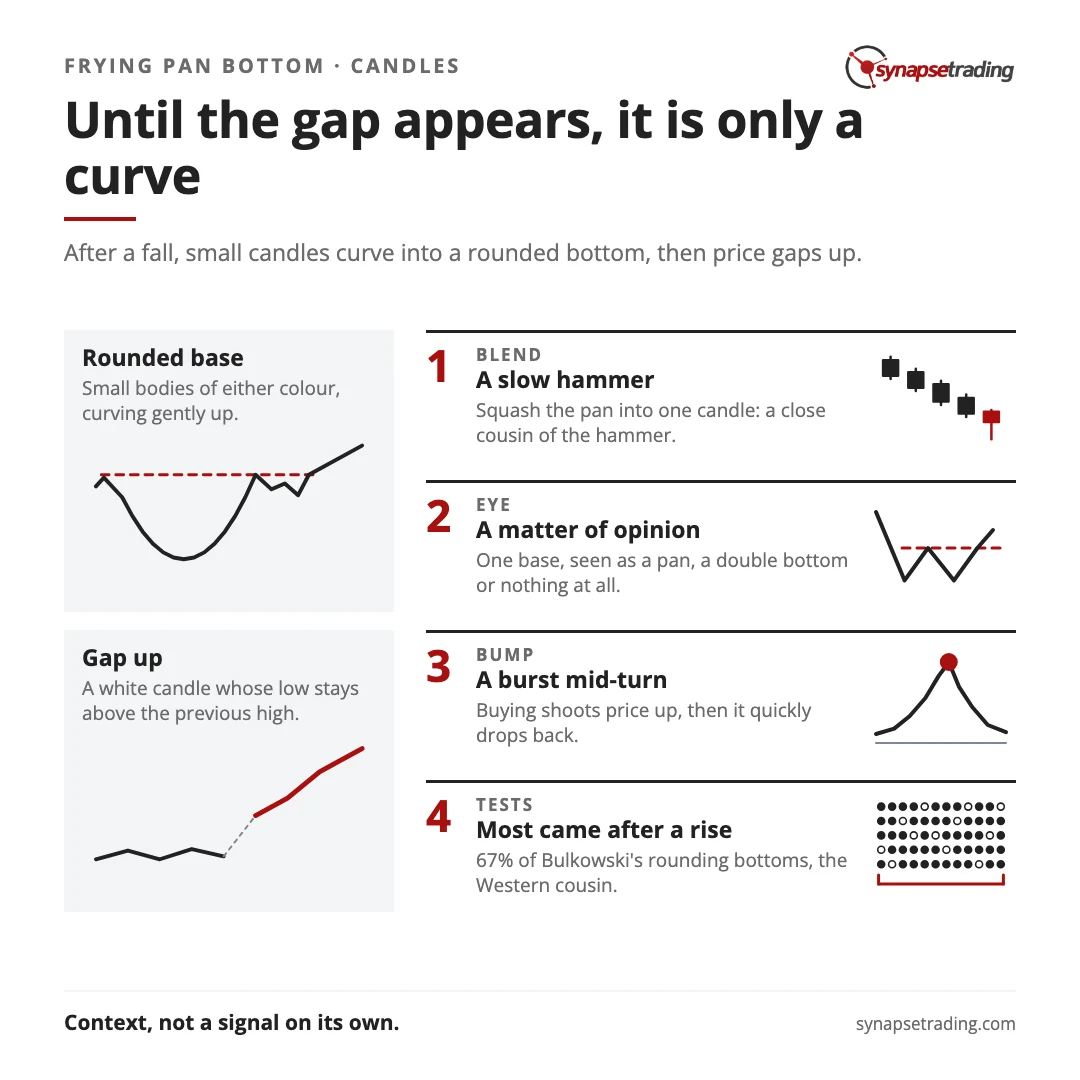
- A rounded base of small bodies. The colours can be mixed. What matters is that the lows slow down, flatten out and start curving up.
- A gap up into a white candle. The candlestick course I took in Singapore back in 2009 defined a rising window strictly, as a candle whose low stays above the previous candle’s high. A candle that merely opens above yesterday’s close and then trades back into yesterday’s range does not leave a window.
What is happening inside the pan?
Why would a market bottom slowly, when so many bottoms are sharp and violent?
Because nothing dramatic happens to end it. In a rounded bottom, the sellers do not get beaten in one fierce session. They just get tired. Robert Edwards and John Magee, writing about the Western version of this shape in 1948, called it “a gradual shift in the balance of power between buying and selling”. That is a polite way of saying the sellers ran out of shares before anyone noticed. That is supply and demand doing what it always does, as I explain in what moves prices in the financial markets.
Their favourite clue was volume. At the bottom of the bowl, with buyers and sellers in balance, very few shares change hands. They were blunt about it: “trading volume should ebb to an extreme low at the Bottom of a Bowl Pattern if its implications are to be trusted.” A quiet base is a sign that the people who wanted out have mostly already left.
Then comes the gap. A gap up means buyers were willing to pay more at the open than anyone had been asking the day before, so the handover is no longer gradual at all.
My 2009 course had a habit of asking how candles would look “if blended together”, squashed into one candle with the first open, the last close and the extremes of all of them. Try it on a whole frying pan and you usually get a white candle with a long lower shadow and a close near its high, a close cousin of the hammer. The pan is simply the same story told slowly.
Reading quiet bases like this is mostly a daily habit, and my free 15-minute swing trader checklist is the routine I use to keep it.
Is it a frying pan, or just a shape you want to see?
On 25 July 1976, NASA’s Viking 1 orbiter photographed a hill on Mars that looked uncannily like a human face. NASA’s own caption, released six days later, explained that the face “is formed by shadows giving the illusion of eyes, nose and mouth.” People went on seeing a face anyway, for years.
Charts do the same thing to traders. In August 2021, a trader on Reddit’s r/technicalanalysis asked whether a chart was “just a double bottom” or “a major round bottom”. It is a fair question, and the honest answer is that a curve is partly in the eye of the person drawing it. Two traders can look at the same base and see a pan, a double bottom or nothing at all.
That is the reason the gap matters so much. The curve is a matter of opinion, while the gap is a matter of record, because either price left an empty space on the chart or it did not.
I should also concede a limit, and it is a bigger one than most pattern guides admit. Thomas Bulkowski, who has tested chart patterns for decades, keeps statistics on rounding bottoms, the Western cousin of this pattern. In his figures, last updated in August 2020 and based on 990 patterns in bull markets, price was trending upward into the pattern 67% of the time. So most rounded bottoms were pauses in a rally rather than the end of a decline. The tidy story of exhausted sellers fits only about a third of them, and the candlestick definition, which asks for a fall first, quietly throws the rest away.
Why do the books say to wait for the gap?
Edwards and Magee noticed something odd about these bowls. Partway through the turn, “a burst of buying may shoot quotations straight up for a day or two”, and then, “almost invariably, prices will quickly drop back again into their former channel.” Bulkowski sees the same bump in his data, with price usually giving most of it back.
So the trader who buys the prettiest part of the curve is often buying the bump. Morris describes the gap as the event that “confirms the reversal”, and Nison treats an open window as an area of support afterwards. He also warned that if the window closes and selling continues, the move is in trouble. A bullish gap is a strong signal for exactly that reason, because it is a level the buyers now have to defend.
The gap brings its own problem, though. On 8 November 2025, I told viewers of my weekly outlook that Datadog looked like “quite a nice accumulation and then breakout”. But “after such a strong gap up”, I said, it was “a bit dangerous to buy it because it’s hard to put a good stop loss”. The bigger the gap, the further price has already run from the base, and the harder it is to say where the idea would turn out to be wrong. A frying pan with a huge gap can be a perfectly good pattern and still be a poor trade.
When it works, it tends to work patiently. Bulkowski’s rounding bottoms failed to rise even 5% only 4% of the time, and the average rise was 48%, measured to the highest point before a 20% fall, which no real trader ever catches exactly. Edwards and Magee described the advance after a bowl as “slow and subject to frequent interruptions”, tiring out the impatient trader. Do note that those figures are for the Western rounding bottom over months, not for the candlestick version over days, so treat them as a family resemblance rather than a forecast.
Personally, I treat a frying pan bottom as context rather than a signal on its own. It tells me the selling has dried up near a level, which is worth knowing, and then the usual questions about trend, support and risk still have to be answered. If you would rather check that once a day than all day, the free 15-minute swing trader checklist is the routine I run myself.
FAQ
Is a frying pan bottom bullish or bearish?
It is bullish. It forms after a decline, shows the selling drying up in a rounded base, and is completed by a gap up into a white candle.
How does a frying pan bottom differ from a dumpling top?
It has the same shape, turned over. The pan forms after a fall and ends with a gap up into a white candle, while the dumpling forms after a rise and ends with a gap down into a black one.
What counts as the gap in a frying pan bottom?
In the strict definition, the white candle’s low stays above the previous candle’s high, leaving an empty space. An open above the prior close that trades back into the prior range does not count.
How is a frying pan bottom different from a rounding bottom?
They describe the same shape. The frying pan is the candlestick version, made of small candles and completed by a gap. The rounding bottom is the Western chart pattern, which often takes months to form.
Why should you not anticipate a frying pan bottom?
Because a rounded base can stall, roll over or bump up and fall back. Until the gap appears, it is only a curve.
How reliable is the frying pan bottom?
No test of the candlestick version is cited here. Bulkowski’s figures for rounding bottoms, last updated in August 2020, show a 4% break even failure rate, but 67% of them came after a rise rather than a fall.
Have you ever bought a rounded base that turned out to be the bump in the middle of the bowl? Let me know in the comments, along with whether you trust the curve or wait for the gap.
For every candle pattern in one place, read The Definitive Guide to Candlestick Patterns.
And if you want a routine that spots quiet bases without hours at the screen, grab the free 15-minute swing trader checklist.
About the author. Spencer Li is The 15-Minute Trader and the founder of Synapse Trading. He is a Certified Financial Technician (CFTe) with 15+ years of trading, run from 70+ countries. He holds a B.Acc and B.BM from SMU. Every trade he takes is public, dated, losses left in. He teaches rules-based swing trading in 15 minutes a day, one system for any market.
Education, not financial advice. Synapse Trading is not licensed by MAS to advise on investment products. Trading carries risk of loss, and past performance is not indicative of future results.
Want the daily routine? Enter your email for the free 15-Minute Swing Trader's Checklist.
Free 5-page PDF, then occasional trading emails. Education only, not financial advice. Unsubscribe anytime. Kit stores your email in the US: see our privacy policy.
Want to learn the full method? The Trading Mastery Program teaches the 4 strategies I have traded since 2011. It suits beginners and experienced traders.
Rather follow the trades as they happen? Daily Trading Signals is our Telegram channel: my trade ideas with entry, stop and exit, and every trade is public.
Questions about this post? Ask in the free Telegram channel →
Educational content only, not personalised financial advice. Trading carries risk, including loss of capital. Past performance is not indicative of future results. Synapse Trading is not licensed or regulated by MAS.

