

Bullish Gap and Bearish Gap Candlestick Patterns: How to Read Them
Want the daily routine? Get the free 15-Minute Swing Trader’s Checklist. Get it free →
By Spencer Li, CFTe · Last updated: 26 October 2026
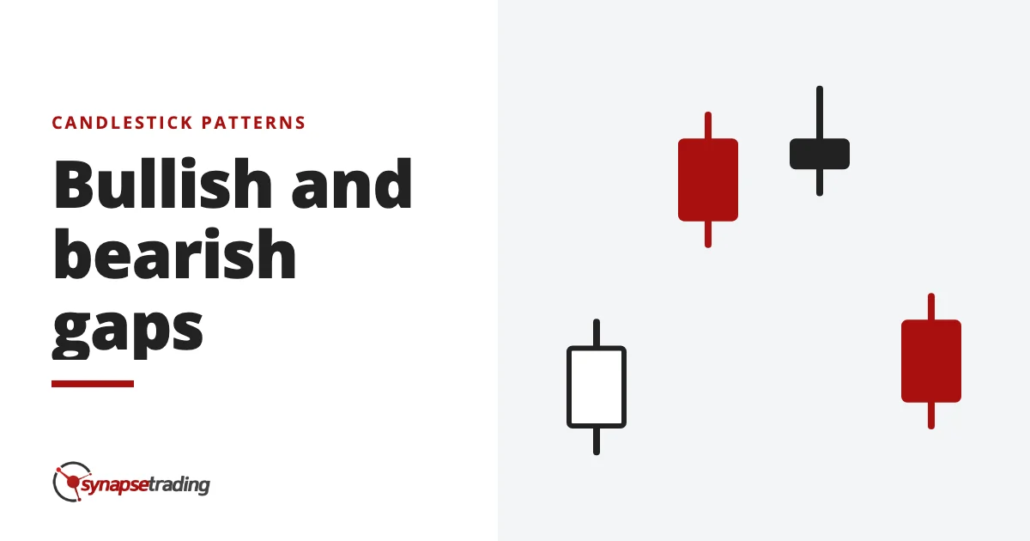
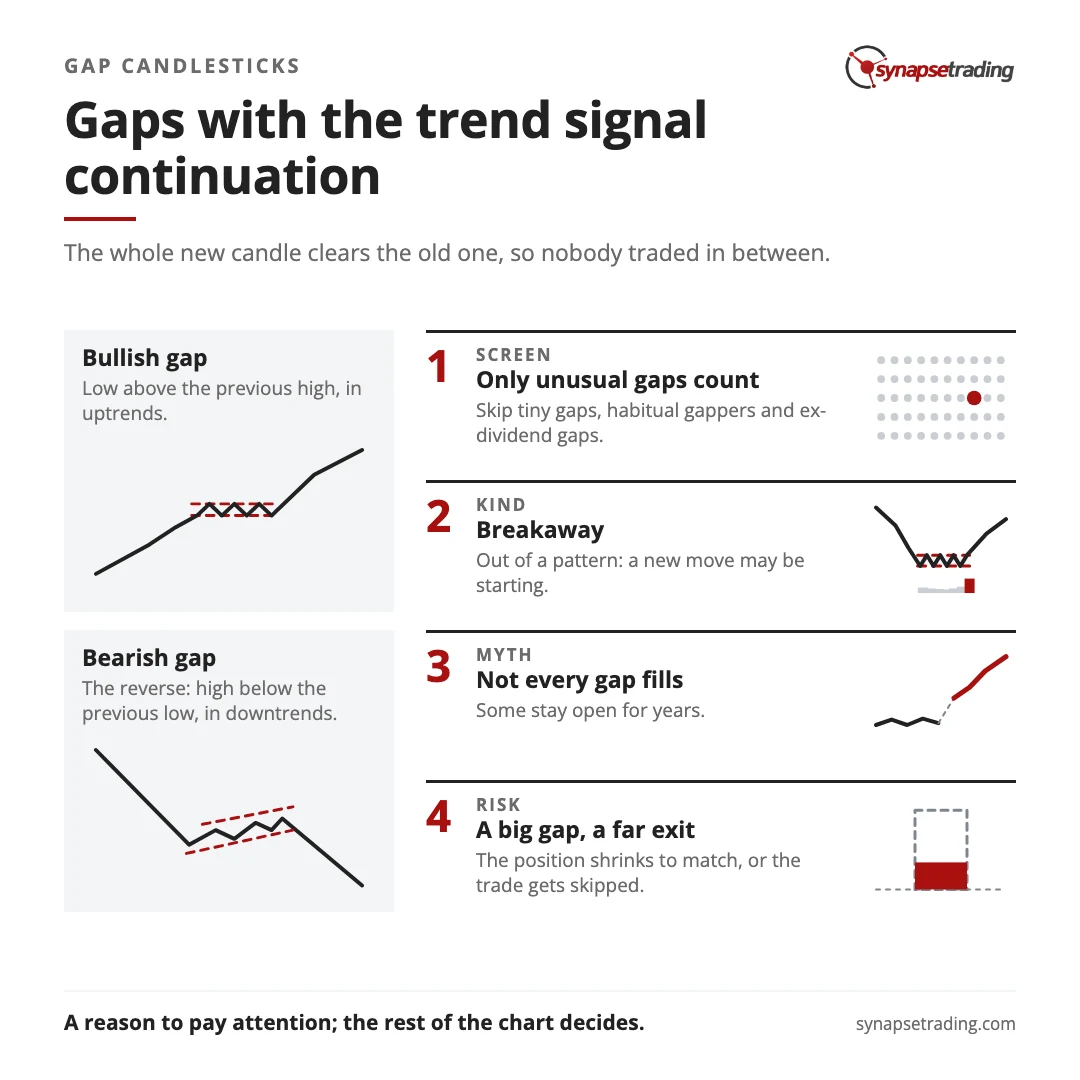
A bullish gap is a jump up in price that leaves an empty space on the chart between one candle and the next, and a bearish gap is the same jump down. Strictly speaking, a true gap needs the whole new candle to clear the old one, so the low of a bullish gap candle sits above the previous high, and nothing traded in between. A gap in the direction of the trend usually reads as continuation. A gap that bursts out of a sideways range can mark the start of a new move. And the popular belief that every gap must be filled is wrong, or at least badly timed, because some gaps stay open for years.
What counts as a gap on a candlestick chart?
Every gap on your chart hides an odd fact. It marks a range of prices at which nobody traded at all.
Edwards and Magee, whose Technical Analysis of Stock Trends first came out in 1948, define it exactly that way. On a daily chart, the day’s lowest price sits above the previous day’s highest, or the reverse, so the two ranges never touch the same level.
That definition is stricter than the one many sites use. Plenty of guides call any candle that opens above the previous close a bullish gap. But a stock can open higher and then trade straight back down into yesterday’s range before lunch, and by the close there is no empty space left on the chart. That is a gap open, and it says far less than a gap that stays open all session.
Edwards and Magee also threw out three kinds of gap before they would read anything into one:
- Tiny gaps. A gap has to be wider than the normal day-to-day price changes in that stock, or it is just noise.
- Habitual gappers. In a thinly traded stock that gaps all the time, no single gap means anything special.
- Ex-dividend gaps. When a stock goes ex-dividend, its price drops by roughly the dividend, so the gap reflects a change in what the stock is worth rather than a shift in supply and demand.
What survives the screen is a gap that is unusual for that stock, and those are the ones worth reading.
What do bullish and bearish gaps usually tell you?
So you have found a real gap. What does it mean?
Bullish gaps cluster in uptrends, after a run of strong green candles. Buyers wanted in so badly overnight that they were willing to skip a whole range of prices to get filled, and that urgency is the signal. Most of the time it says the trend has more in it.

A bearish gap is the mirror image. It turns up in downtrends, after a run of heavy red candles, when sellers were in such a hurry that the next session opened below the whole of the last one.

The empty space also matters later. In my slides from a candlestick course I took in Singapore, a 2009 edition, these gaps are called windows. The course taught that a rising window tends to act as support when price comes back to it, while a falling window tends to act as resistance. I pointed one out in my weekly outlook on 11 December 2025. There was “a gap down that never really got closed”, and price had climbed right back up to that level. Whether it could clear that zone and make a new high was, as I said that day, “the key thing”.
I cover the window version of this idea in more detail in rising window and falling window.
Reading gaps well is mostly a habit of looking at the same few things every day, and my free 15-minute swing trader checklist is the routine I run myself.
Which kind of gap are you looking at?
Two gaps can look identical on the chart and mean opposite things, so the useful question is where the gap sits. Edwards and Magee sorted gaps into four kinds.
| Kind of gap | Where it shows up | What it usually means |
|---|---|---|
| Common or area gap | Inside a sideways range | Very little, and it is usually filled within days |
| Breakaway gap | As price breaks out of a pattern | A new move may be starting, with real force behind it |
| Runaway or measuring gap | In the middle of a fast trend | The trend is still running |
| Exhaustion gap | Near the end of a long move | The move may be running out of buyers or sellers |
The breakaway gap is the one I find most interesting. Edwards and Magee explain it with a “vacuum on the books”. Imagine a stock that keeps hitting a ceiling at 40. People who planned to sell a little higher get tired of waiting, so they either sell at 40 with everyone else or decide that once it breaks 40, it will go much higher. Either way, there are hardly any sellers just above 40, so when the last of the supply at 40 is gone, the next buyer finds nothing to buy and has to pay up a full point or more. Their verdict was blunt: “false moves are seldom attended by gaps”.
The trouble is that a runaway gap and an exhaustion gap look the same on the day they happen. Martin Pring warned that “a second or third runaway gap will be the final one”, and noted that exhaustion gaps are usually closed within a few sessions. Often you only find out which one you had after the fact.
News gaps are the hardest of all. In January 2026, I told viewers of my weekly outlook that Oklo had gapped up on news that it was working with Meta, “and then unfortunately it kind of gradually closed down”, which triggered our trailing stop. Two weeks later I noted that it had gapped up again after we exited, “which shows how unpredictable it is”. A gap that comes from a headline says more about the headline than about the trend.
Do all gaps get filled?
On 11 March 2025, a trader on Reddit’s r/Daytrading asked a question I hear all the time: “Do all gaps get filled?” They meant gaps on the daily chart, and it is a fair thing to wonder, because “gaps always get filled” is probably the most repeated rule in the whole topic.
There is a nice parallel in the history of science. For about two thousand years, people believed that nature abhors a vacuum. Aristotle argued that a true void could never last, because the stuff around it would rush in to fill it at once. Then, in 1643, Evangelista Torricelli turned a glass tube of mercury upside down and left one of the first lasting vacuums ever made in a lab at the top of it. The empty space simply stayed there. The same thing happens on a chart.
Edwards and Magee called the gap version of this belief “the most common superstition” in charting, and they were not gentle about it. Their answer to whether a gap must be closed before prices move far away from it was: “Certainly not.” They told the story of a buyer of Chesapeake and Ohio in October 1929 who bought in, counting on a gap just below to be filled, and “had to wait nearly seven years to get out even”. Hundreds of gaps from the 1929 to 1930 markets, they noted, were never covered at all.
Now, to be fair to the rule, they did concede one thing. Asked whether a gap will be closed eventually, they answered: “Probably yes.” But they added that it might take until the next major swing the other way, which “may be years later”, and that is hardly a matter of interest to someone trading a two-week swing. They also made a sharper point. The same odds apply to a stock returning to any price it has traded at before, gap or no gap.
So a gap will probably get filled one day, in the same way a stock you bought at the top will probably get back there one day. Neither fact helps much with a trade you are holding right now.
How should a gap change what you do?
Personally, I treat a gap as a reason to pay attention, and I let the rest of the chart decide what happens next.
The first thing I look at is where the gap came from. A gap out of a well-defined range on strong volume carries a lot more weight than a gap in the middle of nowhere or a gap on a headline. The second is what the gap does to my risk. On 8 November 2025, I looked at Datadog after a big gap up in my weekly outlook and said that “it’s a bit dangerous to buy it because it’s hard to put a good stop loss”. When price has jumped a long way in one go, the obvious place to admit you were wrong is often a long way below, and the position has to shrink to match, or the trade gets skipped.
The third is the calendar. Many of the biggest gaps come from earnings, which usually land outside market hours, so you cannot get out in the middle of one. That is why the only news item in my own daily routine is to avoid holding a swing trade through earnings. If you would like that routine in 15 minutes a day, the free 15-minute swing trader checklist is the one I use.
FAQ
Is a gap up bullish or bearish?
In an uptrend, a gap up usually reads as bullish continuation. In a downtrend, it means less unless it breaks price out of a pattern, and a gap on a headline can fade quickly.
What is the difference between a gap and a gap open?
A true gap leaves an empty space on the chart, because the whole new candle sits above or below the old one. A gap open only means price opened above or below the last close, and it may trade back into the old range the same day.
Do all gaps get filled?
No. Many common gaps fill within days, but some gaps stay open for years. Edwards and Magee found hundreds from 1929 and 1930 that were never covered.
What is a breakaway gap?
It is a gap that forms as price breaks out of a pattern, such as a range or a triangle. It suggests the new move has unusual force behind it, since false breakouts rarely gap.
What is an exhaustion gap?
It is a gap near the end of a long move, as the last buyers or sellers rush in. It often closes within a few sessions, which is usually how you find out it was an exhaustion gap.
Do gaps happen in forex and crypto?
Less often. Forex trades around the clock on weekdays, so its gaps mostly appear over the weekend. Most crypto exchanges never close, so true gaps there are rare, while stocks can gap every morning.
Have you ever waited for a gap to fill that never did? And do you trust a gap more when it comes from a breakout or from the news? Let me know in the comments.
For every candle pattern in one place, read The Definitive Guide to Candlestick Patterns. For a pattern built from three gaps in a row, see the sanku three gaps pattern, and for the wider picture, start with my free trading guides.
And if you want a 15-minute daily routine instead of hours at the screen, grab the free 15-minute swing trader checklist.
About the author. Spencer Li is The 15-Minute Trader and the founder of Synapse Trading. He is a Certified Financial Technician (CFTe) with 15+ years of trading, run from 70+ countries. He holds a B.Acc and B.BM from SMU. Every trade he takes is public, dated, losses left in. He teaches rules-based swing trading in 15 minutes a day, one system for any market.
Education, not financial advice. Synapse Trading is not licensed by MAS to advise on investment products. Trading carries risk of loss, and past performance is not indicative of future results.
Want the daily routine? Enter your email for the free 15-Minute Swing Trader's Checklist.
Free 5-page PDF, then occasional trading emails. Education only, not financial advice. Unsubscribe anytime. Kit stores your email in the US: see our privacy policy.
Want to learn the full method? The Trading Mastery Program teaches the 4 strategies I have traded since 2011. It suits beginners and experienced traders.
Rather follow the trades as they happen? Daily Trading Signals is our Telegram channel: my trade ideas with entry, stop and exit, and every trade is public.
Questions about this post? Ask in the free Telegram channel →
Educational content only, not personalised financial advice. Trading carries risk, including loss of capital. Past performance is not indicative of future results. Synapse Trading is not licensed or regulated by MAS.

