

Rising Window & Falling Window Pattern
Want the daily routine? Get the free 15-Minute Swing Trader’s Checklist. Get it free →
Rising and Falling Window Candlestick Pattern
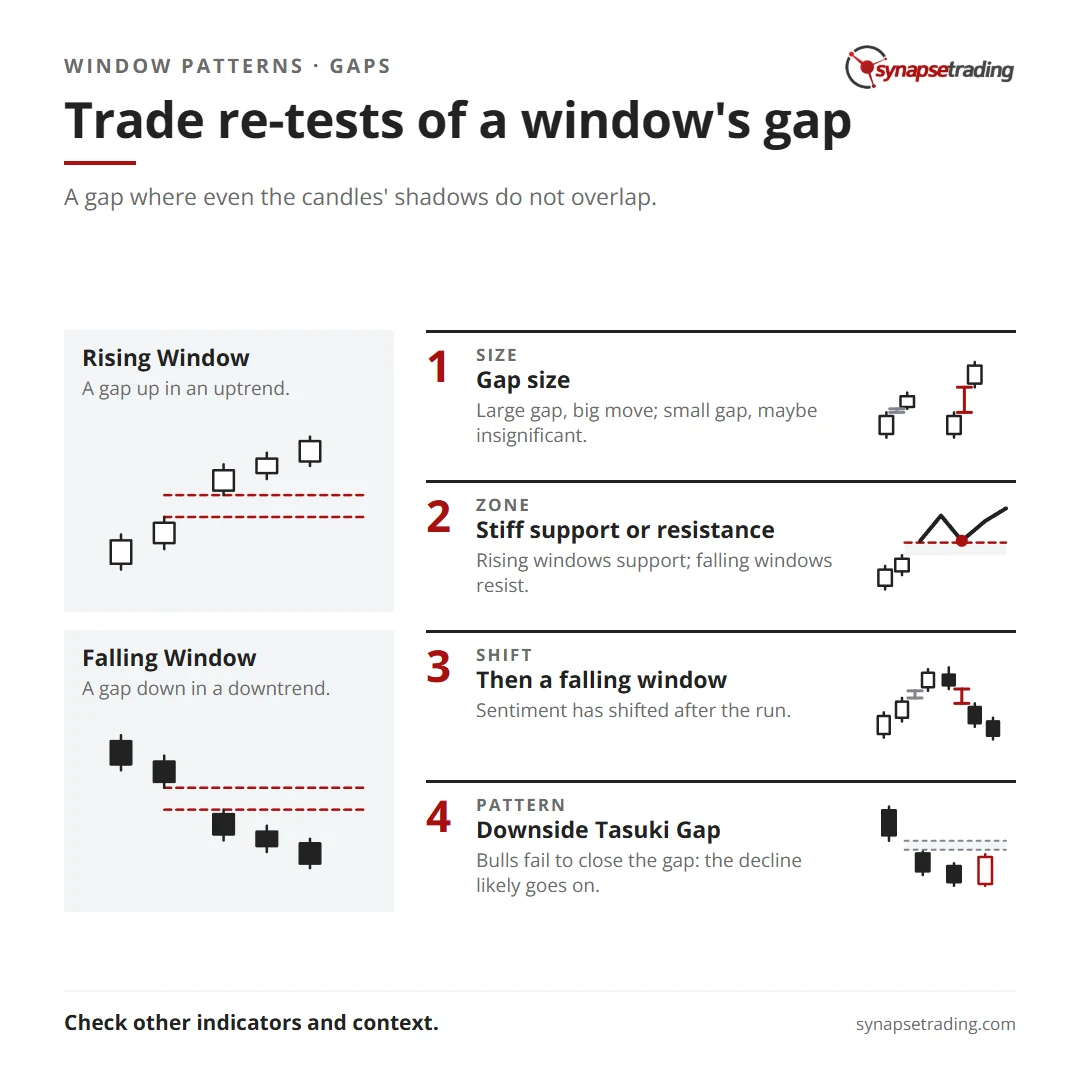
The support and resistance zones of Window candlestick patterns are highly rigid.
In the case of a Falling Window candlestick pattern, a stiff resistance region is generated, which provides a higher probability of trade opportunities during consecutive re-tests of the resistance area.
Similarly, a stiff support region is generated in the case of a Rising Window candlestick pattern, also offering better trade opportunities during consecutive re-tests of the support area.
In today’s blog, we will discuss how to use the Rising and Falling Window Candlestick Pattern in detail.
What is Rising Window Candlestick Pattern?
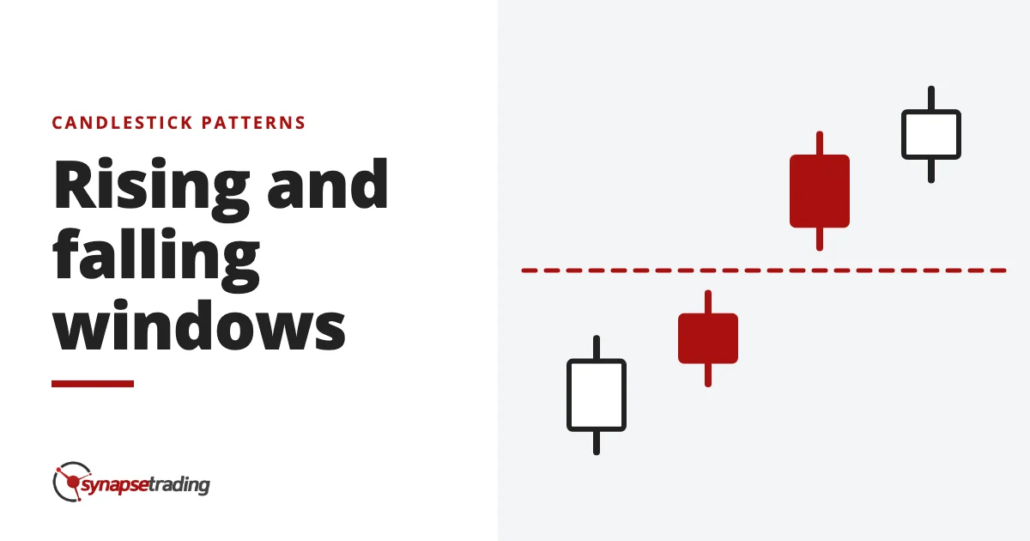
To form a Window (whether rising or falling), there must be space between the real bodies of two candles, and even their shadows should not overlap.
During an uptrend, a Rising Window is a price gap that forms.
The space between the candles represents the distance between the high of the previous candle and the low of the current candle.
This trend indicates that the bulls are in control, and the price is likely to continue rising.
Examine the size of the gap to better understand the pattern’s message.
For example, a large gap denotes a significant price increase, while a small gap indicates a modest and possibly insignificant price change.
Formation
The Rising Window, also known as a “gap up,” appears when the price continuously rises.
It is always regarded as a bullish signal.
This pattern is common, though less frequent on charts with longer time scales.
Trading with Rising Window Candlestick Pattern
The chart typically begins with an upward trend.
At the start of this movement, the bulls create a gap up (i.e., a Rising Window) to demonstrate their strength.
The uptrend continues with predominantly white candles increasing steeply.
Eventually, when the trend reverses, the bears become strong enough to form a downward gap, known as a Falling Window.
This pattern indicates a significant shift in investor sentiment, with both a gap up and a gap down.
What is Falling Window Candlestick Pattern?
A Falling Window candlestick pattern refers to a price gap during a downward trend.
It must occur while the price trend is down, and it is always a bearish signal.
This continuation pattern is more common on charts with shorter time scales, though it is less frequent on longer time scales.
Due to its prevalence, it’s crucial to pay attention to the specific characteristics of each Falling Window, as these details can help determine the importance of the signal and whether it warrants attention.
Formation
When observing the two candles that follow the Falling Window, examine them closely.
If these candles do not close the window or fill the gap (including their shadows), a Downside Tasuki Gap pattern may have formed.
For this pattern to qualify, the first and second candles must be bearish, while the third must be bullish.
After a significant downturn, as indicated by the gap down, the bulls may attempt to push the price back up.
However, if they fail, the decline is likely to continue.
What is the Falling Window Candlestick Pattern?
A Falling Window candlestick pattern is a bearish continuation pattern that results from a gap down between two consecutive candlesticks.
There is a “window” or space between the first and second candlesticks because the opening price of the second is lower than its closing price.
What is the Rising Window Candlestick Pattern?
The Rising Window is a bullish continuation pattern in Japanese candlestick charting.
It typically manifests as a rejection from lower prices and appears as a pause following an upward price trend.
This pattern is considered bullish, as it suggests a continuation of the upward movement after the Rising Window appears at the right time.
Concluding Thoughts
The Rising and Falling Window candlestick patterns are important tools for traders to identify potential trade opportunities.
By recognizing the stiff support and resistance regions these patterns create, traders can better assess the likelihood of successful trades during re-tests of these areas.
While these patterns provide valuable insights into market trends, it is essential to consider additional technical indicators and broader market conditions to make informed trading decisions.
Always be mindful of the context in which these patterns appear, and use them as part of a comprehensive trading strategy.
Want the daily routine? Enter your email for the free 15-Minute Swing Trader's Checklist.
Free 5-page PDF, then occasional trading emails. Education only, not financial advice. Unsubscribe anytime. Kit stores your email in the US: see our privacy policy.
Want to learn the full method? The Trading Mastery Program teaches the 4 strategies I have traded since 2011. It suits beginners and experienced traders.
Rather follow the trades as they happen? Daily Trading Signals is our Telegram channel: my trade ideas with entry, stop and exit, and every trade is public.
Questions about this post? Ask in the free Telegram channel →
Educational content only, not personalised financial advice. Trading carries risk, including loss of capital. Past performance is not indicative of future results. Synapse Trading is not licensed or regulated by MAS.

