

Thrusting Line Pattern
Want the daily routine? Get the free 15-Minute Swing Trader’s Checklist. Get it free →
What Is a Thrusting Line?
Definition
The term thrusting line refers to a bearish or two-candle pattern in technical analysis. Along with being the continuation of a bearish pattern, a thrusting line may also alert traders to the reversal of a bullish pattern.
The pattern is identifiable by the second candlestick, which closes near or at the mid-point of the candlestick body just before it on a chart. This indicates that prices will continue to drop, leading to the possibility of short selling as buyers exit the market.
Understanding Thrusting Lines
Stock traders, especially technical analysts, constantly seek patterns that can provide insights into the direction a stock might take next. The thrusting line is one such pattern, useful in determining whether a stock’s price will continue to rise or fall.
The thrusting line is part of a two-candlestick pattern. The first candle is a large down candle with a longer wick at the bottom, while the second candle is an up candle with a longer wick at the top. The position of the second candle’s open and close relative to the first candle indicates the strength of buying pressure and whether that pressure is likely to continue.
The pattern can provide traders with a signal to enter short trades if a downward continuation thrusting line develops, betting on further decline.
Types of Thrusting Line Patterns
Thrusting lines can be categorized into three types: continuation, neutral, and reversal. Each type provides different insights into market behavior:
Continuation
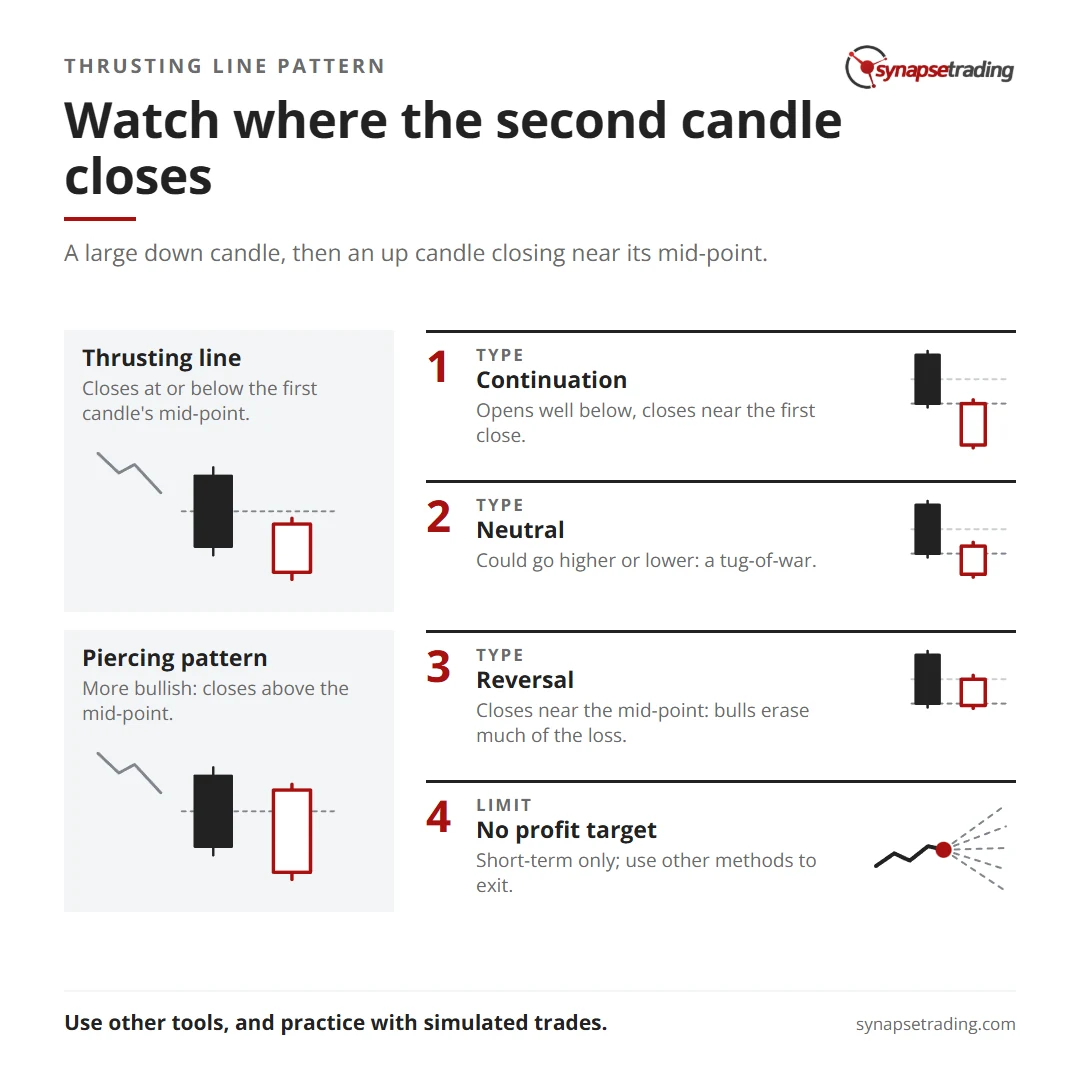
If the second candle opens well below the close of the first candle and closes near the close of the first candle, it indicates a weak bullish move. The downward trend is likely to continue, and selling is expected to resume over the following sessions or candles.
Neutral
If the second candle opens below the close of the first but closes near or slightly above the close of the second, the pattern is neutral. The price could move higher or lower in the next session, indicating a tug-of-war between bulls and bears.
Reversal
If the price of the second candle opens near the close of the first candle and closes near the mid-point of the first candle, it signals an upside reversal. The bulls have managed to erase much of the prior loss, suggesting a potential gain in price as sellers pause and more buyers enter the market.
Limitations of Thrusting Lines
Not all thrusting lines develop as expected. Therefore, it’s important to use thrusting patterns alongside other forms of analysis, such as trend analysis, other price action signals, and technical indicators.
Thrusting lines offer only a short-term outlook for price direction. They don’t provide a profit target, so traders need to rely on other methods to determine when to exit trades.
What Are the Three Types of Thrusting Line Candlestick Patterns?
The three types of thrusting line candlestick patterns are continuation, neutral, and reversal.
In a continuation pattern, downward pressure is expected to persist, and selling is likely to resume.
In a neutral pattern, prices could go higher or lower.
In a reversal pattern, bulls have managed to turn things around, leading to gains in asset prices.
What Is the Difference Between a Thrusting Line and a Piercing Pattern?
Thrusting lines and piercing patterns are similar but have key differences.
In a thrusting line, the second candle closes at or below the mid-point of the first candle.
In a piercing pattern, the second candle is more bullish, closing above the mid-point but below the open of the first down candle.
Concluding Thoughts
If you’re incorporating technical analysis into your investment strategy, understanding patterns like the thrusting line can help you gauge market sentiment and potential price movements.
However, remember that thrusting lines are short-term indicators and should be used in conjunction with other analysis tools to improve trading decisions.
Before making trades based on this pattern, be sure to do your research, plan carefully, and practice with simulated trades to increase your chances of success.
Want the daily routine? Enter your email for the free 15-Minute Swing Trader's Checklist.
Free 5-page PDF, then occasional trading emails. Education only, not financial advice. Unsubscribe anytime. Kit stores your email in the US: see our privacy policy.
Want to learn the full method? The Trading Mastery Program teaches the 4 strategies I have traded since 2011. It suits beginners and experienced traders.
Rather follow the trades as they happen? Daily Trading Signals is our Telegram channel: my trade ideas with entry, stop and exit, and every trade is public.
Questions about this post? Ask in the free Telegram channel →
Educational content only, not personalised financial advice. Trading carries risk, including loss of capital. Past performance is not indicative of future results. Synapse Trading is not licensed or regulated by MAS.

