
• Link to Facebook
  • Link to X
  • Link to Instagram
  • Link to Youtube
  • Link to LinkedIn
  • Link to Mail
Free PDF: The 15-Minute Swing Trader's Checklist, the daily routine on the record since 2014
Synapse Trading
  • Mentoring
    • Trading Mastery Program
    • All mentoring options
  • Signals
    • Daily trading signals
    • Signals trade log
  • Results
    • Student results and testimonials
    • Public trade log, losses left in
  • Free guides
    • Start here
    • Trading foundations
    • Technical analysis
    • Strategies and systems
    • Risk and money
    • Trading psychology
    • Markets and products
    • Free trading guides
    • Tools and resources
    • Blog
  • About
    • My background
    • My trading journey
    • Media and interviews
    • Travel log
  • Contact
    • Contact me
    • Partnerships
  • Start free
  • Click to open the search input field Click to open the search input field Search
  • Menu Menu
The Synapse Network

Bullish Three Line Break & Bearish Three Line Break
Technical Analysis & Price Action
Three line break charts - candlestick patterns
Home › Trading guides › Candlestick patterns guide

Want the daily routine? Get the free 15-Minute Swing Trader’s Checklist. Get it free →

Table of Contents

Toggle
  • Bullish Three Line Break
  • Bearish Three Line Break
    • Concluding Thoughts

Bullish Three Line Break

Definition

A bullish three line break structure is comprised of four Japanese candlesticks.

The first three candlesticks are bullish (green) and small.

The opening occurs at the closing price of the previous candlestick, and the closing occurs at the highest point of the candlestick.

The fourth candlestick is large, bearish (red), and encompasses the three bullish candlesticks.

It must close below the opening level of the first one.
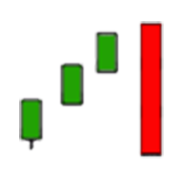
Bullish three line break

Characteristic
A bullish three line break structure often forms after a significant rise characterized by several large green Japanese candlesticks.

Significance

Contrary to what one might think, this does not signal a reversal of the trend.

A bullish three line break is a continuation pattern; it indicates continuation of the bullish movement.

It is the sign of significant profit-taking that allows the increase to start again on a good basis.

Note
It is important that the three bullish candlesticks close at their high point.

Invalidation
If the closing of the last candlestick does not occur below the opening level of the first candlestick, or if the closing does not occur at the low point, then the bullish three line break structure is invalidated.

Bearish Three Line Break

Definition

A bearish three line break structure is comprised of four Japanese candlesticks.

The first three candlesticks are bearish (red) and small.

The opening occurs at the closing price of the previous candlestick, and the closing occurs at the lowest point of the candlestick.

The fourth candlestick is large, bullish (green), and encompasses the three bearish candlesticks.

It must close below the opening level of the first one.
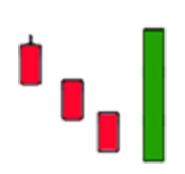
Bearish three line break

Characteristic
A bearish three line break structure often forms after a significant drop characterized by several large red Japanese candlesticks.

Significance
Contrary to what one might think, this does not signal a reversal of the trend.

A bearish three line break is a continuation pattern; it indicates continuation of the downward movement.

This is a sign of significant profit-taking that allows the drop to start again on a good basis.

Note
It is important that the three bearish candlesticks close at their low point.

Invalidation
If the closing of the last candlestick does not occur below the closing level of the first candlestick, or if the closing does not occur at the high point, then the bearish three line break structure is invalidated.

Concluding Thoughts

The bullish and bearish three line break patterns are continuation patterns that, despite their appearance, do not signal a reversal.

Instead, they indicate a temporary pause for profit-taking before the original trend continues.

Understanding these patterns can help traders identify moments of consolidation within a trend, allowing them to make informed decisions about the continuation of the market direction.

It is crucial to validate these patterns with proper closing levels to avoid false signals.


Want the daily routine? Enter your email for the free 15-Minute Swing Trader's Checklist.

Free 5-page PDF, then occasional trading emails. Education only, not financial advice. Unsubscribe anytime. Kit stores your email in the US: see our privacy policy.

Want to learn the full method? The Trading Mastery Program teaches the 4 strategies I have traded since 2011. It suits beginners and experienced traders.

Rather follow the trades as they happen? Daily Trading Signals is our Telegram channel: my trade ideas with entry, stop and exit, and every trade is public.

Questions about this post? Ask in the free Telegram channel →

Educational content only, not personalised financial advice. Trading carries risk, including loss of capital. Past performance is not indicative of future results. Synapse Trading is not licensed or regulated by MAS.

Part of the Candlestick patterns guide · all posts on Technical Analysis & Price Action

← Previous: Mat Hold PatternNext: On Neck Pattern →

More from this guide

  • How to Combine Candlestick Patterns (Blended Candles)
  • Thrusting Line Pattern
  • Bullish Irikubi & Bearish Irikubi Pattern
by The Synapse Network
Share this entry
  • Share on Facebook
  • Share on X
  • Share on WhatsApp
  • Share on Pinterest
  • Share on LinkedIn
  • Share on Tumblr
  • Share on Vk
  • Share on Reddit
  • Share by Mail
  • Visit us on Yelp
  • Link to Instagram
  • Link to Youtube
https://synapsetrading.com/wp-content/uploads/2026/10/bullish-three-line-break-bearish-three-line-break-card.webp 630 1200 The Synapse Network https://synapsetrading.com/wp-content/uploads/2026/10/synapse-logo-horizontal-light.png The Synapse Network2023-08-23 13:35:132026-09-12 09:56:24Bullish Three Line Break & Bearish Three Line Break

Free checklist

The 15-Minute Swing Trader’s Checklist

The daily and weekly routine I use to find, manage and review trades in about 15 minutes a day, on the record since 2014.

Get the free checklist

Topics

  • Trading foundations
  • Technical analysis
  • Strategies and systems
  • Risk and money
  • Trading psychology
  • Markets and products

Synapse Trading

Swing trading for busy professionals, in 15 minutes a day.

Start free

Learn

  • Start here
  • Free trading guides
  • Blog
  • Tools and resources

Programs

  • Trading Mastery Program
  • Daily trading signals
  • Student results
  • Public trade log

Company

  • About
  • Contact me
  • Partnerships
  • Disclaimer
  • Privacy policy
  • Terms & Conditions

Synapse Trading Pte Ltd
Registration No. 201316168H
WhatsApp +65-8897-1204
info@synapsetrading.com

Contact Us

Synapse Trading Pte Ltd
Registration No. 201316168H

Whatsapp: +65-8897-1204
Telegram: @iamrecneps
Email: info@synapsetrading.com

Links

Disclaimer
Privacy policy
Terms & Conditions
Contact us
Partnerships

© 2012-2026 Synapse Trading | All rights reserved. Educational content only, not personalised financial advice. Trading carries risk, including loss of capital. Past performance is not indicative of future results. Synapse Trading is not licensed or regulated by MAS.
  • Link to Facebook
  • Link to X
  • Link to Instagram
  • Link to Youtube
  • Link to LinkedIn
  • Link to Mail
Link to: Mat Hold Pattern Link to: Mat Hold Pattern Mat Hold Pattern
The mat hold pattern - candlestick patterns
Link to: Up Gap Side-by-Side White Lines & Down Gap Side-by-Side White Lines Link to: Up Gap Side-by-Side White Lines & Down Gap Side-by-Side White Lines
Side-by-side white lines - candlestick patterns
Up Gap Side-by-Side White Lines & Down Gap Side-by-Side White Lines
Scroll to top Scroll to top Scroll to top