

Morning Star Candlestick Pattern: How to Spot a Real Bottom and Trade It
Want the daily routine? Get the free 15-Minute Swing Trader’s Checklist. Get it free →
By Spencer Li, CFTe · Last updated: 21 August 2026
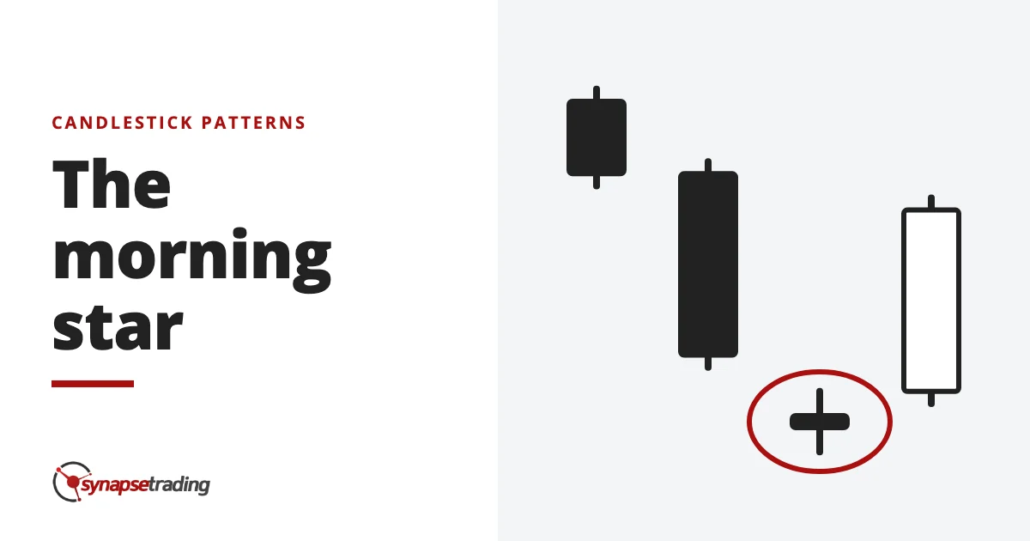
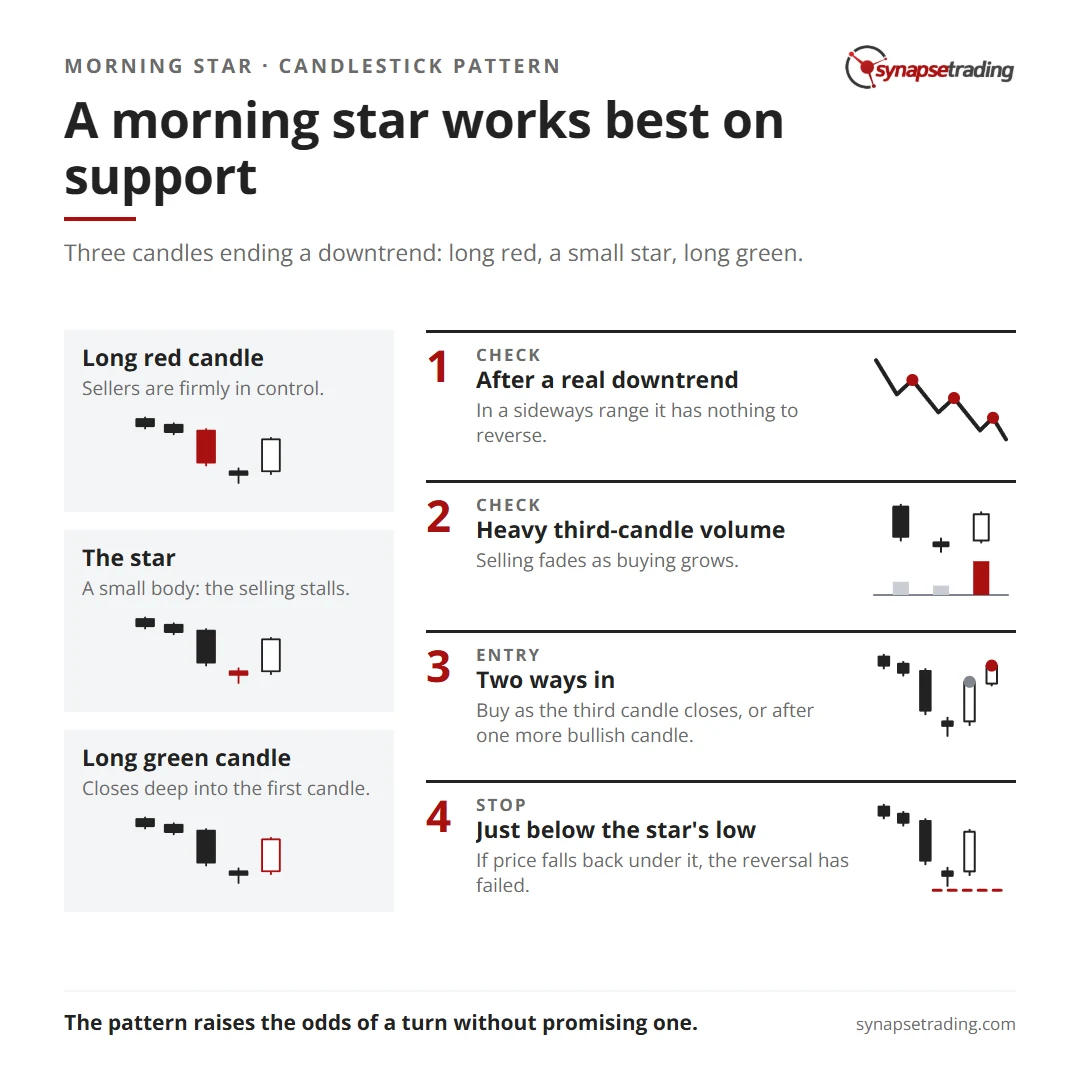
The morning star candlestick pattern is a three-candle bullish reversal pattern that forms at the end of a downtrend. First comes a long red candle, then a small-bodied candle called the star that gaps lower, and then a long green candle that closes well into the body of the first one. Read together, the three candles show sellers in control, then sellers running out of steam, and then buyers taking over, which is why traders treat it as an early sign that the fall may be ending.
Most traders buy on the close of the third candle, or after one more bullish candle confirms it, and place their stop just below the low of the star. The pattern only means something after a real downtrend, and it works best on a support level that has held before.
That definition takes about ten seconds to learn. Knowing which morning stars to trade and which to walk past takes a lot longer, and that is what most of this post is about.
Why is it called a morning star?
Candlestick charts come from Japan, and most Western traders first learned them from Steve Nison, whose book Japanese Candlestick Charting Techniques came out in 1991. Many of the names he passed on are small pieces of poetry.
The morning star is named after the bright point of light you can see low in the sky just before sunrise. The idea is simple enough. It shows up at the darkest point of a downtrend, and it hints that daylight is on the way.
Its mirror image is the evening star, which forms at the top of an uptrend and warns that night is coming. Nison pointed to an evening star at the Dow’s high in the summer of 1987, before the October crash, which makes it probably the most famous star in the whole family.
What does each candle in a morning star tell you?
Every candlestick pattern is a picture of a crowd changing its mind. The morning star is one of the easier ones to read, because the change happens in three clear steps.

- The long red candle. Sellers are firmly in control. Price opens near the high and closes near the low, and anyone who bought recently can feel the fear setting in.
- The star. Price gaps lower, and then very little happens. The candle has a small real body, the part between the open and the close, which means buyers and sellers fought all session and ended roughly where they started. Nison called it “a stalemate in the tug of war”, and the colour of the star does not matter.
- The long green candle. Buyers arrive and push price back up hard, closing well into the body of the first red candle. Some of the people who sold near the low now feel regret, and some of them buy back in, which adds fuel to the move.
So the star is the moment the selling stalls, and the green candle is the evidence that something actually changed.
Do note that the candles never tell you why the crowd changed its mind, whether it was news, an earnings beat or plain exhaustion. They only show you that it happened.
How do you tell a real morning star from a fake one?
Run a scanner across a few hundred stocks and you will find rough morning stars almost every day. Most mean nothing. These checks sort the few worth a closer look.
- It comes after a real downtrend. A morning star in the middle of a sideways range has nothing to reverse, so it is just noise.
- The star’s body stays clear of the first body. Nison’s rule is that it is still a star as long as the two real bodies do not overlap. In stocks the bodies often touch, because a stock tends to open close to where it closed the night before, so a pattern without a clean gap is still worth a look.
- The third candle closes deep into the first. The deeper the green candle closes into the red one, especially on heavy volume, the stronger the signal.
- Volume tells the same story. Nison’s ideal is light volume on the first candle and heavy volume on the third, so the old selling force is fading as the new buying force grows.
- It sits on support. A morning star that forms on a previous low, a trendline or a major moving average has a reason to hold. One floating in open space has nothing underneath it.
When the star is a doji, a candle that opens and closes at almost the same price, it is called a morning doji star, and it is treated as the stronger signal. A doji that gaps away on both sides is an abandoned baby, rare enough that you could trade for years without seeing a clean one.
If spotting these by eye sounds like a lot of screen time, it does not have to be. My free 15-minute swing trader checklist is the short daily routine I use myself.
Is a morning star the same as a hammer?
They are different patterns, and I owe you an honest note here, because an older version of this very page mixed them up. It described a single candle with a small body and a long lower shadow, at least twice the length of the body, and that is the textbook description of a hammer.
A hammer tells the same story in one candle. Sellers push price far lower during the session, buyers fight back, and the candle closes near its high, which leaves that long shadow underneath. A morning star spreads it over three candles, so the selling, the stalemate and the buying each get a session of their own.
My own trading rules lean on the one-candle version. On 2 April 2026, in my weekly outlook, I told viewers we had just got into Dell. As I put it, “it actually held quite well right at this support level here with the pin bar.” A pin bar is a close cousin of the hammer. On the day I recorded, Dell opened lower anyway because the whole market was down, but by the next outlook on 7 April it had “gone up a bit”. I pointed out “one pin bar” followed by “one strong white bar”.
Strictly speaking, that is not a textbook morning star. But a reversal candle on support followed by a strong white bar is the same story with one fewer chapter, and in practice the story matters far more than the name.
How do you trade a morning star?
Say you have found one that passes the checks. There are two honest ways in, and each trades a better price against a safer signal.
| Entry | What you do | Trade-off |
|---|---|---|
| On the pattern | Buy as the third candle closes | Better price, more false signals |
| On confirmation | Wait for one more bullish candle, such as a bullish engulfing, before buying | Fewer false signals, a worse price, and you miss some moves |
My Bounce setup, where I buy a sharp drop into support, leans on reversal candles like this one.
Whichever entry you take, the stop goes just below the star’s low. If price falls back under it, the idea that buyers took control has failed, and the stop gets you out while the damage is still small.
Now suppose the star’s low sits 4% below your entry, and the next resistance level, a previous high where sellers stepped in before, sits 8% above it. Your risk is 4% and your potential reward is 8%, so the trade offers 2R, which means two units of reward for each unit of risk. If that resistance sits only 2% above your entry, the same three candles now offer 0.5R, and no candle in the world is pretty enough to make that a good trade.
For the exit, sell at that resistance or trail a stop under price and let a strong move run. Decide which before you enter, while you are still calm.
When does the morning star fail?
In December 2025, a trader on Reddit’s r/Daytrading asked a question I hear a lot. They already traded support and resistance, and wanted to know if candlestick patterns added anything: “Do they hold significance or is it just another confluence to determine a trade?”
Personally, I think the second half of that question is closer to the truth, and I do not mean it as an insult to the pattern. A morning star on its own only tells you that a crowd stalled and turned over three sessions. On a support level after a sharp fall, it tells you the turn happened at a price where buyers have shown up before. That combination is what I trade.
Two failures come up more than any others. The first is the downtrend that simply resumes, because the pattern raises the odds of a turn without promising one, and a strong downtrend can print a perfect morning star and then keep on falling for weeks. That is why the stop under the star is the rule I never skip.
The second is the choppy market. When price is moving sideways, small bodies and quick bounces are everywhere, and most of them are noise that only looks like a signal. With no trend to reverse, the pattern has nothing to say.
I have my own dated reason to be careful here. In June 2026 I backtested my four swing setups, and Bounce, the one built on reversal candles at support, came last. It stays on a short leash until a larger sample earns it back.
RSI divergence makes the case stronger still. RSI, the relative strength index, is a momentum gauge. Bullish divergence is when price makes a lower low while the RSI makes a higher low, so the selling is losing force before the candles show it.
It works upside down too. On 12 March 2026 I pointed out in my outlook that the US dollar had printed three pin bars, trying three times to push through its 100-day moving average and failing each time, right where an old resistance sat. The shadows were the same, and so was the lesson, only upside down.
Reading candles well is mostly a habit of checking the same few things every day, and the free 15-minute swing trader checklist is how I keep that habit.
FAQ
Is the morning star bullish or bearish?
The morning star is a bullish reversal pattern. It forms at the bottom of a downtrend. Its mirror image, the evening star, is the bearish version that forms at the top of an uptrend.
How many candles make a morning star?
Three. A long bearish candle, then a small-bodied star that gaps lower, then a long bullish candle that closes well into the body of the first.
Where do you put the stop loss on a morning star?
Just below the low of the star. If price trades back under it, the reversal has failed.
Is the morning star pattern reliable?
It holds up far better after a clear downtrend, on support and with heavy volume on the third candle. In sideways markets it throws many false signals.
What is a morning doji star?
A morning star whose middle candle is a doji, which opens and closes at almost the same price. It is treated as the stronger signal.
What is the difference between a morning star and a hammer?
A hammer is a single candle with a small body and a long lower shadow. A morning star tells the same bullish story over three candles.
Which do you find harder, spotting a real morning star or holding your stop when it fails? And have you ever bought one in the middle of a range by mistake? Let me know in the comments.
If you want every candlestick pattern explained in one place, read The Definitive Guide to Candlestick Patterns. The single-candle version of this story is the hammer candlestick pattern, the usual confirmation candle is the bullish engulfing pattern, and the bearish mirror is the evening star pattern. For the wider picture, start with my free trading guides.

If you would like to learn more about all the different candlestick patterns, also check out: “The Definitive Guide to Candlestick Patterns”
And if you want a routine that finds these setups without hours at the screen, grab the free 15-minute swing trader checklist.
About the author. Spencer Li is The 15-Minute Trader and the founder of Synapse Trading. He is a Certified Financial Technician (CFTe) with 15+ years of trading, run from 70+ countries. He holds a B.Acc and B.BM from SMU. Every trade he takes is public, dated, losses left in. He teaches low-risk swing trading in 15 minutes a day, one system for any market.
Education, not financial advice. Synapse Trading is not licensed by MAS to advise on investment products. Trading carries risk of loss, and past performance is not indicative of future results.
Want the daily routine? Enter your email for the free 15-Minute Swing Trader's Checklist.
Free 5-page PDF, then occasional trading emails. Education only, not financial advice. Unsubscribe anytime. Kit stores your email in the US: see our privacy policy.
Want to learn the full method? The Trading Mastery Program teaches the 4 strategies I have traded since 2011. It suits beginners and experienced traders.
Rather follow the trades as they happen? Daily Trading Signals is our Telegram channel: my trade ideas with entry, stop and exit, and every trade is public.
Questions about this post? Ask in the free Telegram channel →
Educational content only, not personalised financial advice. Trading carries risk, including loss of capital. Past performance is not indicative of future results. Synapse Trading is not licensed or regulated by MAS.

