

Bullish Abandoned Baby
Want the daily routine? Get the free 15-Minute Swing Trader’s Checklist. Get it free →
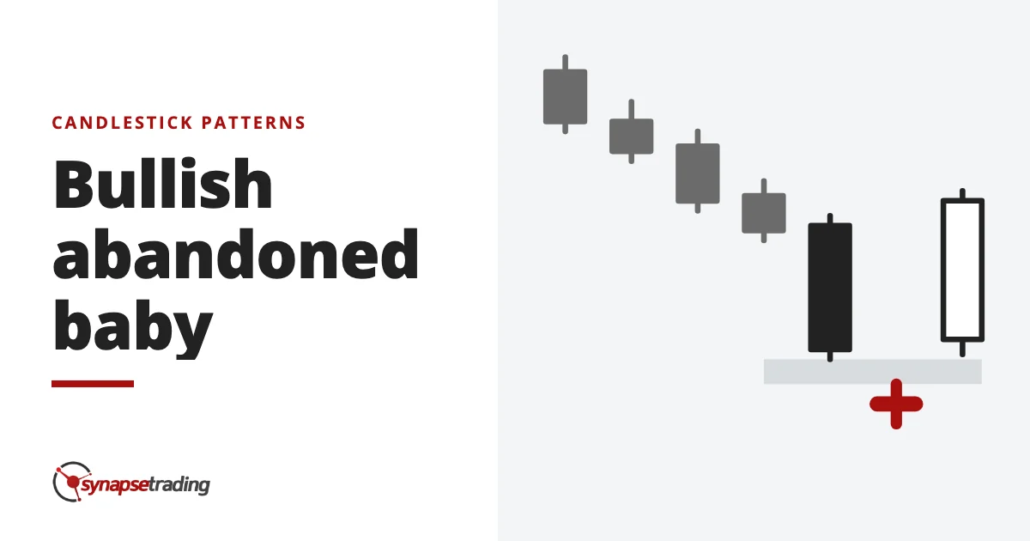
The bullish abandoned baby is a type of candlestick pattern that is used by traders to signal a reversal of a downtrend.
It forms in a downtrend and is composed of three price bars.
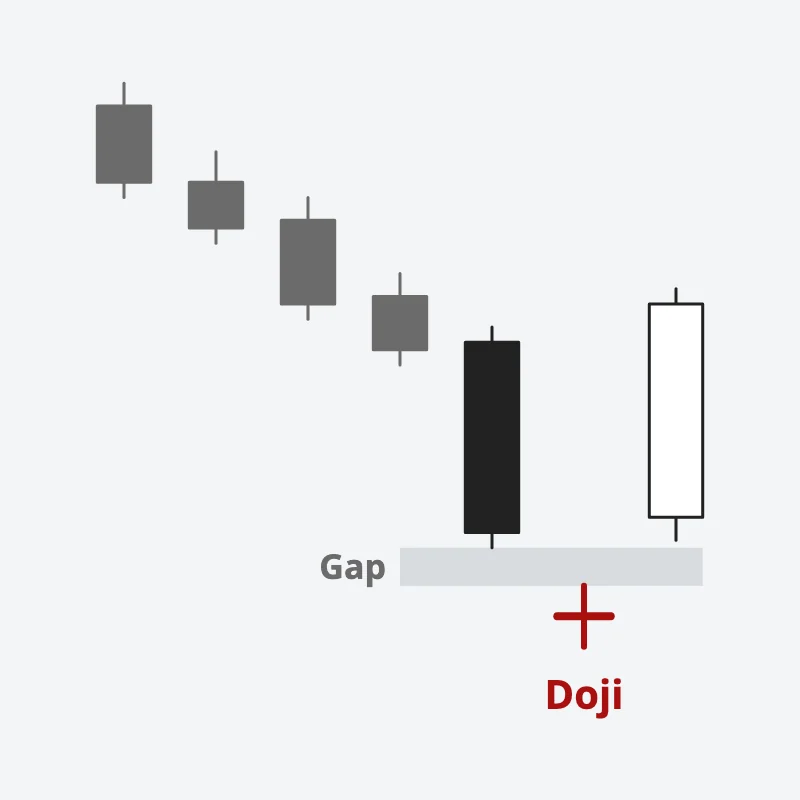
The first is a large down candle, followed by a doji candle that gaps below the first candle.
The next candle opens higher than the doji and moves aggressively to the upside.
The expectation is that the price will continue to move higher as the pattern shows that selling has been at least temporarily exhausted.
The bullish abandoned baby can be contrasted with a bearish abandoned baby pattern, which marks the possible end of an uptrend.
Understanding the Bullish Abandoned Baby
Traders watch for bullish abandoned baby patterns to signal the potential end of a downtrend.
The pattern is fairly rare as the price movements need to meet specific criteria in order to create the pattern.
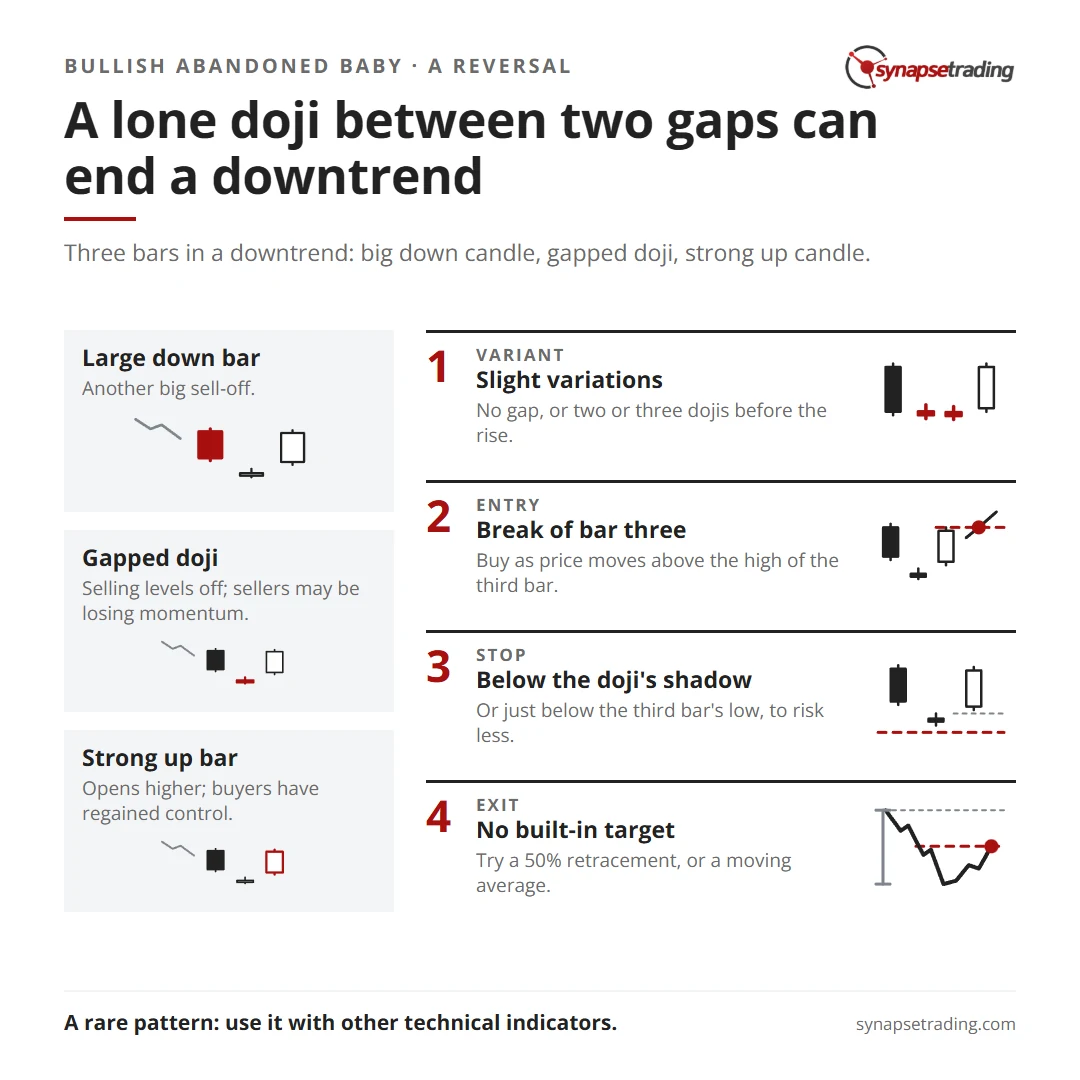
- The first bar is a large down candlestick located within a defined downtrend.
- The second bar is a doji candle (open is approximately equal to the close) that gaps below the close of the first bar.
- The third bar is a large white candle that opens above the second bar.
The psychology or idea behind the pattern is that the price has been dropping aggressively and just had a big sell-off again (first down candle).
The price then forms a doji, which shows selling is leveling off as the open and close prices of the doji are nearly the same.
Dojis are commonly associated with indecision.
In this case, the doji means that sellers may be losing momentum and buyers are starting to step in.
The doji, or dojis, are followed by a strong advancing candle that typically gaps higher from the doji.
This shows that buyers have regained control and that the selling has at least temporarily been exhausted.
Traders may manually search for the bullish abandoned baby or trade it when they see it, but they can also scan for the pattern using trading software.
Special Considerations
Some traders will allow for slight variations.
For example, the doji may not gap below the close of the first candle, instead opening near the prior close and staying there.
Sometimes there are two or three dojis before the price makes its upward move.
This would be acceptable to some traders since the pattern is still showing a drop, a leveling off, and then a sharp rise.
Trading the Bullish Abandoned Baby
While there are multiple ways to trade the bullish abandoned baby pattern, here are some general ideas on how to do it.
Entry: Some traders enter on a break above the third bar in the pattern using a stop-limit order. The expectation is that the price will continue to move higher, so if it does, by moving above the high of the third bar, this could be used as a buying opportunity.
Stop-Loss Order: To avoid getting stopped out prematurely, traders could place a stop-loss order below the lower shadow of the bullish abandoned baby bar (doji). Traders who would like to risk less could place a stop-loss order just below the low of the third bar in the pattern. Increased volatility often accompanies trend reversals. Keep this in mind when selecting a stop-loss location.
Profit Target: The pattern does not have a profit target. Some other exit method will need to be used to realize any profit that may occur. A profit target at a Fibonacci retracement level could be used. For example, traders might set a profit target at a 50% retracement of the downtrend that preceded the bullish abandoned baby pattern.
Other options may include setting a target at a fixed risk/reward ratio. For instance, if risking $500, set a profit target at a $1,000 or $1,500 gain. A trader could also use technical indicators or exit when the price drops below a chosen moving average.
Example of a Bullish Abandoned Baby
The bullish abandoned baby is fairly rare since its pattern has strict requirements.
Some traders allow the restrictions to be relaxed slightly, which means more patterns will be found, and the results can still be quite good.
A few variations of the pattern formed in Macy’s Inc.
After the price declined, on a number of occasions it formed a bullish abandoned baby bottom.
These patterns were followed by strong moves to the upside.
Pattern one is a slight variation of the traditional pattern, as the doji doesn’t gap below the prior close, and there are two dojis. Yet the sentiment of the pattern still shows a bullish shift. The pattern has a strong drop, indecision and leveling off, and then a strong surge higher after the dojis.
Pattern two is more traditional, except there are once again two dojis. This is acceptable, and the price shot higher following the pattern.
Pattern three is also a slight variation, as the doji didn’t gap below the prior candle’s close. The price moved higher following the doji, though, and an uptrend commenced.
Similar Patterns
Both the bullish and bearish abandoned baby patterns are similar to the evening star and morning star formations.
The difference that makes the abandoned baby patterns so rare is the occurrence of the doji candle with a gap on either side.
The evening star and morning star formations do not require the middle candle to be a doji or to have gaps on either side.
Concluding Thoughts
The bullish abandoned baby is a rare and significant pattern that signals the potential end of a downtrend and the start of a bullish reversal.
Traders need to be aware of the strict criteria required for this pattern and may need to adapt their strategy to allow for slight variations.
As with all trading patterns, it’s essential to use the bullish abandoned baby in conjunction with other technical indicators and trading strategies to maximize the chances of success.
Want the daily routine? Enter your email for the free 15-Minute Swing Trader's Checklist.
Free 5-page PDF, then occasional trading emails. Education only, not financial advice. Unsubscribe anytime. Kit stores your email in the US: see our privacy policy.
Want to learn the full method? The Trading Mastery Program teaches the 4 strategies I have traded since 2011. It suits beginners and experienced traders.
Rather follow the trades as they happen? Daily Trading Signals is our Telegram channel: my trade ideas with entry, stop and exit, and every trade is public.
Questions about this post? Ask in the free Telegram channel →
Educational content only, not personalised financial advice. Trading carries risk, including loss of capital. Past performance is not indicative of future results. Synapse Trading is not licensed or regulated by MAS.

