

Evening Star Candlestick Pattern: How to Spot a Fading Rally and Protect Your Gains
Want the daily routine? Get the free 15-Minute Swing Trader’s Checklist. Get it free →
By Spencer Li, CFTe · Last updated: 11 August 2026
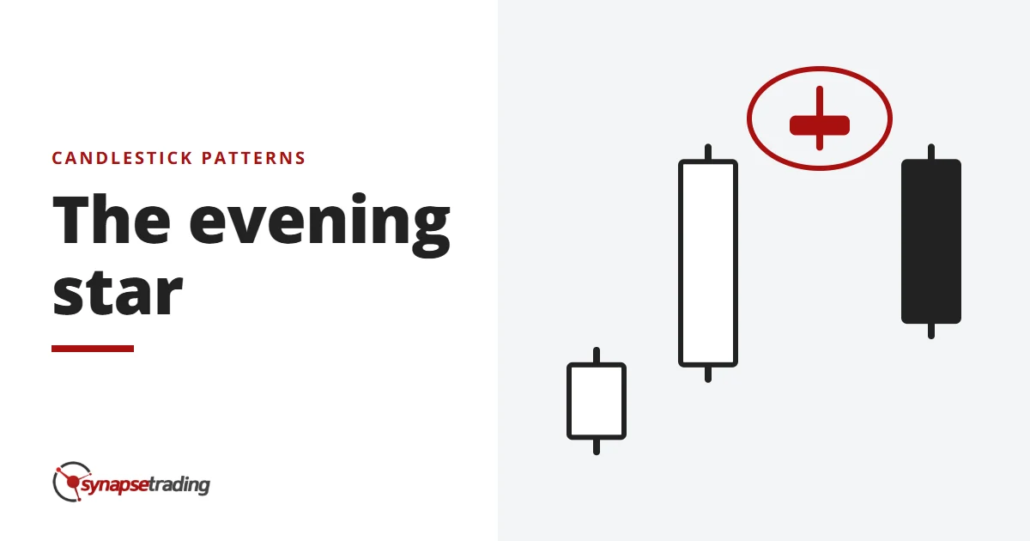
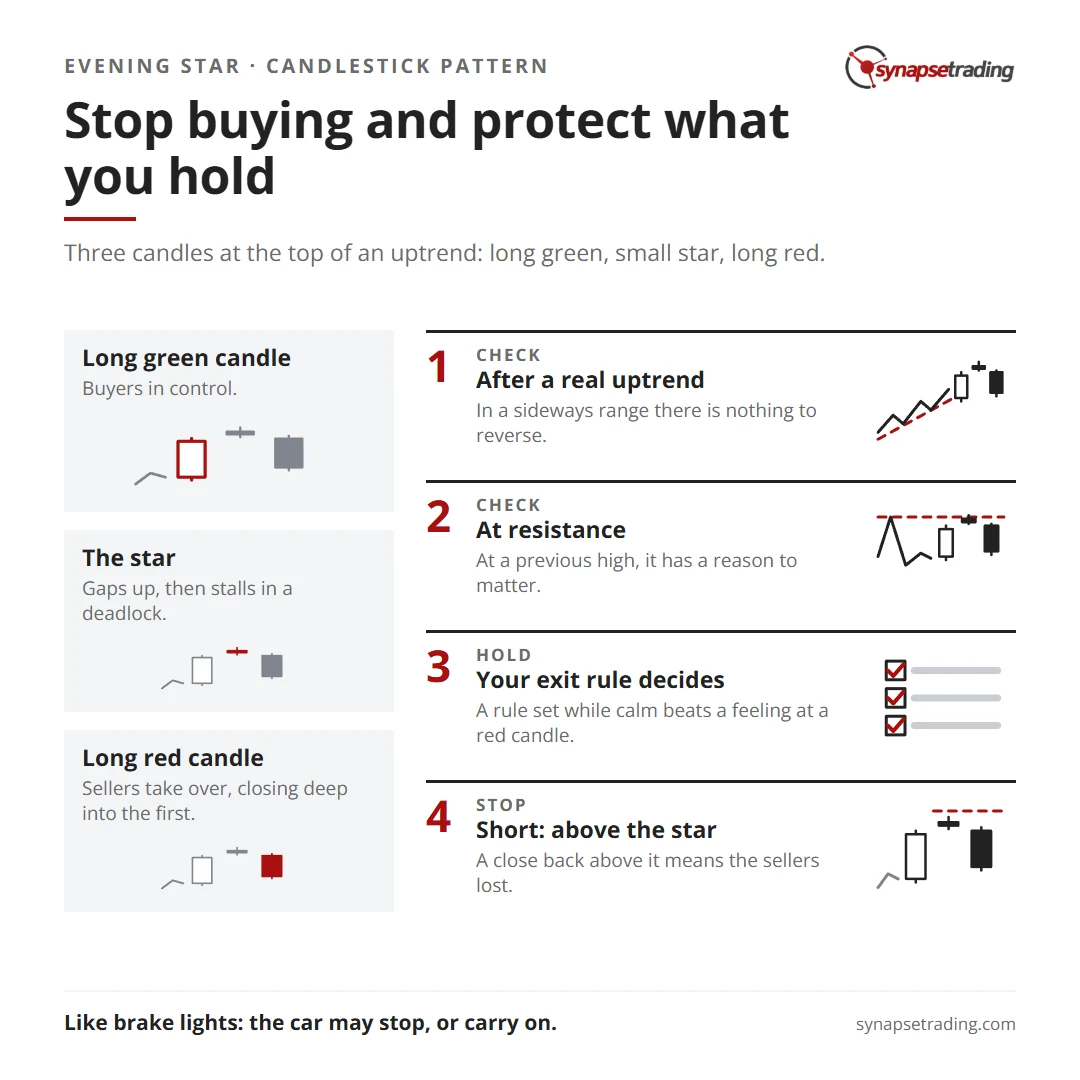
The evening star candlestick pattern is a three-candle bearish reversal pattern that forms at the top of an uptrend. First comes a long green candle, then a small-bodied candle called the star that gaps higher, and then a long red candle that closes deep into the body of the first one. Read together, the three candles show buyers in control, then buyers stalling, and then sellers taking over, which is why traders treat it as an early warning that a rally may be ending.
Traders who short it usually sell as the third candle closes, with a stop just above the high of the star, and it means the most after a clear uptrend, at a level where sellers have turned price back before.
Most swing traders buy far more often than they sell short, and I am one of them. So for most of us the evening star is less an invitation to short and more a reason to stop buying and protect what we already hold.
Why did Nison compare the evening star to a traffic light?
Steve Nison, whose 1991 book Japanese Candlestick Charting Techniques introduced candlesticks to most Western traders, compared this pattern to a traffic light. The first candle is green, so traffic keeps moving. The star is the yellow light, when everyone eases off and nobody is sure whether to go. The red candle is the red light.
The name comes from the evening star, the bright point of light low in the sky just after sunset. Nison also pointed to an evening star at the Dow’s summer-1987 high, before the crash, which is about as dark a sunset as a chart can give you.
The traffic light puts your attention on the middle candle, which is where the crowd actually changes its mind. The red candle only confirms it.
Does an evening star mean the price will fall?
It means the uptrend is likely to change, which is a smaller claim than it sounds. Nison made the point that the name “reversal pattern” is a little misleading, and he likened it to the brake lights of the car in front of you coming on. The car may stop, or it may slow down and then carry on. The brake lights cannot tell you which.
So after an evening star, price can fall hard, but it can also drift sideways for weeks, and for someone already holding the stock, both outcomes say much the same thing. The easy part is probably over.
What does each candle tell you about the crowd?
Imagine you have watched a stock climb for six weeks, and you finally give in and buy it.
- The long green candle. The rally still looks healthy. Price opens near the low and closes near the high, and the people who bought earlier feel quite pleased with themselves. Greed is very easy at this stage.
- The star. Price gaps up the next morning, which feels like confirmation, and then goes nowhere. The candle has a small real body, the part between the open and the close, because buyers and sellers fought all session and ended roughly where they started. Nison called it “a deadlock between the buying and selling forces”, and its colour does not matter.
- The long red candle. Sellers push price down hard, and it closes well into the body of the green candle. Everyone who bought the gap is now sitting on a loss, and the fear sets in, because many of them will sell the moment price returns to where they got in.

That is why, as Nison noted in his second book, Beyond Candlesticks, an evening star can later act as resistance. The people trapped near the top would be relieved just to break even, and when price comes back, they sell into it.
What did the QQQ show me in November 2025?
The cleanest recent example I have on record is not a textbook evening star, and I think that makes it more useful.
On 29 October 2025, the Fed cut rates by a quarter point and the market rallied for a bit, and then earnings did not turn out that well and stocks slipped into a correction. In my weekly outlook on 5 November, I pulled up the daily chart of the QQQ, the ETF that tracks the Nasdaq-100.
Prices had been heading up for a few days. Then came a day that was, as I put it, “like a bit of a doji”, a candle that opens and closes at almost the same price, which I read as indecision. The next day, the market “closed below the low of the doji”, and that was the first real confirmation of the correction.
I also noticed that the high of the move never got above the previous high, and with most of the major companies already reported, everything felt quite expensive and no fresh catalyst was left to push prices higher.
A textbook evening star would have a long green candle and a clean gap. The QQQ gave the same story with rougher edges. That is the version real markets usually hand you.
If reading candles like this sounds like a lot of screen time, my free 15-minute swing trader checklist is the short daily routine I use myself.
How do you tell a real evening star from a lookalike?
Gregory Morris, author of Candlestick Charting Explained, describes an earlier warning that he calls the Deliberation pattern, a run of rising white candles where the last one is small, which can come before “a possible Evening Star pattern”. The stall often starts early.
These checks sort the real ones from the noise.
- It follows a real uptrend. In the middle of a sideways range there is nothing to reverse.
- The star gaps above the first body. In stocks the bodies often touch, since a stock tends to open near the previous close.
- The red candle closes deep into the green one. Morris’s rule of thumb is that the deeper it closes, especially on heavy volume, the stronger the signal.
- It sits at resistance. An evening star at a previous high has a reason to matter.
- Momentum agrees. RSI, the relative strength index, is a momentum gauge. Bearish divergence is when price makes a higher high while the RSI makes a lower high, so the buying fades before the candles show it.
When the star is a doji, the pattern is called an evening doji star, and Nison treats it as the more potent version.
Is an evening star the same as a shooting star?
They are different patterns. A shooting star is a single candle with a small real body at the lower end of its range and a long upper shadow. Buyers pushed price up during the session, and sellers shoved it back down before the close.
If a guide tells you an evening star has an upper shadow at least twice the length of its body, it is describing a shooting star. An evening star spreads the same story over three candles. A shooting star can still appear as the middle candle of an evening star, and then the two warnings stack.
How do you trade an evening star?
That depends on whether you already hold the stock, which for me is usual. As at June 2026, my trade log held 450 closed trades since April 2024. 387 were long and 63 were short, so about 86% of the time I was on the buying side.
| If you are… | What the evening star changes | Where the decision comes from |
|---|---|---|
| Holding the stock | A poor moment to buy more, a good moment to check your stop | Your exit rule, set before you entered |
| Looking to short | A possible entry once the third candle closes | A stop just above the star’s high |
Personally, I do not sell a swing trade just because an evening star shows up. My exit rule is written down before I enter, and it follows the trend rather than any single candle. If the red candle also breaks that rule, the rule makes the call. If it does not, I keep holding. A rule I set while calm beats a feeling I get while staring at a red candle.
If you are shorting, the stop goes just above the star’s high, because a close back above it means the sellers have lost the argument.
Nison is clear that candles give no price targets, so the target comes from the chart. Suppose the star’s high sits 3% above your entry, and the next support, a previous low where buyers stepped in before, sits 9% below. You are risking 3% to make 9%, so the trade offers 3R, three units of reward for each unit of risk. Now suppose that support sits only 1.5% below. The same three candles offer 0.5R, and you would be risking a full unit to make half of one, which is a strange trade to take on purpose.
Most of this comes down to checking the same few things every day, and the free 15-minute swing trader checklist is how I keep that habit.
When does the evening star fail?
In February 2024, a trader on Reddit’s r/Daytrading posted a chart and asked what they had missed. They had entered after an evening star, and as they put it, “the evening star before my entry was at a key resistance level”.
I cannot see their chart, so I will not pretend to diagnose it, but the honest answer may be that they missed nothing. A pattern at resistance raises the odds of a turn without promising one, and a trader who checks every box can still get stopped out. That is what the stop is for.
Two failures come up more than any others. The first is the strong uptrend that shrugs the pattern off. A stock with real buying behind it can print a perfect evening star, pause for three days and then make a new high, which is the brake-lights problem Nison warned about.
The second is the sideways market. When price moves back and forth in a range, small bodies and sharp reversals are everywhere, and most of them mean nothing.
I have my own dated reason to be careful with the short side. In June 2026 I wrote a rule into my trading plan that shorts are hedges by default until the short side proves itself. An early backtest of my trend rules mirrored onto the short side went 69 test trades at a 32% win rate and lost about 0.23R per trade. That is one test of one version. But it is why I treat an evening star mostly as a warning to protect what I hold.
FAQ
Is the evening star bullish or bearish?
Bearish. It forms at the top of an uptrend. Its mirror image, the morning star, is the bullish version at the bottom of a downtrend.
How many candles make an evening star?
Three. A long bullish candle, a small-bodied star that gaps higher, then a long bearish candle that closes deep into the first body.
Where do you put the stop loss on an evening star?
Just above the high of the star. If price closes back above it, the reversal has failed.
Is the evening star pattern reliable?
It holds up best after a clear uptrend, at resistance, with heavy volume on the third candle. In sideways markets it throws many false signals.
What is an evening doji star?
An evening star whose middle candle is a doji, which opens and closes at almost the same price. Nison treats it as the stronger signal.
What is the difference between an evening star and a shooting star?
A shooting star is a single candle with a small body and a long upper shadow. An evening star tells the same bearish story over three candles.
When an evening star shows up on a stock you own, do you tighten the stop, sell or ignore it? And have you ever shorted one in the middle of a range and regretted it? Let me know in the comments.
For every pattern in one place, read The Definitive Guide to Candlestick Patterns. The bullish mirror is the morning star, the single-candle cousin is the shooting star, and the usual confirmation candles are the bearish engulfing pattern and the dark cloud cover. For the wider picture, start with my free trading guides.

If you would like to learn more about all the different candlestick patterns, also check out: “The Definitive Guide to Candlestick Patterns”
And if you want a routine that spots these warnings without hours at the screen, grab the free 15-minute swing trader checklist.
About the author. Spencer Li is The 15-Minute Trader and the founder of Synapse Trading. He is a Certified Financial Technician (CFTe) with 15+ years of trading, run from 70+ countries. He holds a B.Acc and B.BM from SMU. Every trade he takes is public, dated, losses left in. He teaches rules-based swing trading in 15 minutes a day, one system for any market.
Education, not financial advice. Synapse Trading is not licensed by MAS to advise on investment products. Trading carries risk of loss, and past performance is not indicative of future results.
Want the daily routine? Enter your email for the free 15-Minute Swing Trader's Checklist.
Free 5-page PDF, then occasional trading emails. Education only, not financial advice. Unsubscribe anytime. Kit stores your email in the US: see our privacy policy.
Want to learn the full method? The Trading Mastery Program teaches the 4 strategies I have traded since 2011. It suits beginners and experienced traders.
Rather follow the trades as they happen? Daily Trading Signals is our Telegram channel: my trade ideas with entry, stop and exit, and every trade is public.
Questions about this post? Ask in the free Telegram channel →
Educational content only, not personalised financial advice. Trading carries risk, including loss of capital. Past performance is not indicative of future results. Synapse Trading is not licensed or regulated by MAS.

