

Shooting Star Candlestick Pattern: How to Read a Failed Rally and Trade It Without Getting Faked Out
Want the daily routine? Get the free 15-Minute Swing Trader’s Checklist. Get it free →
By Spencer Li, CFTe · Last updated: 21 September 2026
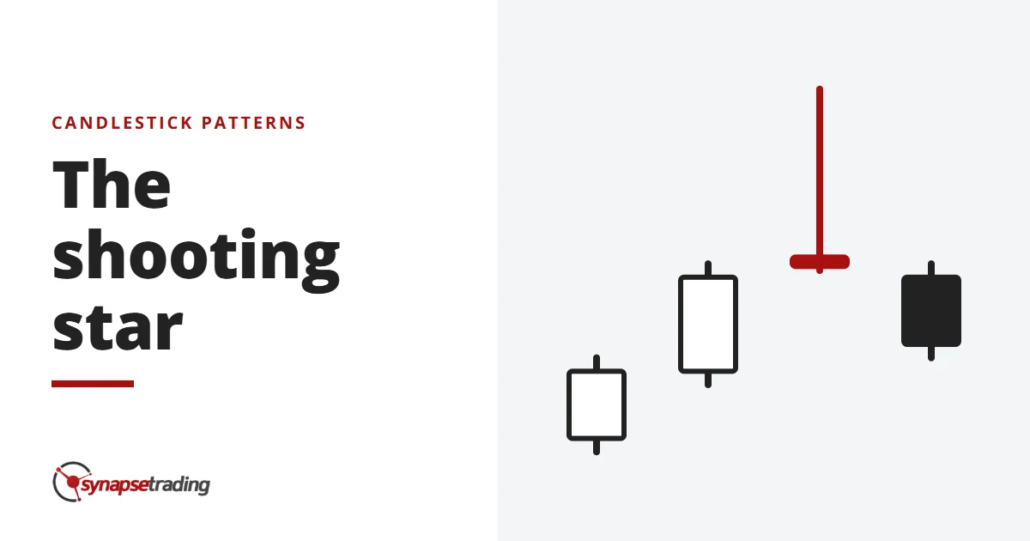
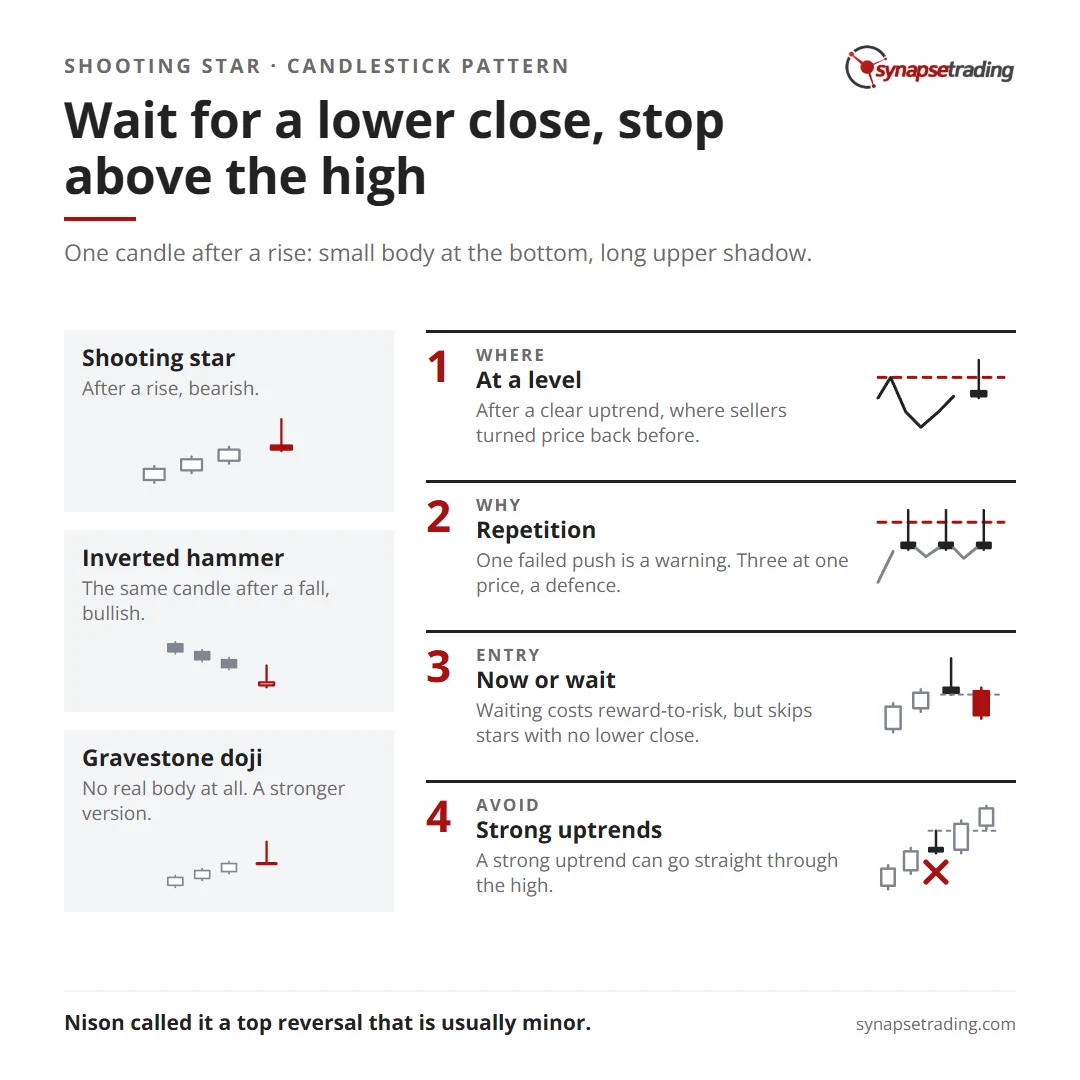
A shooting star is a single bearish candle that forms after a rise in price. Its real body, the part between the open and the close, is small and sits at the bottom of the session’s range. Above it is a long upper shadow, at least twice the height of the body. Below it there is little or none. The shape records a session in which buyers pushed price up hard, and sellers then shoved it all the way back down before the close.
Most traders treat it as a warning that the rally is running out of buyers, wait for the next candle to close lower before they act, and put the stop just above the shooting star’s high. It means the most after a clear uptrend, at a level where sellers have turned price back before.
Steve Nison, whose 1991 book Japanese Candlestick Charting Techniques introduced candlesticks to most Western traders, called the shooting star a top reversal that is usually minor. That one word, minor, is the most useful thing to know about this pattern.
Why is a shooting star the same candle as an inverted hammer?
If you cut a shooting star out of a chart and showed it to an experienced trader on its own, they could not tell you whether it was bearish or bullish.

The shooting star and the inverted hammer are exactly the same shape, a small body at the bottom of the range with a long shadow sticking up above it. The only difference Nison draws between them is where they appear. After a rise, the candle is a shooting star. After a fall, the very same candle is an inverted hammer, a possible bottom that still needs the next session to confirm it.
The same trick works with the shadow underneath, so the four best-known single candles are really two shapes with two names each.
| Long shadow above the body | Long shadow below the body | |
|---|---|---|
| After a rise | Shooting star, bearish | Hanging man, bearish |
| After a fall | Inverted hammer, bullish | Hammer, bullish |
So the hammer is the shooting star’s mirror image, and the candle that shares the hammer’s shape is the hanging man.
Colour matters less than people expect, because Nison says the colour of the real body is not important, and the candlestick course I took in Singapore back in 2009 taught it in either colour. A body so thin that the open and close are equal is another matter, because then the candle becomes a gravestone doji, a stronger version of the same signal. Nison passed on the Japanese image behind that name, the “graves of the bulls who died defending their territory”, which is about as dark as candlestick vocabulary gets.
What actually happens inside a shooting star?
Imagine a stock that has climbed for three weeks and is now pressing against a high it made a few months ago.
The session opens, buyers push through the old high, and for a few hours it looks like a breakout. Traders who were waiting for it buy, and short sellers who left their stops just above the old high get stopped out, so their forced buying lifts price a little further. Then the buying runs dry. Sellers who were waiting at that level start to unload, and price slides back down all afternoon.
Alan Farley, in The Master Swing Trader, described candles like this as fingers that “reach across well-marked S/R, clear out the stops, and then jump back”. The long upper shadow is the footprint of that round trip. Somebody paid for it.
Now think about the people who bought near the top of that shadow. They go home with a loss on day one, and the fear of losing more makes many of them sell the moment price climbs back to where they got in. That relief selling is why the high of a shooting star often acts as resistance later.
Is a shooting star a reversal signal?
In April 2024, a trader on Reddit’s r/technicalanalysis said they had been holding a stock on a flag pattern, and had just seen a shooting star on the chart. Their question was a fair one: “can this be understood as a reversal?”
I cannot see their chart, so I will not pretend to judge it. The general answer is that it can be. Usually it is not. A shooting star tells you the buyers failed once, at one price, in one session, which is a much smaller claim than saying the trend is over.
What turns the warning into something more is everything around it, and the course I took in 2009 put that as four steps, each one drilled on practice charts. There must be a prior uptrend of at least 5 days. The candle should form near support or resistance. Other signals should agree with it. And the next day should close lower, which is the day you act.
For someone already holding the stock, the useful question is what they will do if that lower close comes. It is far easier to answer with a stop already in place than with a shooting star on the screen and greed insisting the flag will still break out.
If you would rather do this kind of checking once a day than all day, my free 15-minute swing trader checklist is the routine I use myself.
What makes a shooting star worth trading?
On 12 March 2026, in my weekly outlook, I pulled up the chart of the US dollar against the Singapore dollar. When the US-Iran war broke out, the dollar had spiked as a safe haven, and now it was drifting back down. What I pointed out to viewers were three pin bars, “the three times that the market tried to push higher” through the 100-day moving average, and failed. They also lined up with a previous resistance level, so I said it did “kind of look bearish for the USD”.
Pin bar is the name I use in my own course for this family of candles, a long wick rejecting a level, with a small body that closes away from the wick. Pointed upwards, a pin bar is a shooting star. And that chart had the three things that make one worth trading.
- A level that matters. The candles formed at a moving average and an old resistance level, where sellers had a reason to wait.
- Repetition. One failed push is a warning. Three at the same price is a group of sellers defending it, and Nison wrote that a cluster of signals at one price can mark a “coup de grâce” top.
- A move to reverse. The dollar had just spiked, so the candles had something to push back against.
Then come the shape rules. They are simple. The upper shadow should be at least twice the body, the body should sit at the bottom of the range, and the lower shadow should be small or missing.
How do you trade a shooting star?
There are two entries, and the trade-off between them is one most guides skip.
The aggressive entry is to sell or short at the close of the shooting star itself, with the stop just above its high. The patient entry is to wait for the next candle to close lower, often as a bearish engulfing pattern or a dark cloud cover, and only then act.
The catch is that the shooting star’s best feature, the long upper shadow, is also the distance to your stop. Let me show you the arithmetic with round numbers.
Say the shooting star closes at 100, and its high is 104. Selling at the close, your stop sits about 4% above you. Say the next support, a previous low where buyers stepped in before, is at 88, which gives you 12% of reward against 4% of risk, a 3R trade, or three units of reward for each unit of risk.
Now suppose you wait, and the next day closes at 98. You have your confirmation, but your stop still has to sit above 104, which is now about 6% away, while your target at 88 is only about 10% away. The same setup now offers roughly 1.7R. Nothing about the candle changed.
Waiting cost almost half the reward-to-risk. What it buys you is a pass on every shooting star that never gets a lower close, the ones that would have stopped you out for a full loss. Which deal is better depends on how often your shooting stars fail, a number worth measuring in your own trade journal before trusting anyone else’s.
In my own course, the answer to “now, or wait for the candle to close?” is to wait for the signal bar. That goes double for a candle whose whole message is a wick.
Farley built one of his most specific setups around this candle and gave it a suitably dramatic name, the Death Star. Its signal is a shooting star that prints almost entirely outside the upper Bollinger Band, which marks how far price has stretched above its recent average. His exit rule is blunt. “Get out without hesitation when price just sits there or starts to whipsaw.” A shooting star is supposed to work quickly. One that just sits there is telling you the sellers never followed through.
Most of this comes down to checking the same few things every day, and the free 15-minute swing trader checklist is how I keep that habit.
When does a shooting star fail?
Candlestick patterns are surprisingly hard to test properly, and I have a dated example of my own. In my strategy test log, I first set Farley’s candle setups aside, with a note that “an ETF has no single earnings reaction to print a clean hammer”. On 6 August 2026, I moved them back into the queue to be tested on single stocks, and as at October 2026 they are still waiting, because a fair test needs minute-by-minute prices that I have not set up yet. So I cannot give you a tested hit rate of my own, and I would rather say so.
What I can tell you is where the pattern tends to let people down.
The first place is a strong uptrend, where a stock with real buying behind it can print a perfect shooting star, pause for a day, and then go straight through the high, taking every short seller’s stop with it.
The second is the sideways market, where long wicks and small bodies turn up every few days, and with no uptrend to reverse, the shape has very little to say.
The third is the gap. A shooting star that forms the day before an earnings report can be overruled overnight, and if price opens far above your stop, the order fills at the open, so a planned 1R loss can turn into two or three.
Do note that a shooting star and an evening star are different patterns. The evening star takes three candles to tell the same story, and when its small middle candle happens to be shaped like a shooting star, the two warnings stack.
FAQ
Is a shooting star bullish or bearish?
Bearish. It forms after a rise and warns that buyers failed to hold a push higher. Nison called it a top reversal that is usually minor.
What is the difference between a shooting star and an inverted hammer?
Both have a small body at the bottom of the range and a long upper shadow. After a rise it is a shooting star and bearish. After a fall it is an inverted hammer and bullish.
How long should the upper shadow of a shooting star be?
At least twice the height of the real body, with little or no lower shadow.
Where do you put the stop loss on a shooting star?
Just above the shooting star’s high, wherever you enter. A close back above it means the buyers who failed have won the second round.
What is the difference between a shooting star and a gravestone doji?
A gravestone doji opens and closes at the same price, so it has no real body at all. Nison treats it as a stronger version of the shooting star.
When a shooting star prints on a stock you own, do you tighten your stop, sell, or wait for the next close? And have you ever shorted one in a strong trend and watched it run straight through your stop? Let me know in the comments.
For every pattern in one place, read The Definitive Guide to Candlestick Patterns. The same candle after a fall is the inverted hammer, and its mirror image is the hammer. For the wider picture, start with my free trading guides.

If you would like to learn more about all the different candlestick patterns, also check out: “The Definitive Guide to Candlestick Patterns”
And if you want a routine that catches these warnings without hours at the screen, grab the free 15-minute swing trader checklist.
About the author. Spencer Li is The 15-Minute Trader and the founder of Synapse Trading. He is a Certified Financial Technician (CFTe) with 15+ years of trading, run from 70+ countries. He holds a B.Acc and B.BM from SMU. Every trade he takes is public, dated, losses left in. He teaches rules-based swing trading in 15 minutes a day, one system for any market.
Education, not financial advice. Synapse Trading is not licensed by MAS to advise on investment products. Trading carries risk of loss, and past performance is not indicative of future results.
Want the daily routine? Enter your email for the free 15-Minute Swing Trader's Checklist.
Free 5-page PDF, then occasional trading emails. Education only, not financial advice. Unsubscribe anytime. Kit stores your email in the US: see our privacy policy.
Want to learn the full method? The Trading Mastery Program teaches the 4 strategies I have traded since 2011. It suits beginners and experienced traders.
Rather follow the trades as they happen? Daily Trading Signals is our Telegram channel: my trade ideas with entry, stop and exit, and every trade is public.
Questions about this post? Ask in the free Telegram channel →
Educational content only, not personalised financial advice. Trading carries risk, including loss of capital. Past performance is not indicative of future results. Synapse Trading is not licensed or regulated by MAS.

