

Bullish Engulfing
Want the daily routine? Get the free 15-Minute Swing Trader’s Checklist. Get it free →
What Is a Bullish Engulfing Pattern?
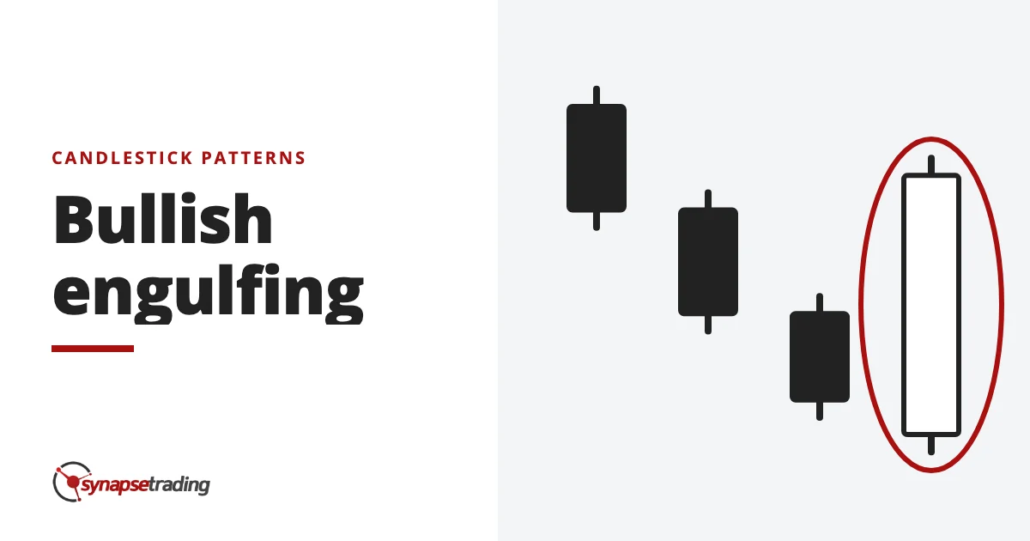
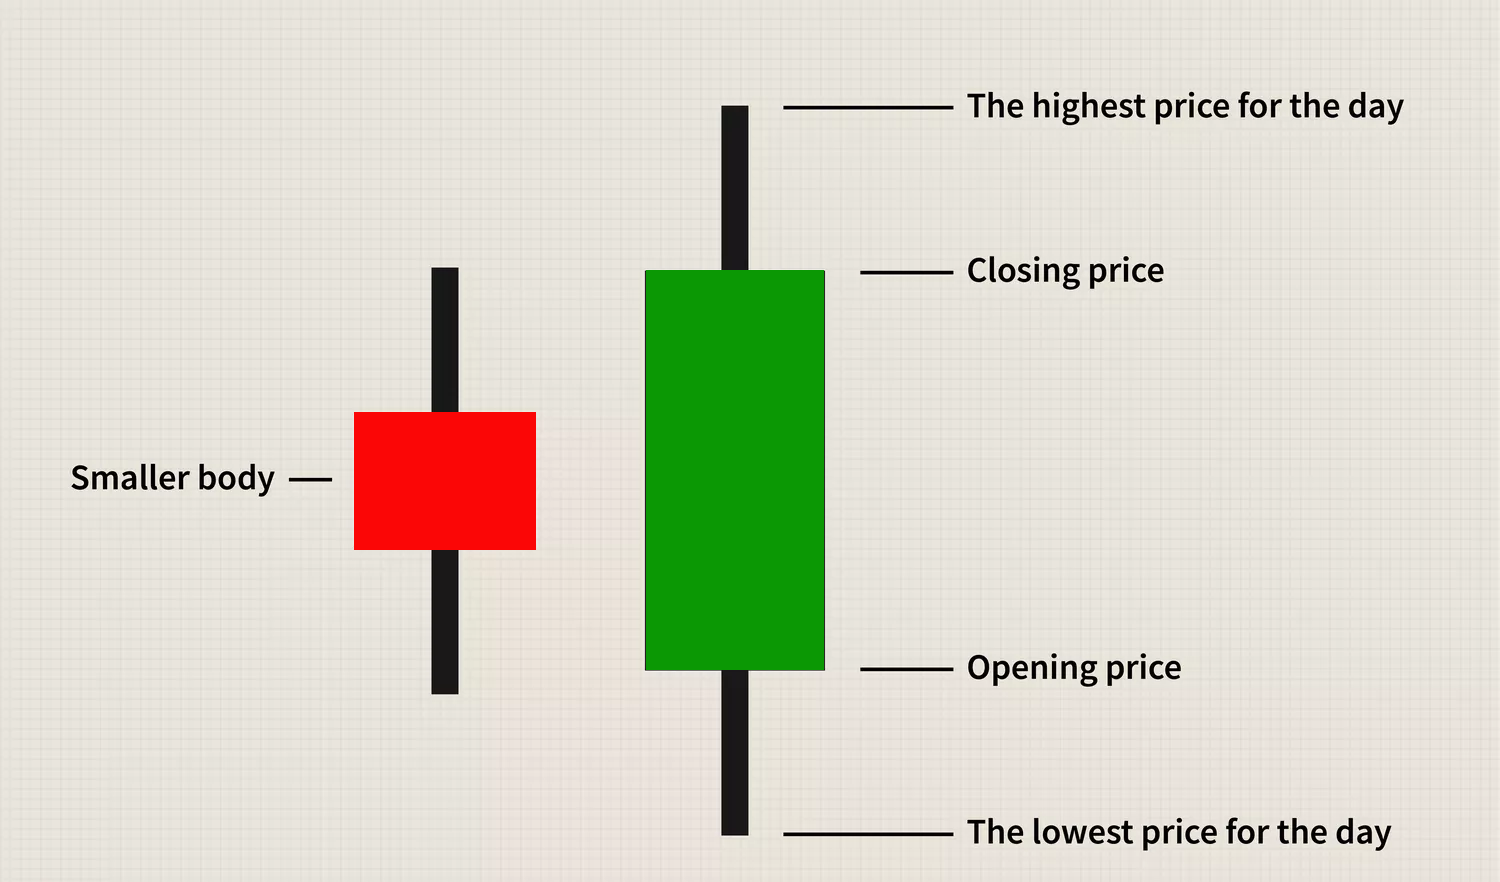
A bullish engulfing pattern is a white candlestick that closes higher than the previous day’s opening after opening lower than the previous day’s close.
It can be identified when a small black candlestick, showing a bearish trend, is followed the next day by a large white candlestick, showing a bullish trend, the body of which completely overlaps or engulfs the body of the previous day’s candlestick.
A bullish engulfing pattern may be contrasted with a bearish engulfing pattern.
Understanding a Bullish Engulfing Pattern
The bullish engulfing pattern is a two-candle reversal pattern.
The second candle completely ‘engulfs’ the real body of the first one, without regard to the length of the tail shadows.
This pattern appears in a downtrend and is a combination of one dark candle followed by a larger hollow candle.
On the second day of the pattern, the price opens lower than the previous low, yet buying pressure pushes the price up to a higher level than the previous high, culminating in an obvious win for the buyers.
What Does a Bullish Engulfing Pattern Tell You?
A bullish engulfing pattern is not to be interpreted as simply a white candlestick, representing upward price movement, following a black candlestick, representing downward price movement.
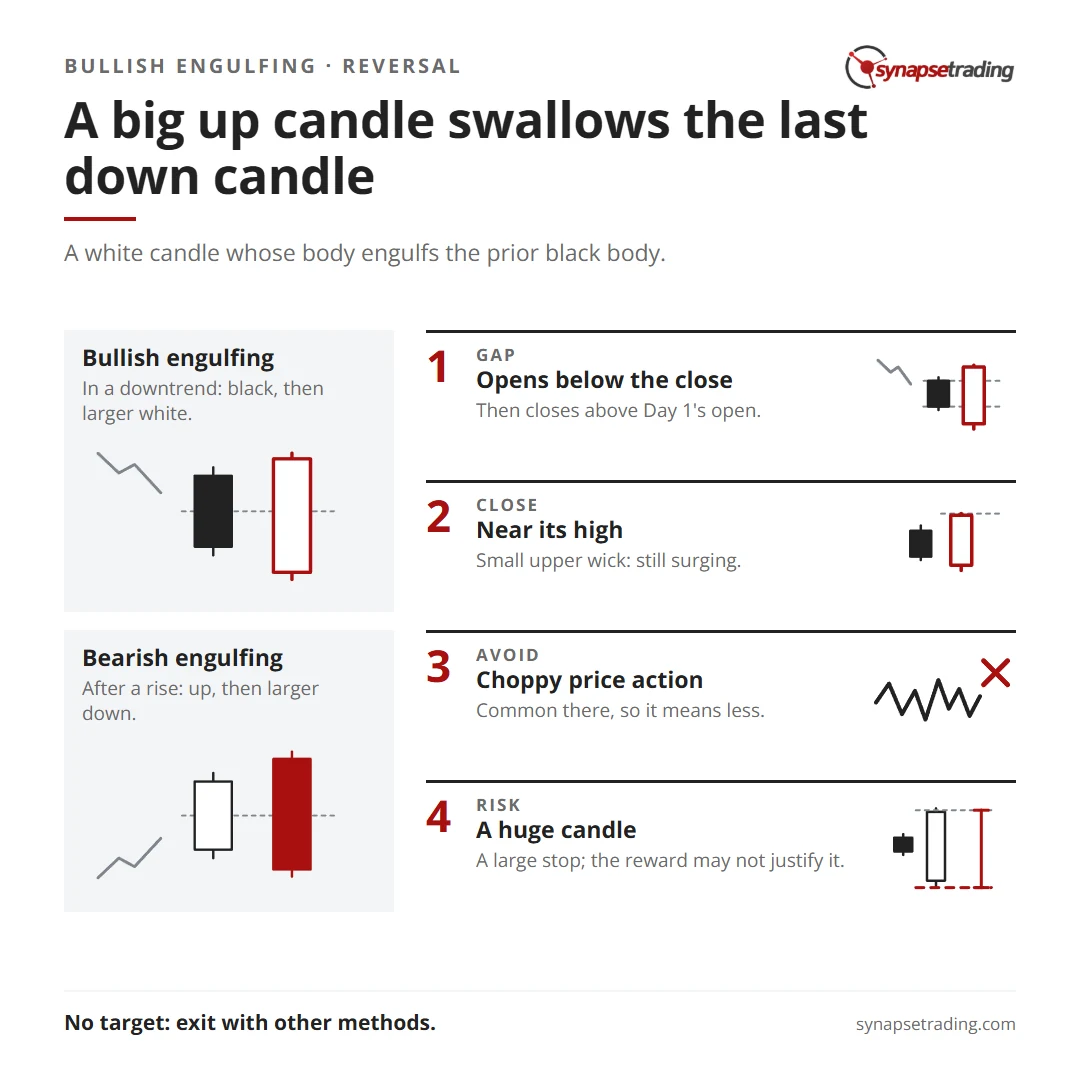
For a bullish engulfing pattern to form, the stock must open at a lower price on Day 2 than it closed at on Day 1.
If the price did not gap down, the body of the white candlestick would not have a chance to engulf the body of the previous day’s black candlestick.
Because the stock both opens lower than it closed on Day 1 and closes higher than it opened on Day 1, the white candlestick in a bullish engulfing pattern represents a day in which bears controlled the price of the stock in the morning only to have bulls decisively take over by the end of the day.
The white candlestick of a bullish engulfing pattern typically has a small upper wick, if any.
That means the stock closed at or near its highest price, suggesting that the day ended while the price was still surging upward.
This lack of an upper wick makes it more likely that the next day will produce another white candlestick that will close higher than the bullish engulfing pattern closed, though it’s also possible that the next day will produce a black candlestick after gapping up at the opening.
Because bullish engulfing patterns tend to signify trend reversals, analysts pay particular attention to them.
Bullish Engulfing Pattern vs. Bearish Engulfing Pattern
These two patterns are opposites of one another.
A bearish engulfing pattern occurs after a price moves higher and indicates lower prices to come.
Here, the first candle in the two-candle pattern is an up candle.
The second candle is a larger down candle, with a real body that fully engulfs the smaller up candle.
Limitations of Using Engulfing Patterns
A bullish engulfing pattern can be a powerful signal, especially when combined with the current trend; however, they are not bullet-proof.
Engulfing patterns are most useful following a clean downward price move as the pattern clearly shows the shift in momentum to the upside.
If the price action is choppy, even if the price is rising overall, the significance of the engulfing pattern is diminished since it is a fairly common signal.
The engulfing or second candle may also be huge.
This can leave a trader with a very large stop loss if they opt to trade the pattern.
The potential reward from the trade may not justify the risk.
Establishing the potential reward can also be difficult with engulfing patterns, as candlesticks don’t provide a price target.
Instead, traders will need to use other methods, such as indicators or trend analysis, for selecting a price target or determining when to get out of a profitable trade.
Concluding Thoughts
The bullish engulfing pattern is a widely recognized signal that can indicate a potential trend reversal.
However, it should not be relied upon in isolation.
Traders must consider the broader market context and use additional technical indicators to confirm the pattern’s validity.
While powerful, the pattern also comes with limitations, particularly in volatile markets where it may be less reliable.
Proper risk management and a clear exit strategy are essential when trading based on bullish engulfing patterns.
Want the daily routine? Enter your email for the free 15-Minute Swing Trader's Checklist.
Free 5-page PDF, then occasional trading emails. Education only, not financial advice. Unsubscribe anytime. Kit stores your email in the US: see our privacy policy.
Want to learn the full method? The Trading Mastery Program teaches the 4 strategies I have traded since 2011. It suits beginners and experienced traders.
Rather follow the trades as they happen? Daily Trading Signals is our Telegram channel: my trade ideas with entry, stop and exit, and every trade is public.
Questions about this post? Ask in the free Telegram channel →
Educational content only, not personalised financial advice. Trading carries risk, including loss of capital. Past performance is not indicative of future results. Synapse Trading is not licensed or regulated by MAS.

