

How to Combine Price Action with Multiple Timeframes: Read the Big Trend Before You Trade the Small One
Want the daily routine? Get the free 15-Minute Swing Trader’s Checklist. Get it free →
By Spencer Li, CFTe · Last updated: 26 October 2026
Combining price action with multiple timeframes means reading the same market on two charts, a slower one for the main trend and a faster one for the move happening now. You mark each one bullish or bearish from the price alone. When both charts agree, the trade is worth a closer look. When they disagree, you pass and wait. Back in 2018, I kept this in a simple Excel table, with the markets I follow down the side and the two charts across the top. It is still one of the quickest ways I know to scan a lot of markets in very little time.
In this post, I want to go through why the slower chart matters so much, how the table works, two real examples from March 2018, and the one that did not go to plan.
Why does the slower chart matter more?
In my weekly outlook on 24 March 2026, the headlines were changing almost every day, and plenty of viewers wanted to react to each one. My answer was that the “medium or long term trend doesn’t change every day”, while the “very short term or intra day trend” can “fluctuate a lot”.
This is why I look at more than one chart. A fast chart reacts to every headline, every large order and every rumour, so on its own it can look bullish on Monday and bearish by Wednesday. A slow chart is calmer, because it reflects the bigger shifts in buying and selling pressure that take weeks or months to change.
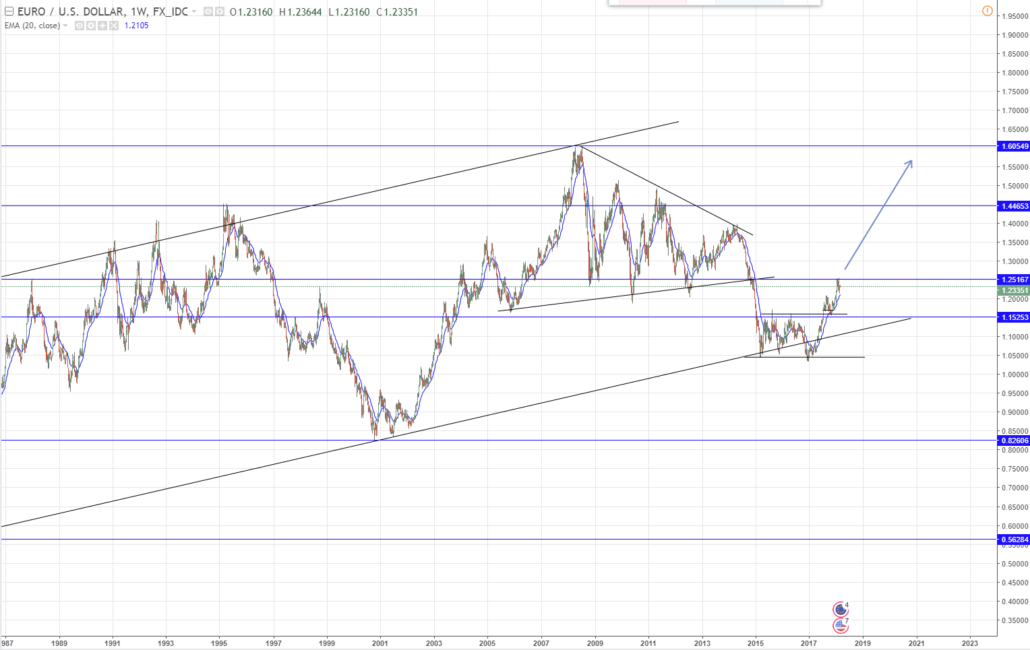
The EUR/USD on a slower chart in March 2018, where the main trend is easier to see.
Hence, I read the slower chart first. It tells me which way the current is flowing, and the faster chart only tells me whether this is a good moment to step into it.
Do note that “slow” and “fast” are relative. A long-term investor and a short-term trader will pick very different pairs of charts, and the right pair depends on how long you plan to hold a trade. What matters is the order. The big picture comes first, and the detail comes second. As I put it in my outlook on 18 December 2025, “it’s easier to look at the bigger picture first”, and then, “when the time comes to take the trade”, you “zoom in”.
How does the multi-timeframe table work?
The table is about as low-tech as trading tools get, which is part of why I like it.
- Rows are the markets you follow, such as currency pairs, stock indices, cryptocurrencies and commodities.
- Columns are your two charts, the slower one and the faster one.
- Cells hold one word each, bullish or bearish, based on the price action alone.
Price action here just means reading the chart itself, the highs, the lows and the direction they are stepping in, without leaning on indicators. If the highs and lows are stepping up, the cell says bullish. If they are stepping down, it says bearish.
The slower column barely changes, so it needs updating far less often than the faster one, and that split is what keeps the whole scan short.
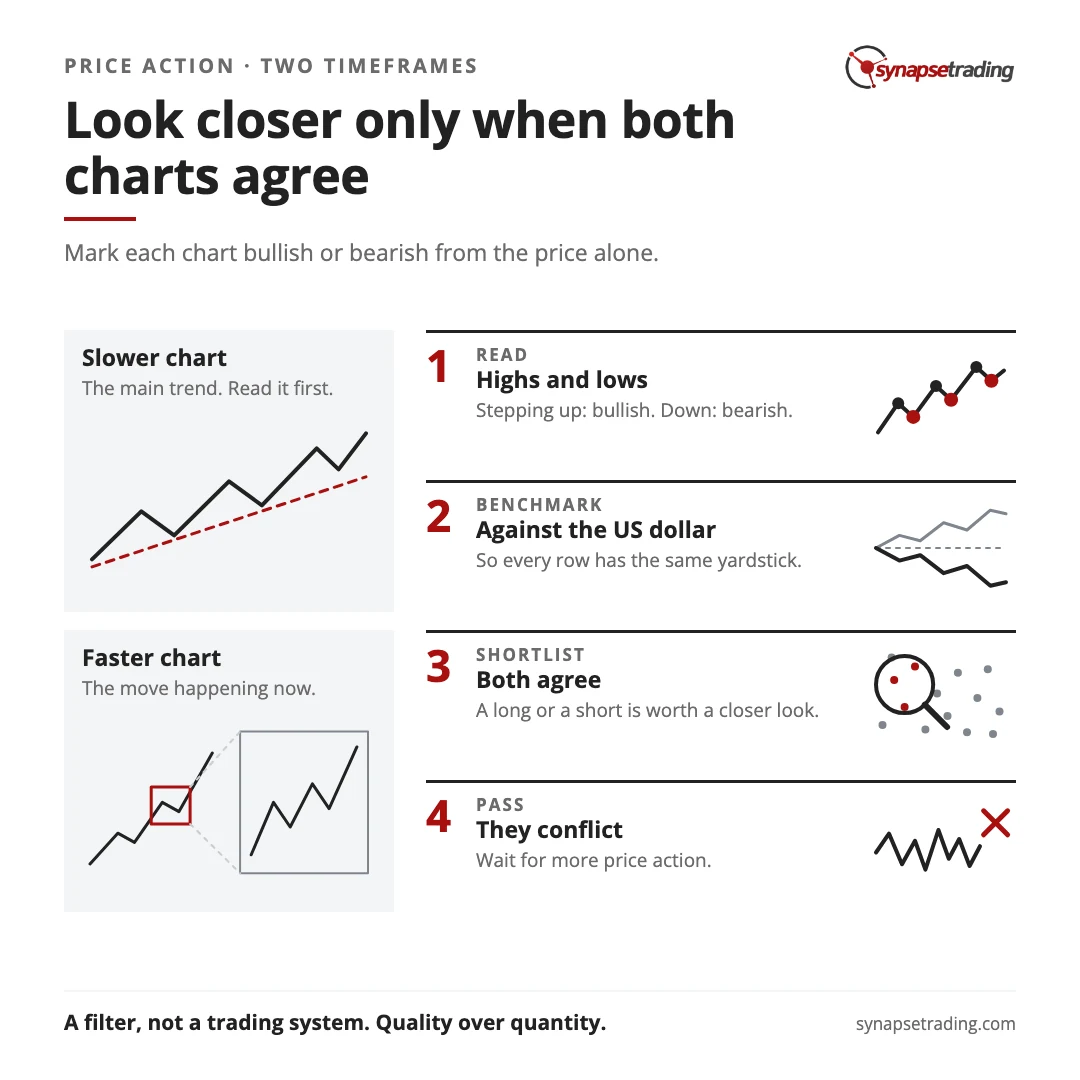
The two-chart table in four steps.
Then you read each row across. There are only three possibilities.
| Slower chart | Faster chart | What it tells you |
|---|---|---|
| Bullish | Bullish | Both agree, so a long is worth a closer look |
| Bearish | Bearish | Both agree, so a short is worth a closer look |
| One bullish, one bearish | They conflict, so you pass and wait for more price action |
The table does not tell you where to get in or where to get out. Its only job is to shrink a long list of markets down to the few where the charts agree, so your attention goes there first.
If you would like a daily routine that does this kind of filtering in very little time, my free 15-minute swing trader checklist is the one I use myself.
What does an aligned trade look like?
Here is the EUR/USD, the euro against the US dollar, as I charted it in early March 2018. On the faster chart, price had just finished a pullback and was turning back up, so I marked the euro bullish.

The EUR/USD on the faster chart in March 2018, just after a pullback.
On the slower chart, the euro was rebounding off a large trendline that stretched back decades. That was bullish too.
The EUR/USD on the slower chart in March 2018, rebounding off a long trendline.
So the row read bullish and bullish. Both charts agreed, and the EUR/USD went onto my short list as a long worth a closer look.
What happens when the timeframes disagree?
The S&P 500 told a different story that week. The long-term trend was still clearly up, but the short-term trend had turned down after the sharp sell-off in early February 2018.
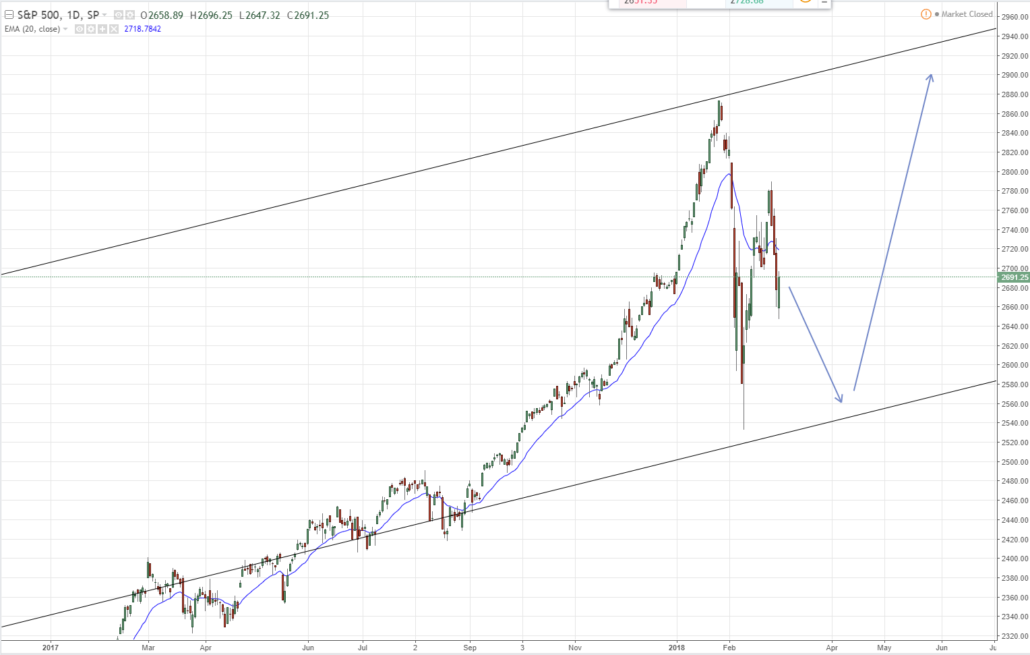
The S&P 500 in early March 2018, with the long-term trend up and the short-term trend down.
So the row read bullish and bearish, and I passed. As I wrote at the time, “The goal is to take the best trades, not take as many trades as possible. Quality over quantity.”
Looking back, passing was reasonable. From the close on that chart, the S&P 500 fell another 4.1% by 2 April 2018. It did not close above its January high again until 24 August 2018. Anyone who had bought because the long-term trend looked bullish would have sat through a fairly uncomfortable month first.
Does waiting for the timeframes to agree actually work?
On 19 March 2026, a trader on Reddit’s r/Daytrading described waiting for several timeframes to line up. They wrote, “To me it sounds right on Paper but it’s not working.”
They have a fair point, and my own EUR/USD example proves it. The row that read bullish and bullish in March 2018 did not deliver. The euro rose for about three more weeks, peaking on 27 March, and then turned. By the end of May 2018 it was 5.3% below where it stood on 5 March, and by mid-November it was down 8.8%.
So why bother? Medicine has a useful way of thinking about this. When a screening test comes back positive, a good doctor usually orders a second, different test before making a diagnosis, because two tests that agree are far more convincing than one. But that only works when the two tests can fail in different ways. Two copies of the same test agreeing tells you very little.
Two timeframes sit somewhere in between. The faster chart is literally part of the slower chart, so they are not fully independent witnesses. Agreement between them raises the odds, but it does not turn a guess into a certainty, and a market can line up on both charts and still reverse the very next month.
That is why the table is a filter rather than a trading system. It decides where I look, and the rest of the plan, including how much to risk and when to admit a trade is wrong, decides whether a bad month stays small. If you want the theory behind using more than one chart, I wrote a companion piece on how to use multiple timeframes in trading. The case for reading price before indicators is in the importance of price action.
The same filtering idea runs through my free 15-minute swing trader checklist, which keeps the daily routine short.
Why benchmark everything against the US dollar?
In the 2018 table, I benchmarked most markets against the US dollar, for easy comparison.
A table only works if “bullish” means the same thing in every row, so if one market is in euros, another in yen and a third in index points, you are comparing different things down one column. Pin them all to one yardstick, and a bullish cell in one row means what it means in the next.
It also shows you relative strength for free. When one currency is strong against the dollar and another is weak, the cross between them stands out, which is the same idea behind a currency strength meter.
FAQ
How do you combine price action with multiple timeframes?
Read the same market on a slower chart and a faster chart, and mark each one bullish or bearish from the price action alone. Give a trade a closer look only when both agree, and pass when they conflict.
Which timeframes should I use?
It depends on how long you plan to hold a trade. The slower chart should show the main trend and the faster chart the current move. The order matters more than the exact pair, so read the bigger picture first.
What should I do when the timeframes disagree?
Pass and wait for more price action. Conflicting charts mean the odds are muddy, and there are always other markets in the table where the charts agree.
Will a trade work if both timeframes agree?
Not always. In March 2018 my EUR/USD row read bullish on both charts, and the euro was 5.3% lower by the end of May. Alignment raises the odds, and risk control handles the trades where it fails.
Do I need indicators for this?
No. The method reads the highs and lows on the chart directly. A table and the charts themselves are enough.
Why benchmark against the US dollar?
So every row is measured with the same yardstick. It makes a currency pair, a stock index and a commodity comparable, and it shows you which currencies are strong and which are weak.
So that is how I combine price action with multiple timeframes, from the table to the trade that went wrong. Which charts do you pair up, and have you ever taken a trade that looked perfect on both and still failed? Let me know in the comments.
The same habit of checking the base rate before trusting a signal comes up in my look at the January Barometer, and my free trading guides cover the rest of the basics.
And if you want a routine that reads the bigger picture first without hours at the screen, grab the free 15-minute swing trader checklist.
About the author. Spencer Li is The 15-Minute Trader and the founder of Synapse Trading. He is a Certified Financial Technician (CFTe) with 15+ years of trading, run from 70+ countries. He holds a B.Acc and B.BM from SMU. Every trade he takes is public, dated, losses left in. He teaches rules-based swing trading in 15 minutes a day, one system for any market.
Education, not financial advice. Synapse Trading is not licensed by MAS to advise on investment products. Trading carries risk of loss, and past performance is not indicative of future results.
Want the daily routine? Enter your email for the free 15-Minute Swing Trader's Checklist.
Free 5-page PDF, then occasional trading emails. Education only, not financial advice. Unsubscribe anytime. Kit stores your email in the US: see our privacy policy.
Want to learn the full method? The Trading Mastery Program teaches the 4 strategies I have traded since 2011. It suits beginners and experienced traders.
Rather follow the trades as they happen? Daily Trading Signals is our Telegram channel: my trade ideas with entry, stop and exit, and every trade is public.
Questions about this post? Ask in the free Telegram channel →
Educational content only, not personalised financial advice. Trading carries risk, including loss of capital. Past performance is not indicative of future results. Synapse Trading is not licensed or regulated by MAS.

