

Dragonfly Doji
Want the daily routine? Get the free 15-Minute Swing Trader’s Checklist. Get it free →
What Is a Dragonfly Doji Candlestick?
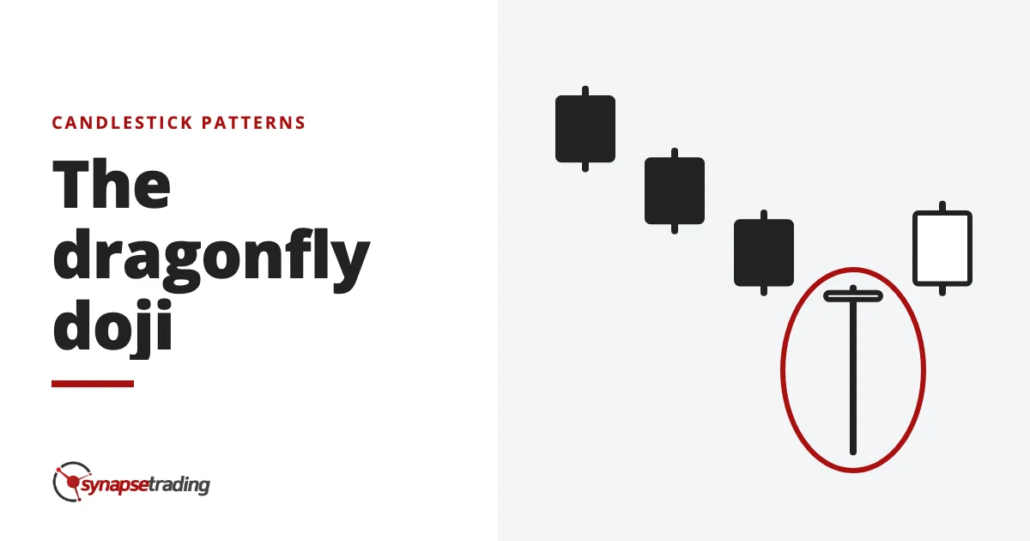
A Dragonfly Doji is a type of candlestick pattern that can signal a potential reversal in price to the downside or upside, depending on past price action.
It is formed when the asset’s high, open, and close prices are the same.
The long lower shadow suggests that there was aggressive selling during the period of the candle, but since the price closed near the open, it shows that buyers were able to absorb the selling and push the price back up.
Understanding the Dragonfly Doji Candlestick
A Dragonfly Doji can occur after a price rise or a price decline.
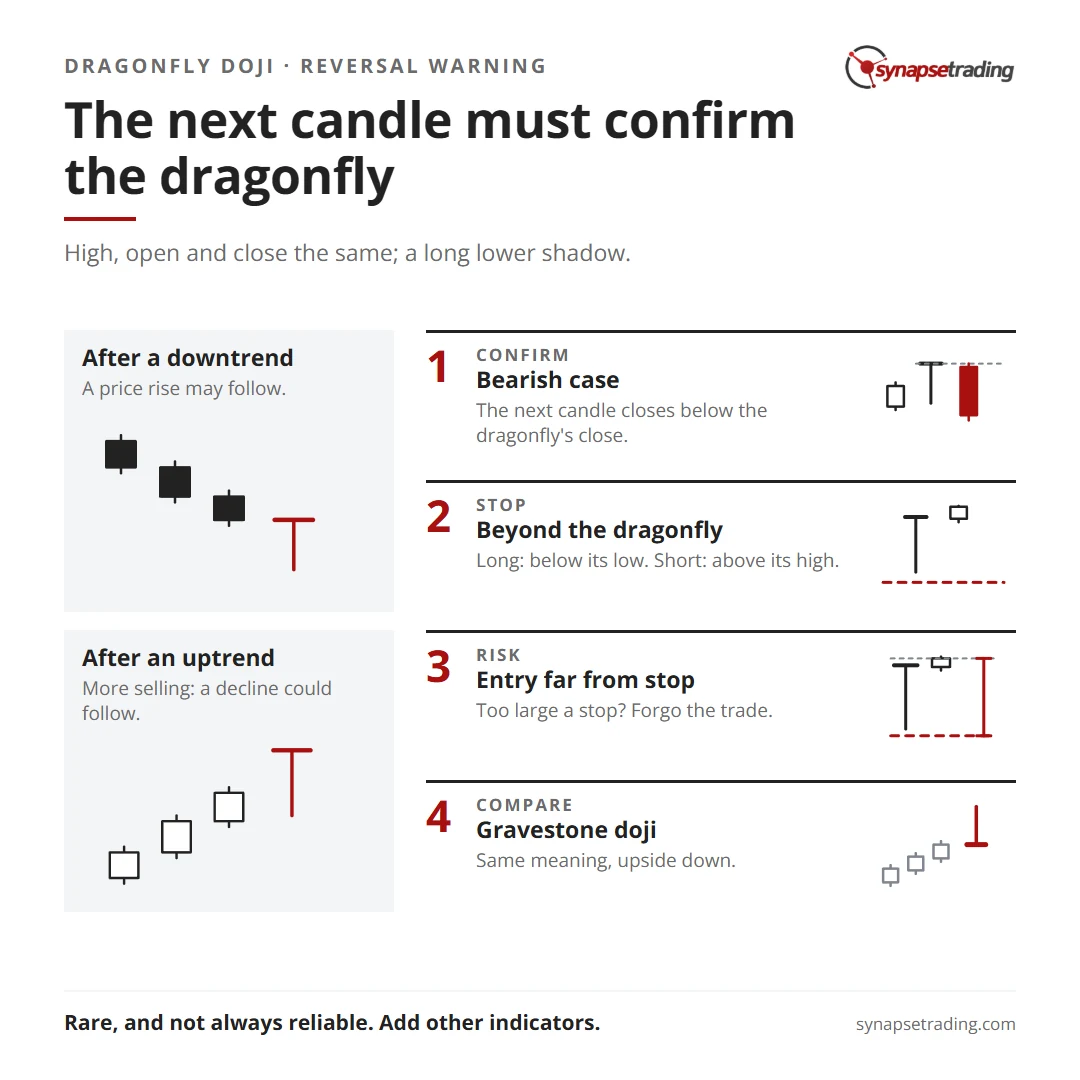
Following a downtrend, the dragonfly candlestick may signal a price rise is forthcoming.
Conversely, following an uptrend, it shows that more selling is entering the market, and a price decline could follow.
In both cases, the candle following the Dragonfly Doji needs to confirm the direction.
The Dragonfly Doji pattern does not occur frequently, but when it does, it is a warning sign that the trend may change direction.
Following a price advance, the dragonfly’s long lower shadow shows that sellers were able to take control for at least part of the period.
While the price ended up closing unchanged, the increase in selling pressure during the period is a warning sign.
The candle following a potentially bearish dragonfly needs to confirm the reversal by dropping and closing below the Dragonfly Doji’s close.
If the price rises on the confirmation candle, the reversal signal is invalidated as the price could continue rising.
Traders typically enter trades during or shortly after the confirmation candle completes.
If entering long on a bullish reversal, a stop loss can be placed below the low of the dragonfly.
If entering short after a bearish reversal, a stop loss can be placed above the high of the dragonfly.
Example of How to Use the Dragonfly Doji
Dragonfly dojis are very rare because it is uncommon for the open, high, and close to be exactly the same.
For example, a Dragonfly Doji may occur during a sideways correction within a longer-term uptrend.
In such a case, the dragonfly doji moves below the recent lows but then is quickly swept higher by the buyers, signaling that the price is likely to continue higher.
The example shows the flexibility that candlesticks provide.
The price might not be dropping aggressively coming into the dragonfly, but the price still drops and then is pushed back higher, confirming the price was likely to continue higher.
Looking at the overall context, the dragonfly pattern and the confirmation candle signaled that the short-term correction was over and the uptrend was resuming.
Dragonfly Doji vs. Gravestone Doji
A Gravestone Doji occurs when the low, open, and close prices are the same, and the candle has a long upper shadow.
The Gravestone Doji looks like an upside-down “T.”
The implications for the gravestone are the same as the dragonfly.
Both indicate possible trend reversals but must be confirmed by the candle that follows.
Limitations of Using the Dragonfly Doji
The Dragonfly Doji is not a common occurrence, and it is not a reliable tool for spotting most price reversals.
When it does occur, it isn’t always reliable either.
There is no assurance that the price will continue in the expected direction following the confirmation candle.
The size of the dragonfly coupled with the size of the confirmation candle can sometimes mean the entry point for a trade is a long way from the stop loss location.
This means traders will need to find another location for the stop loss, or they may need to forgo the trade since too large of a stop loss may not justify the potential reward of the trade.
Concluding Thoughts
The Dragonfly Doji is a unique and valuable candlestick pattern that can signal potential reversals in the market.
Its rarity and the significant meaning behind its formation make it a powerful tool for traders when it does appear.
However, due to its limitations and the potential for false signals, it is essential to use the Dragonfly Doji in conjunction with other technical indicators and confirmation candles to increase the likelihood of a successful trade.
Understanding the context in which the Dragonfly Doji forms, along with careful risk management, can help traders make more informed decisions when this pattern emerges.
Want the daily routine? Enter your email for the free 15-Minute Swing Trader's Checklist.
Free 5-page PDF, then occasional trading emails. Education only, not financial advice. Unsubscribe anytime. Kit stores your email in the US: see our privacy policy.
Want to learn the full method? The Trading Mastery Program teaches the 4 strategies I have traded since 2011. It suits beginners and experienced traders.
Rather follow the trades as they happen? Daily Trading Signals is our Telegram channel: my trade ideas with entry, stop and exit, and every trade is public.
Questions about this post? Ask in the free Telegram channel →
Educational content only, not personalised financial advice. Trading carries risk, including loss of capital. Past performance is not indicative of future results. Synapse Trading is not licensed or regulated by MAS.

