Spinning Top
Join our Telegram channel for more market analysis & trading tips: t.me/synapsetrading
Table of Contents
What Is a Spinning Top Candlestick?
A spinning top is a candlestick pattern with a short real body that’s vertically centered between long upper and lower shadows.
The candlestick pattern represents indecision about the future direction of the asset, meaning that neither buyers nor sellers could gain the upper hand.
A candlestick pattern forms when buyers push the price up during a given time period, and sellers push the price down during the same time period, but ultimately the closing price ends up very close to the open.
After a strong price advance or decline, spinning tops can signal a potential price reversal if the candle that follows confirms.
A spinning top can have a close above or below the open, but the two prices are always close together.
What Does a Spinning Top Candlestick Tell You?
Spinning tops are a sign of indecision in the asset; the long upper and lower shadows indicate there wasn’t a meaningful change in price between the open and close.
The bulls sent the price sharply higher, and the bears sent the price sharply lower, but in the end, the price closed near where it opened.
This indecision can signal more sideways movement, especially if the spinning top occurs within an established range.
It can also signal a possible price reversal if it occurs following a price advance or decline.
Sometimes spinning tops may signal a significant trend change.
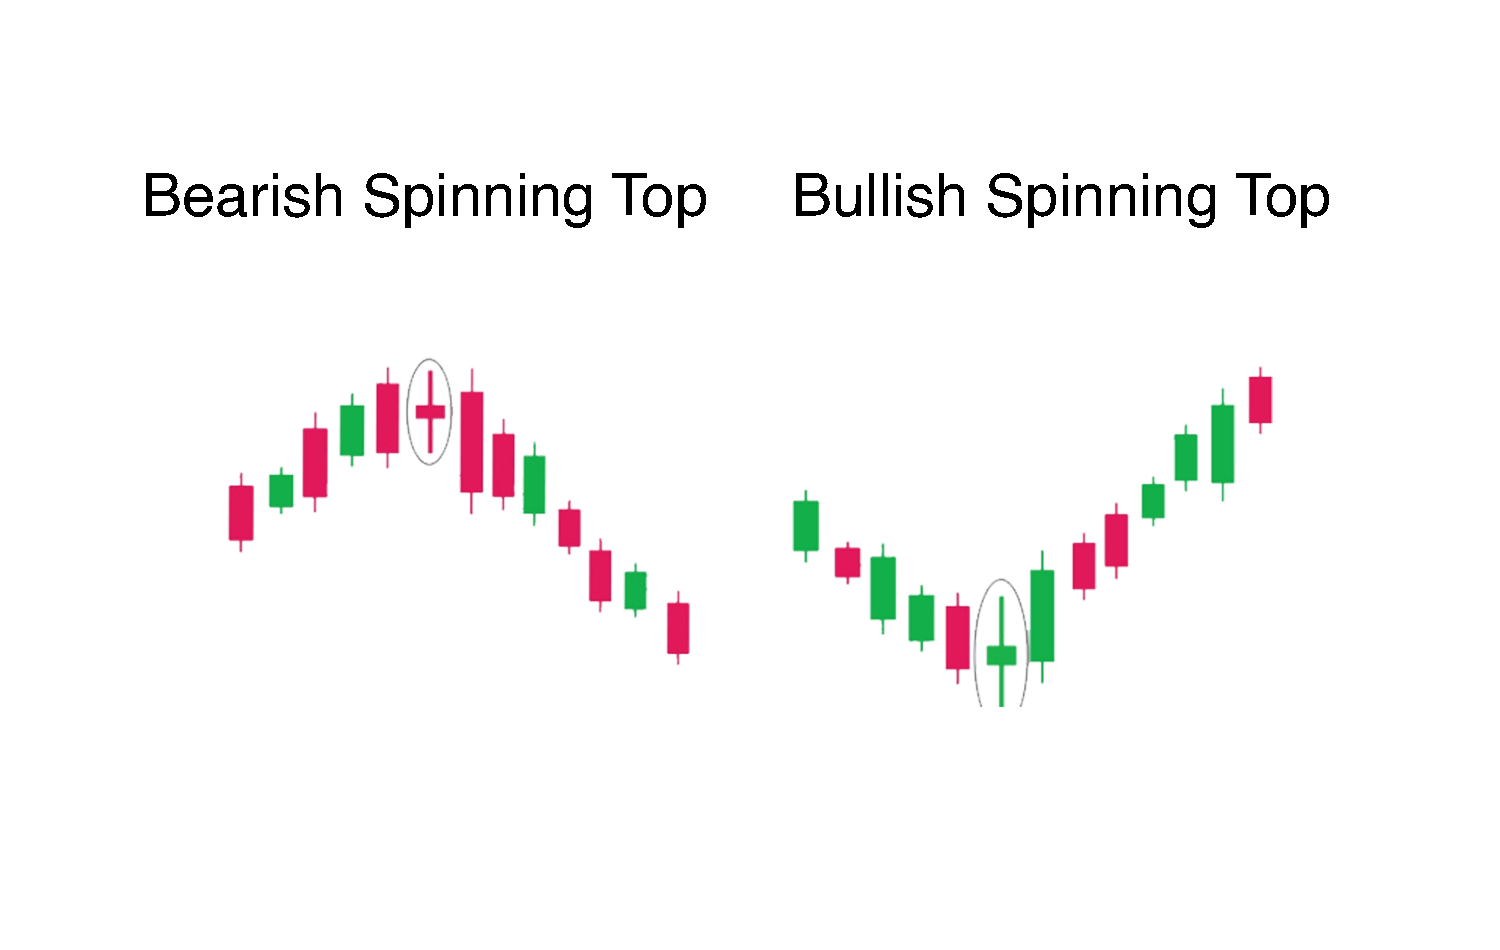
A spinning top that occurs at the top of an uptrend could be a sign that bulls are losing their control, and the trend may reverse.
Similarly, a spinning top at the bottom of a downtrend could signal that bears are losing control and bulls may take the reins.
In any case, confirmation helps clarify what the spinning top is saying.
The confirmation comes from the next candle.
If a trader believes a spinning top after an uptrend could result in a reversal to the downside, the candle that follows the spinning top should see prices drop.
If it doesn’t, the reversal is not confirmed, and the trader will need to wait for another trade signal.
If the spinning top occurs within a range, this indicates indecision is still prevalent, and the range will likely continue.
The candle that follows should confirm, meaning it stays within the established sideways channel.
Spinning tops are a common candlestick pattern, which means they work best in conjunction with other forms of technical analysis.
For example, traders may look at technical indicators, like the moving average convergence-divergence (MACD) or relative strength index (RSI), for signs of a reversal before taking a trade based on a spinning top.
Indicators or other forms of analysis, such as identifying support and resistance, may aid in making decisions based on candlestick patterns.
Limitations of Using the Spinning Top
Spinning top candlesticks are common, which means many of the patterns witnessed will be inconsequential.
Since assets often have periods of indecision, this makes sense.
Spinning tops frequently occur when the price is already moving sideways or is about to start.
As for forecasting reversals, the common nature of spinning tops also makes this problematic.
Many spinning tops won’t result in a reversal.
Confirmation is required, but even with confirmation, there is no assurance the price will continue in the new direction.
Trading around a spinning top can also pose some problems since the candle can be quite large from high to low.
If confirmation comes after a spinning top and a trade is taken, placing a stop loss above or below the high/low of the spinning top could result in a large risk, which doesn’t justify the potential reward.
Assessing the reward potential of a spinning top trade is also difficult since the candlestick pattern doesn’t provide a price target or exit plan.
Traders need to utilize other candlestick patterns, strategies, or indicators to find a profitable exit.
Concluding Thoughts
The spinning top candlestick pattern is a useful indicator of indecision and potential market reversal, but it should not be relied upon in isolation.
Given its common occurrence, traders should seek confirmation from subsequent candles and integrate additional technical analysis tools to support their trading decisions.
When used as part of a broader strategy, the spinning top can provide valuable insights into market sentiment and potential price movements, helping traders navigate both trends and ranges effectively.
 Our flagship mentoring program is suitable for both beginners and advanced traders, covering the 4 strategies which I used over the past 15 years to build up my 7-figure personal trading portfolio.
 If you're looking for the best trading opportunities every day across various markets, and don't want to spend hours doing the research yourself, check out our private Telegram channel!

Leave a Reply
Want to join the discussion?Feel free to contribute!