

Downside Tasuki Gap
Want the daily routine? Get the free 15-Minute Swing Trader’s Checklist. Get it free →
What Is a Downside Tasuki Gap?
Definition
A Downside Tasuki Gap is a candlestick formation commonly used to signal the continuation of the current downtrend.
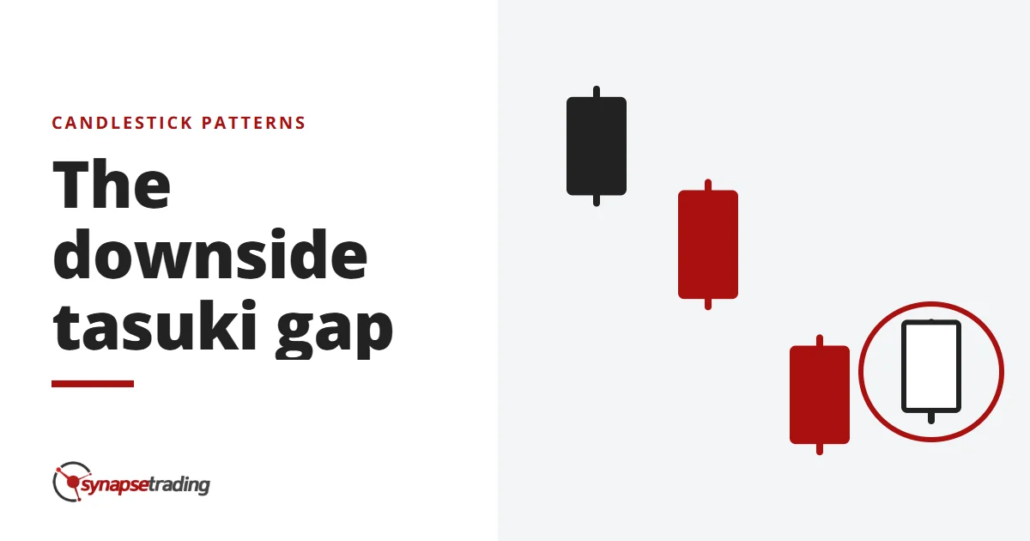
The pattern forms when a series of candlesticks exhibit the following characteristics:
1. The first candle is red or black (down) within an existing downtrend.
2. The second candle gaps below the close of the previous bar and is also red (down).
3. The last bar is a white or green (up) candlestick that closes within the gap of the first two bars. It is important to note that the white candle does not need to fully close the gap.
What Does the Downside Tasuki Gap Tell You?
The Downside Tasuki Gap, also known as the Bearish Tasuki Gap, is a three-candle continuation pattern.
To identify this pattern, traders should look for a clear downtrend and a large red/down candle.
Following this, the price must gap down and form another large red/black candle.
Finally, a white/green candle must follow the red/black candle, with the green/white candle opening inside the red candle’s real body and closing above it.
This candle should not close the gap between the first two candles.
The Downside Tasuki Gap pattern illustrates the strength of the downtrend, with bears firmly in control and pushing the price lower.
This downward momentum is reinforced by the gap lower and the formation of a new red candle.
However, a pause follows as the bulls attempt to push the price up.
If the price is unable to close the gap, and the price starts to drop again, the bulls are likely to exit, allowing the existing downtrend to resume.
Some traders opt to enter short near the close of the white candle, anticipating the continuation of the downtrend.
Others may prefer to wait for the price to drop below the low or open of the white candle, providing confirmation that the price is dropping again and the downtrend is resuming.
Limitations of Using the Downside Tasuki Gap
The Downside Tasuki Gap pattern is just three candles in a larger context of price action.
By focusing solely on this pattern, a trader might lose sight of the broader trend.
For instance, while the short-term trend may be down when this pattern occurs, the longer-term trend might be up, leading to a potential rise in price shortly after the pattern forms.
This pattern is relatively uncommon, presenting limited trading opportunities.
Moreover, context is crucial when using this pattern.
The stronger the downtrend and selling pressure, the more likely the price will continue lower.
In choppy or weak trends, the odds of success for this pattern diminish.
There is no indication of how far the price may fall, or if it will fall at all, after the pattern, requiring traders to use additional forms of analysis.
Before trading any candlestick pattern, it’s essential to look for historical examples of how the pattern has performed, including both successful and unsuccessful outcomes.
Concluding Thoughts
The Downside Tasuki Gap is a useful pattern in technical analysis that signals the continuation of a downtrend.
While it can provide valuable insights into potential market movements, traders should always consider the broader market context and use additional analysis to confirm their trades.
This pattern is best used as part of a comprehensive trading strategy that includes other technical indicators and market analysis.
Want the daily routine? Enter your email for the free 15-Minute Swing Trader's Checklist.
Free 5-page PDF, then occasional trading emails. Education only, not financial advice. Unsubscribe anytime. Kit stores your email in the US: see our privacy policy.
Want to learn the full method? The Trading Mastery Program teaches the 4 strategies I have traded since 2011. It suits beginners and experienced traders.
Rather follow the trades as they happen? Daily Trading Signals is our Telegram channel: my trade ideas with entry, stop and exit, and every trade is public.
Questions about this post? Ask in the free Telegram channel →
Educational content only, not personalised financial advice. Trading carries risk, including loss of capital. Past performance is not indicative of future results. Synapse Trading is not licensed or regulated by MAS.

