

Three Inside Up & Three Inside Down Pattern
Want the daily routine? Get the free 15-Minute Swing Trader’s Checklist. Get it free →
What Is Three Inside Up/Down?
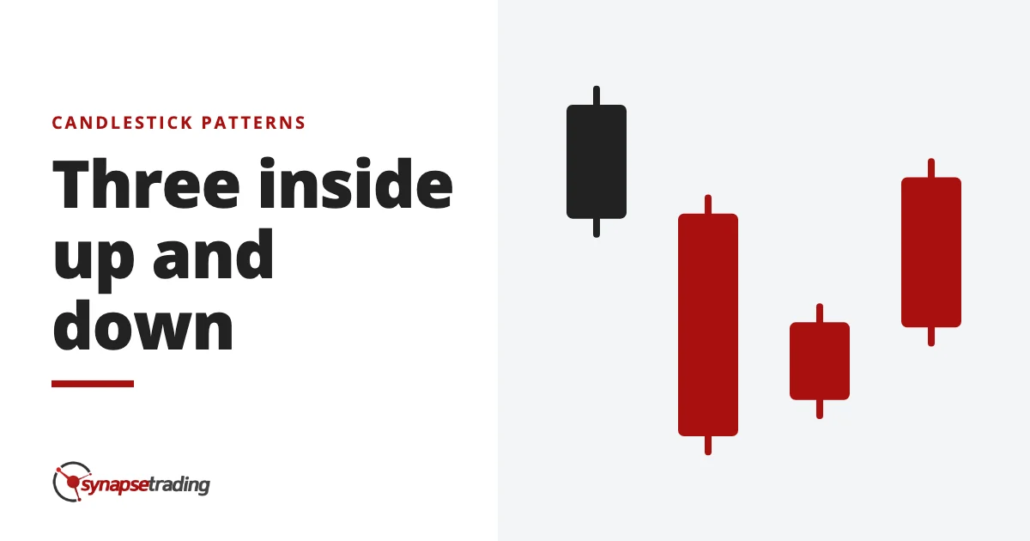
The terms “three inside up” and “three inside down” refer to a pair of candle reversal patterns (each containing three individual candles) that appear on candlestick charts. The pattern requires three candles to form in a specific sequence, showing that the current trend has lost momentum and a move in the other direction might be starting.
Key Characteristics of Three Inside Up/Down
Three Inside Up:
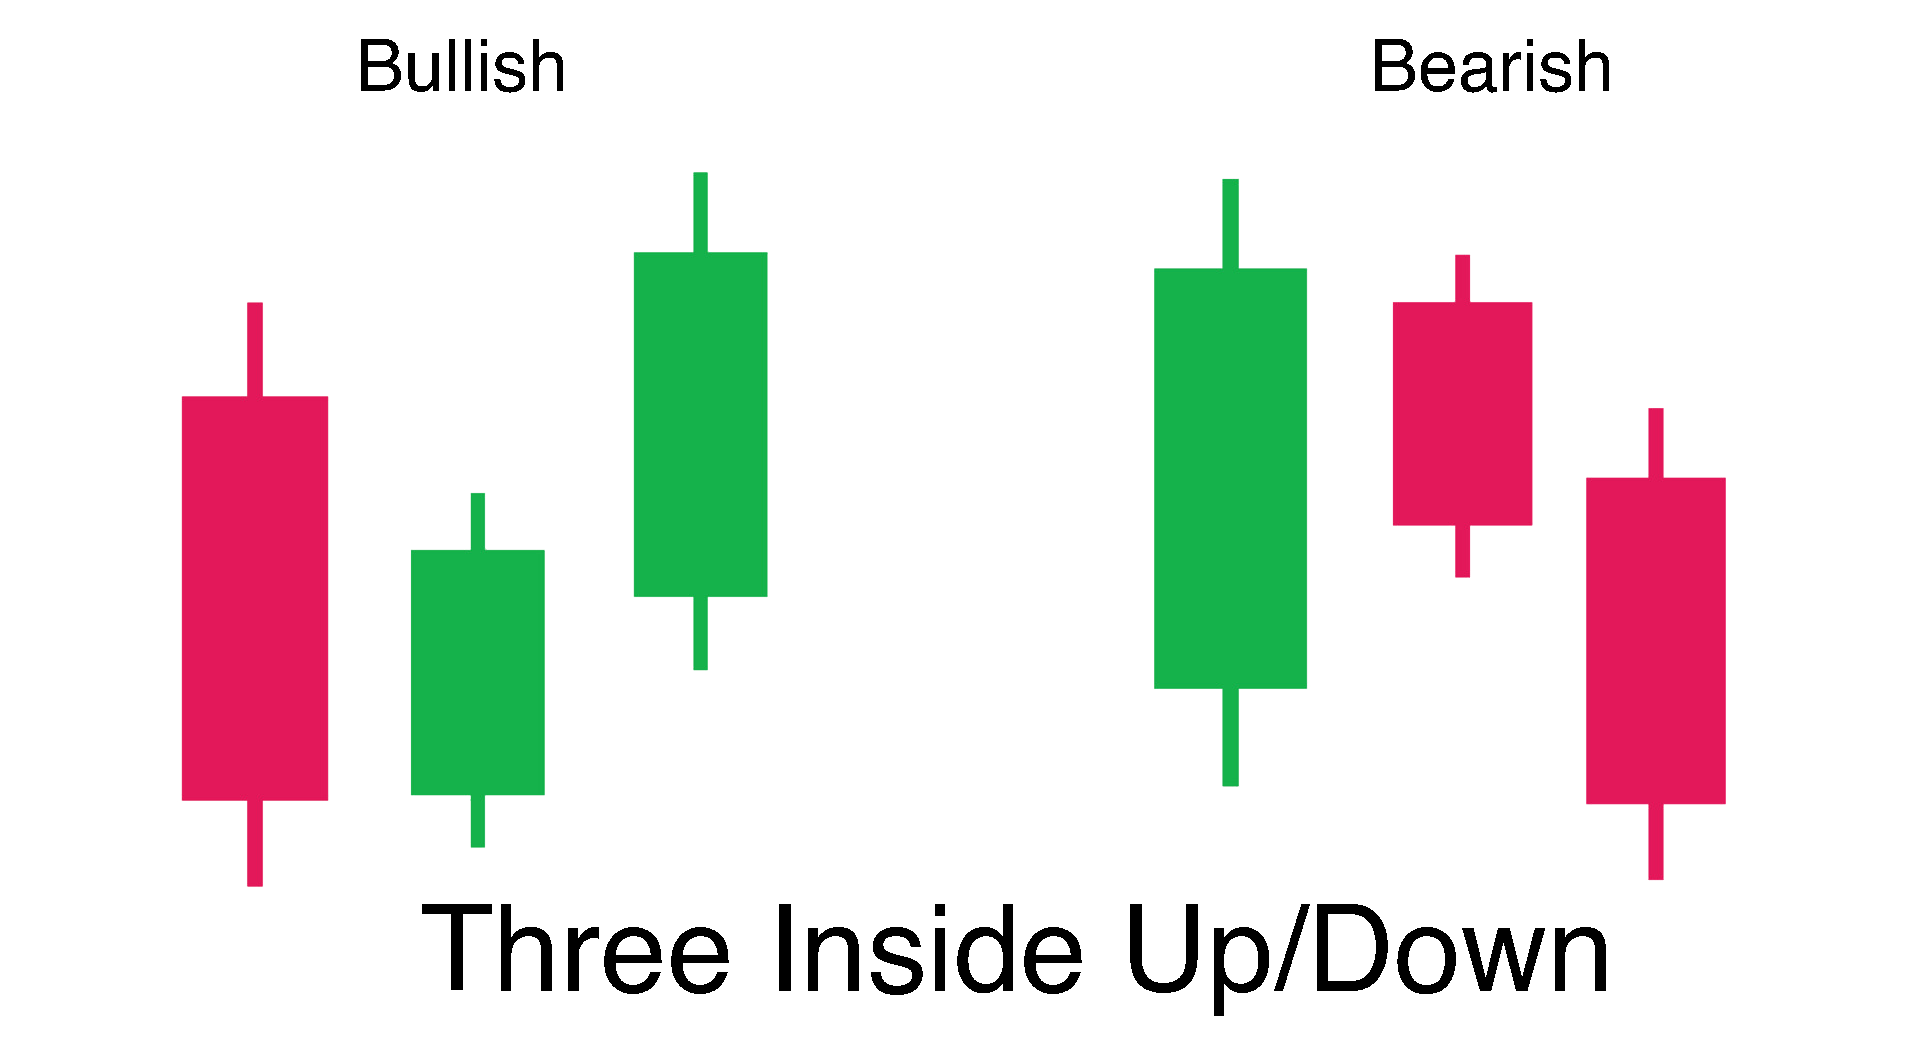
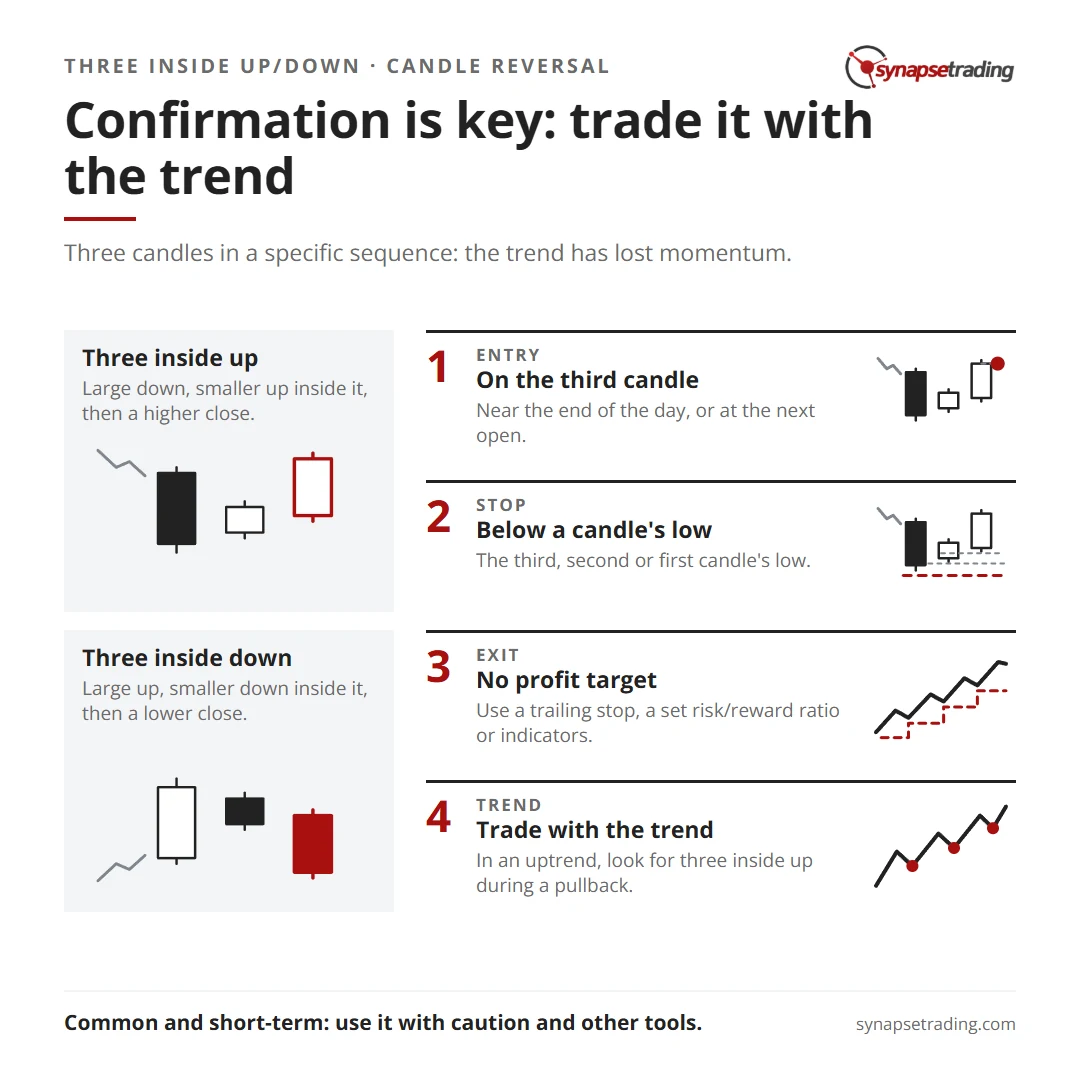
- The three inside up pattern is a bullish reversal pattern composed of a large down candle, a smaller up candle contained within the prior candle, and then another up candle that closes above the close of the second candle.
Three Inside Down:
- The three inside down pattern is a bearish reversal pattern composed of a large up candle, a smaller down candle contained within the prior candle, and then another down candle that closes below the close of the second candle.
These patterns are short-term in nature and may not always result in a significant or even minor trend change. Consider using these patterns within the context of an overall trend. For example, use the three inside up during a pullback in an overall uptrend.
Understanding the Three Inside Up/Down Candlestick Patterns
Three Inside Up:
- The market is in a downtrend or a move lower.
- The first candle is a black (down) candle with a large real body.
- The second candle is a white (up) candle with a small real body that opens and closes within the real body of the first candle.
- The third candle is a white (up) candle that closes above the close of the second candle.
Three Inside Down:
- The market is in an uptrend or a move higher.
- The first candle is a white candle with a large real body.
- The second candle is a black candle with a small real body that opens and closes within the real body of the first candle.
- The third candle is a black candle that closes below the close of the second candle.
The three inside patterns are essentially harami patterns that are followed by a final confirmation candle, which many traders wait for with the harami anyway.
Three Inside & Trader Psychology
Three Inside Up: The downtrend continues on the first candle with a large sell-off posting new lows. This discourages buyers, while sellers grow confident.
The second candle opens within the prior candle’s trading range. Rather than following through to the downside, it closes higher than the prior close and the current open. This price action raises a red flag, which some short-term short sellers may use as an opportunity to exit.
The third candle completes a bullish reversal, trapping remaining short-sellers and attracting those who are interested in establishing a long position.
Three Inside Down: The uptrend continues on the first candle, with a large rally posting new highs. The second candle opens within the prior candle’s trading range and closes below the prior close and current open. This causes concern for the buyers, who may start selling their long positions.
The third candle completes a bearish reversal, where more long positions are forced to consider selling and short-sellers may jump in to take advantage of the falling price.
Trading the Three Inside Up/Down Candlestick Pattern
The three inside up/down pattern doesn’t need to be traded. It can simply be used as an alert that the short-term price direction may be changing.
For those that do wish to trade it, a long position can be entered near the end of the day on the third candle, or on the following open for a bullish three inside up. A stop loss can be placed below the low of the third, second, or first candle. This depends on how much risk the trader is willing to take on.
For a bearish three inside down, a trader could enter short near the end of the day on the third candle, or at the open the following day. A stop loss can be placed above the third, second, or first candle high.
These patterns do not have profit targets. Therefore, it’s best to utilize another method for deciding when to take profits, should they develop. This could include using a trailing stop loss, exiting at a predetermined risk/reward ratio, or using technical indicators or other candlestick patterns to signal an exit.
These patterns can appear quite often and will not always signify that the price is set to trend in a new direction. The pattern is fairly common, and therefore not always reliable. The pattern is also short-term in nature, so while it may occasionally result in significant trend changes, it may bring about only a small to medium-sized move in the new direction. Following the pattern, the price may not follow through in the direction expected at all, and may instead reverse course once again, in the direction of the original trend.
Trading in the same direction as the long-term trend may help improve the performance of the pattern. Therefore, during an overall uptrend, consider looking for the three inside up during a pullback. This could signal that the pullback is over and the uptrend is resuming.
During a downtrend, look for the three inside down following a small move higher. This could signal the move higher is over and the downtrend is resuming.
Concluding Thoughts
The three inside up/down candlestick patterns provide traders with a potential signal for a reversal in the current trend. However, due to their common occurrence and short-term nature, these patterns should be used with caution and in conjunction with other technical analysis tools. Confirmation is key, and aligning trades with the overall trend can increase the likelihood of success when trading these patterns.
Want the daily routine? Enter your email for the free 15-Minute Swing Trader's Checklist.
Free 5-page PDF, then occasional trading emails. Education only, not financial advice. Unsubscribe anytime. Kit stores your email in the US: see our privacy policy.
Want to learn the full method? The Trading Mastery Program teaches the 4 strategies I have traded since 2011. It suits beginners and experienced traders.
Rather follow the trades as they happen? Daily Trading Signals is our Telegram channel: my trade ideas with entry, stop and exit, and every trade is public.
Questions about this post? Ask in the free Telegram channel →
Educational content only, not personalised financial advice. Trading carries risk, including loss of capital. Past performance is not indicative of future results. Synapse Trading is not licensed or regulated by MAS.

