

Hook Reversal Pattern: How to Spot It and Why It Misfires
Want the daily routine? Get the free 15-Minute Swing Trader’s Checklist. Get it free →
By Spencer Li, CFTe · Last updated: 26 October 2026
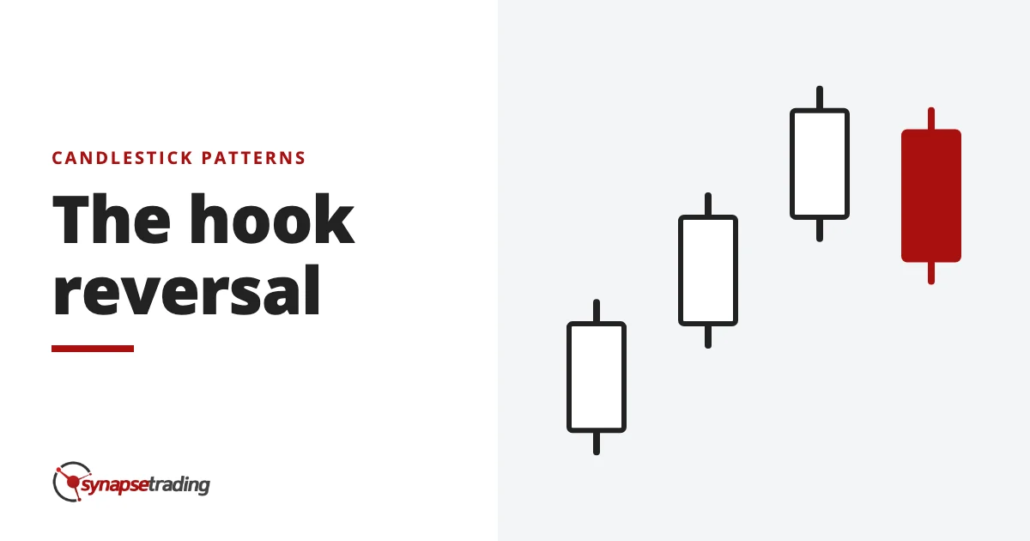
A hook reversal is a two-candle pattern that warns a trend may be turning. The second candle sits inside the first, with a lower high and a higher low, and it opens near one end of its own range and closes near the other. After a rise, a hook that opens near its high and closes near its low is bearish. After a fall, a hook that opens near its low and closes near its high is bullish. It is common and easy to spot, and that is exactly its weakness, because a pattern that fires this often throws plenty of false alarms. So most traders treat the hook as a reason to look closer, and they want a second piece of evidence before they act on it.
What exactly is a hook reversal?
The hook reversal has a slightly odd family tree. The clearest rules I have found for it come from the bar chart side of technical analysis rather than the Japanese candle books.
Colin Twiggs, the former investment banker who co-founded Incredible Charts, files it next to the open-close reversal and the closing price reversal. All three share the same bar, he notes, and what makes this one a hook is where that bar sits against the day before. His rules after an uptrend are short. The open must be near the high, the close must be near the low, and the day prints a lower high and a higher low than the day before, so the whole session fits inside yesterday’s range. After a downtrend, flip the open and the close.
So, in plain words, a hook is an inside day with an attitude. The whole range of the second session fits inside the first, which on its own just means the market went quiet. Then the open and the close sit at opposite ends of that smaller range, and the colour usually flips from the candle before, which is why your eye catches it at once.
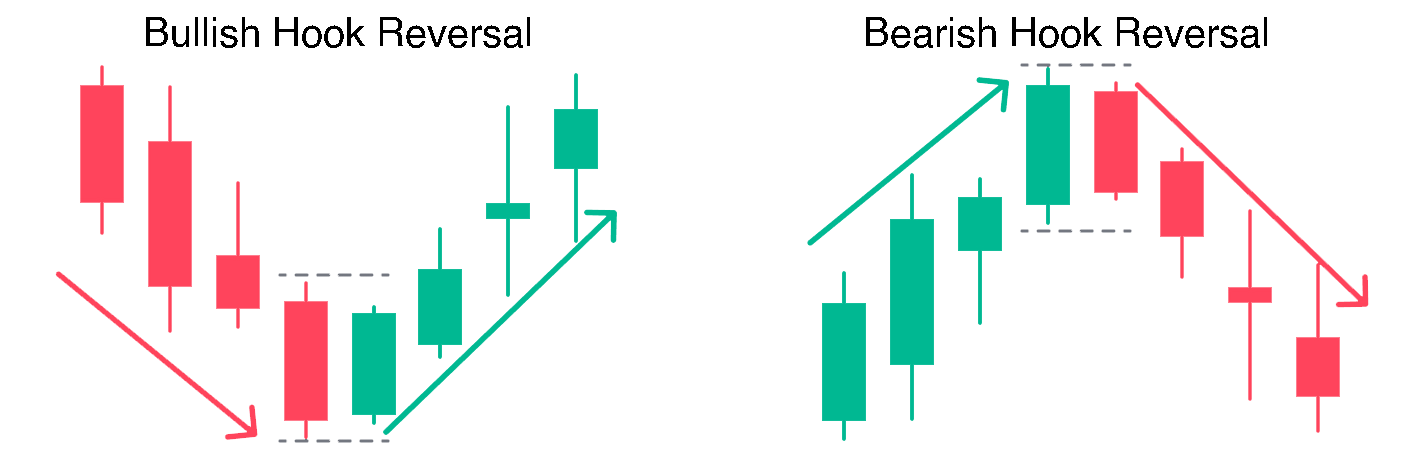
Do note that the hook tells you about direction and nothing about distance. It hints that the side in charge has lost the session, and it stays silent on how far the other side can take price from there, which is why a hook on its own can never give you a target.
How is a hook different from a harami or an engulfing pattern?
If the hook sounds a lot like a bullish harami, you are in good company, because many guides file it as a type of harami or engulfing pattern. The three are close relatives, and the difference is all in what has to fit inside what.
Steve Nison, whose book brought candlesticks to most Western traders, describes the harami as a small real body held inside an unusually long one before it. He compares it to the Western inside day, with one twist. For a harami, only the bodies have to nest, and the shadows can poke out. The hook is the other way round, since the whole range has to nest while the body can be fairly long.
The bullish engulfing pattern runs the other way. The second body swallows the first.
| Pattern | What has to fit inside what | Size difference needed | How often it shows up |
|---|---|---|---|
| Hook reversal | The second range sits inside the first range | Small | Often |
| Harami | A small second body sits inside a long first body | Large | Less often |
| Engulfing | The second body swallows the first body | Large | Less often |
So the hook is the loosest of the three.
Some guides also liken the hook to the dark cloud cover, because the two bodies can be of similar length. I think that comparison causes more confusion than it clears up. In Nison’s definition, the dark cloud’s second session opens above the first session’s high. A hook never can. Its high is lower by definition.
The usual verdict in the guides is that the harami and the engulfing pattern turn up less often and call reversals better than the hook. Hence, when I see a hook, the first thing I ask is whether it has quietly grown into one of its stricter cousins.
What is the hook telling you about buyers and sellers?
Imagine a stock that has climbed hard for a week. Today it opens near its high, and for a few minutes the buyers feel quite good about themselves. By the close, sellers have walked it down to the low of the session, which never got as far as yesterday’s low, but the candle is now red and sits inside yesterday’s range. Anyone who bought at the open is staring at a small loss and some regret, and the people who were thinking of buying more have just watched the sellers win the day.
That is the information in a bearish hook. The buyers who had been in charge for a week could not even reach yesterday’s high, and the sellers took the session from them. A bullish hook at the bottom of a fall tells the mirror story, with fear running out of steam and buyers pushing price back up from the open.
Now, losing one session is quite different from losing the war. Martin Pring, writing about inside bars in his 2005 book on price patterns, put it carefully: “Quite often we find that with inside bars, there is a change as opposed to a reversal in trend”. Sometimes the trend stops and turns. Sometimes it simply takes a breather and carries on.
Pring also listed what made an inside bar more meaningful. The sharper the trend before it, the better. The wider the first bar, and the smaller the inside bar against it, the better. And volume on the inside bar should be noticeably lighter. Twiggs says much the same about hooks in one line: “If the trend is weak, so is the signal”. A hook after a long, stretched run therefore means a lot more than a hook in the middle of a sideways grind.
Reading these candles is mostly a habit of checking the same few things every day, and my free 15-minute swing trader checklist is the routine I run myself.
Why does a pattern this common need a second opinion?
There is a good reason the smoke alarm in your kitchen goes off when you burn the toast. In 2001 the psychiatrist Randolph Nesse called it the smoke detector principle. The body’s defences, like anxiety, pain and coughing, are set to fire far more often than seems necessary, because a false alarm costs very little and a missed fire can cost everything. He later pointed out that better information cuts the false alarms without making you any less safe.
A hook is a smoke alarm. It goes off a lot. Glancing at the chart costs you a few seconds. Buying or selling every time it fires is a different matter, because in trading a false alarm costs real money, and a pattern that prints this often can slowly drain an account through a hundred small losses. So the hook earns a look, and the extra information from the trend, the level and the volume is what decides whether it earns a trade.
The doubt about this is fair, and it is worth hearing in full. On 17 September 2026, a trader on Reddit’s r/Daytrading posted a test of 21 setups the forum teaches, the inside bar among them. Their blunt summary was that “most of what gets taught as a setup does no better than a coin”. Only one rule passed.
Fair enough. Their test ran on one-minute bars of US index futures, gold and crude, one trade a day, and the inside bar was not the rule that passed. I should also be honest about my own records. My trade log tags each trade by setup type, and none of those tags records which candle came first, so I have no count of hook trades to show you.
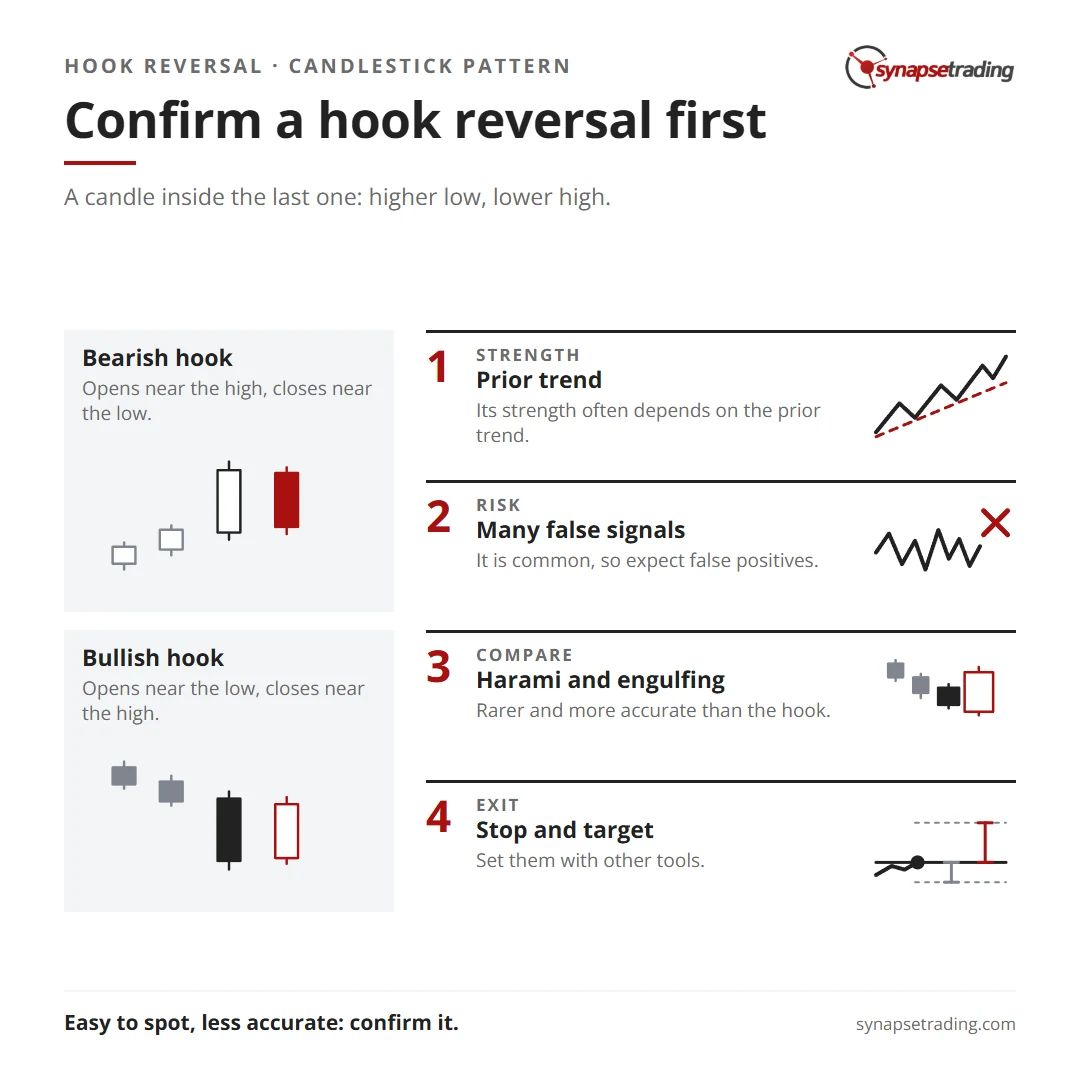
But that test also explains why I would never trade a hook as a stand-alone signal. A candle shape with nothing around it is a coin flip with extra steps. The shape becomes useful only when it agrees with something bigger, like a trend that has run a long way, a level the market has respected before, or volume drying up as the pressure fades.
So how do you use a hook without getting chopped up?
Personally, I let the hook change what I look at, and I let the rest of the chart decide what I do.
- Trend. Is there a clear, stretched move for the hook to reverse? With no trend, there is nothing to turn. The hook is then just a quiet day.
- Location. Where on the chart did it print? A hook that forms against an old support or resistance level carries a lot more weight than one floating in open space.
- Evidence. What else agrees with it? The next sessions count. So do the level and the volume.
- Exit. Because the hook says nothing about distance, the stop and the target have to come from the structure of the chart around it.
The catch with step 3 is that confirmation has a price. In late November 2025, during a short-term correction, I told viewers of my weekly outlook that it “wasn’t clear whether the trend was going to resume”, so I waited for more confirmation before adding positions. By then the recovery looked stronger. But I also said in my outlook on 15 April 2026 that “if you wait too long for too much confirmation, then the reward to risk ratio will become worse and worse”. Proof costs money. Every extra candle of proof moves your entry further from the point where you would admit you were wrong.
So the real skill with a hook is deciding how much evidence is enough, and that is a judgement no scanner can make for you. If you would rather make that call once a day than all day, the free 15-minute swing trader checklist is the routine I use.
FAQ
Is a hook reversal bullish or bearish?
It can be either. A bearish hook forms after a rise, opening near its high and closing near its low, while a bullish hook forms after a fall and does the opposite, opening near its low and closing near its high.
What is the difference between a hook reversal and an inside bar?
Every hook is an inside bar, since its high is lower and its low is higher than the bar before. The hook adds one more condition: it opens near one end of its range and closes near the other.
Is a hook reversal the same as a harami?
No, although they are close. A harami needs a small body inside a long body, and the shadows can stick out. A hook needs the whole range inside the first candle, and its body can be fairly long.
How reliable is the hook reversal pattern?
It fires often, which means plenty of false signals. Most guides rate the harami and the engulfing pattern as more reliable, and the hook works best after a strong trend.
Does the hook tell you how far the move will go?
No. It only hints at a change in direction, so targets and stops come from other parts of the chart, such as support and resistance.
What makes a hook reversal stronger?
Four things add weight: a sharp trend before it, a wide first candle, a small second candle and lighter volume on the second session.
Have you ever acted on a hook that turned out to be the trend just catching its breath? And how much confirmation do you wait for before you trust a reversal? Let me know in the comments.
For every candle pattern in one place, read The Definitive Guide to Candlestick Patterns. For the wider picture, start with my free trading guides.
And if you want a 15-minute daily routine instead of hours at the screen, grab the free 15-minute swing trader checklist.
About the author. Spencer Li is The 15-Minute Trader and the founder of Synapse Trading. He is a Certified Financial Technician (CFTe) with 15+ years of trading, run from 70+ countries. He holds a B.Acc and B.BM from SMU. Every trade he takes is public, dated, losses left in. He teaches rules-based swing trading in 15 minutes a day, one system for any market.
Education, not financial advice. Synapse Trading is not licensed by MAS to advise on investment products. Trading carries risk of loss, and past performance is not indicative of future results.
Want the daily routine? Enter your email for the free 15-Minute Swing Trader's Checklist.
Free 5-page PDF, then occasional trading emails. Education only, not financial advice. Unsubscribe anytime. Kit stores your email in the US: see our privacy policy.
Want to learn the full method? The Trading Mastery Program teaches the 4 strategies I have traded since 2011. It suits beginners and experienced traders.
Rather follow the trades as they happen? Daily Trading Signals is our Telegram channel: my trade ideas with entry, stop and exit, and every trade is public.
Questions about this post? Ask in the free Telegram channel →
Educational content only, not personalised financial advice. Trading carries risk, including loss of capital. Past performance is not indicative of future results. Synapse Trading is not licensed or regulated by MAS.

