• Link to Facebook
  • Link to X
  • Link to Instagram
  • Link to Youtube
  • Link to LinkedIn
  • Link to Mail
Synapse Trading
  • Home
  • About
    • My Background
    • My Trading Journey
    • My Travel Log
    • Media & Interviews
  • Mentoring
    • Trading Mastery Program
    • Results & Testimonials
  • Signals
    • Telegram (Free to join!)
    • Daily Trading Signals
    • Daily Trading Signals (Results)
  • Resources
    • Free Trading Guides
    • Tools & Resources
    • Blog & Infographics
  • Contact
    • Contact Us
    • Partnership Opportunities
  • Click to open the search input field Click to open the search input field Search
  • Menu Menu
Spencer Li

Top 76 Psychology Books to Read (With Key Ideas)

Book Summaries
Thumbnail Top Psychology Books to Read

The Best Psychology Books to Read (and Where to Start)
Last updated: 3 July 2026 · By Spencer Li, CFTe


If you want the single best psychology book to start with, read Daniel Kahneman’s “Thinking, Fast and Slow” (2011), because it explains the two systems your mind uses to make decisions and the biases that quietly steer them, and that one idea touches everything else on this list. From there, the most rewarding reads depend on what you actually want. For meaning and resilience, read Viktor Frankl’s “Man’s Search for Meaning”. For how to read and influence people, read Robert Cialdini and Dale Carnegie. For how the brain physically changes, read Norman Doidge. For relationships, read John Gottman. You do not need to read seventy books. You need the right six or seven, in roughly the right order, and the patience to apply one idea before reaching for the next.

Below is the short, curated version, grouped by what you are trying to learn, with a one-line note on each so you can pick fast.

Why read psychology books at all?

Psychology is the study of the mind and behaviour: how we think, feel, perceive, decide, and relate to each other. People pick it up for different reasons. Some want to understand their own patterns. Some want to help others. Some want an edge in business, leadership, or negotiation, where everything eventually comes down to people.

Personally, I came to it sideways, through trading. You can have a perfect system and still lose money, because the hard part is not the chart, it is the person reading it. Once you start studying decision-making, fear, and bias on purpose, you stop blaming the market and start fixing the operator. That is the most useful thing psychology ever did for me.

What are the best psychology books, grouped by what you want to learn?

Here are the genuine standouts from a much longer list, sorted so you can find the one that fits.

BookAuthorWhat it teachesRead it if you want to
Thinking, Fast and SlowDaniel KahnemanTwo systems of thought and the biases in eachUnderstand how you actually decide
Man’s Search for MeaningViktor FranklFinding meaning in sufferingBuild resilience and purpose
Influence / The Science of PersuasionRobert CialdiniThe principles behind why people say yesPersuade ethically, or resist being persuaded
How to Win Friends and Influence PeopleDale CarnegiePractical relationship and influence skillsGet along with and lead people
The Brain That Changes ItselfNorman DoidgeNeuroplasticity, how the brain rewiresBelieve change is physically possible
The Science of TrustJohn GottmanWhat builds and breaks trust in couplesStrengthen a relationship
The Hidden BrainShankar VedantamHow unconscious bias shapes behaviourSee your own blind spots
The Man Who Mistook His Wife for a HatOliver SacksReal neurological case studiesBe fascinated by the brain’s edges

Start here: how we think and decide

  • “Thinking, Fast and Slow” by Daniel Kahneman (2011). The map of how the mind processes information and where bias creeps into decisions. If you read one book on this list, read this one.
  • “The Hidden Brain” by Shankar Vedantam (2010). How unconscious processes shape your thoughts and choices without your permission.
  • “The Drunkard’s Walk” by Leonard Mlodinow (2008). How much of life is randomness and probability that we wrongly read as skill or fate. Useful, and humbling.

Meaning, suffering, and how to live

  • “Man’s Search for Meaning” by Viktor Frankl (1946). Written out of the concentration camps. The argument that meaning, not comfort, is what carries a person through suffering.
  • “The Antidote” by Oliver Burkeman (2013). The case for facing negative emotions instead of forcing positivity. A quiet corrective to the happiness-industrial complex.
  • “The Power of Now” by Eckhart Tolle (1997). On presence and getting out of your own looping thoughts. Take what is useful, leave the rest.

People: influence, persuasion, relationships

  • “Influence / The Science of Persuasion” by Robert Cialdini. The principles behind why people comply. Read it to persuade honestly, and to notice when it is being done to you.
  • “How to Win Friends and Influence People” by Dale Carnegie (1936). Old, plain, and still works. Practical advice on dealing with people that has aged better than most.
  • “The Science of Trust” by John Gottman (2011). What actually predicts whether a relationship lasts, from decades of research, not vibes.

The brain itself

  • “The Brain That Changes Itself” by Norman Doidge (2007). Neuroplasticity (the brain’s ability to physically rewire itself) told through real cases. The hopeful one.
  • “The Man Who Mistook His Wife for a Hat” by Oliver Sacks (1985). Case studies of neurological disorders that teach you more about the normal brain than any textbook.
  • “The Emotional Brain” by Joseph LeDoux (1996). The neuroscience of emotion, especially fear, and how it drives behaviour before you are even aware of it.

Personality and self-knowledge

  • “The Enneagram” by Helen Palmer (1988). One framework for the nine personality types. A starting lens, not a verdict.
  • “The Mismeasure of Man” by Stephen Jay Gould (1981). A sharp critique of how intelligence testing has been used to justify bias. Read it before you trust any single score.

Bonus: the books that cross over into strategy and thinking well

A few classics on the original list are not strictly psychology, but they teach how minds and groups behave, so they earn a place.

  • “The Demon-Haunted World” by Carl Sagan (1995). A defence of critical thinking and scepticism against pseudoscience. The mental-hygiene book.
  • “The Art of War” by Sun Tzu. Strategy and conflict, ancient and still quoted because it is mostly about reading people and situations.
  • “Man’s Search for Meaning” pairs well here too, if you want strategy with a soul.

A note on the long lists you will see online

The original version of this post listed close to seventy titles. Do note that, when a “best books” list gets that long, a lot of it is padding, and several entries are not really about psychology at all. I would rather hand you the dozen that actually changed how I think than seventy I half-remember. If a book is not on this shorter list, it is not a knock on the book. It is a vote for your time.

Where the human edge comes in

Here is the part I care about most, because it is where these books stop being theory. Every one of them is, underneath, a book about decision-making under uncertainty. That is also the entire job of a trader. A screener can flag a setup in a second, but it cannot tell you that you are about to break your own rules out of fear, or that you are sizing up because you feel lucky, not because the edge improved. That self-knowledge is the first of the Five Edges no tool can trade for you. Kahneman will not make you money. But knowing which of his two systems is driving when your hand reaches for the buy button just might save you some.

FAQ

What is the best psychology book for beginners?
“Thinking, Fast and Slow” by Daniel Kahneman is the most recommended starting point, because it explains the two systems your mind uses to make decisions and the biases inside each. If it feels dense, start with “How to Win Friends and Influence People” by Dale Carnegie, which is shorter and immediately practical.

What psychology book should I read to understand myself?
For self-understanding, “The Hidden Brain” by Shankar Vedantam shows how unconscious bias shapes your choices, and “Man’s Search for Meaning” by Viktor Frankl reframes how you relate to hardship. A personality framework like “The Enneagram” by Helen Palmer can give you a starting vocabulary, as long as you hold it loosely.

Which psychology book helps with relationships?
“The Science of Trust” by John Gottman is built on decades of research into what makes couples last, and “Influence” by Robert Cialdini teaches the persuasion principles at work in every human interaction.

Are psychology books useful for trading and investing?
Yes. Most trading mistakes are psychological, not analytical. “Thinking, Fast and Slow” and “The Emotional Brain” both explain the fear and bias that wreck good plans. For the trading-specific version, see the trading and investing book list linked below.

Do I need to read all the famous psychology books?
No. A focused six or seven, read slowly and applied, will do more for you than seventy skimmed. Pick one from each section above that matches what you want right now, and start there.


So, which one are you starting with? Tell me in the comments, and if there is a psychology book that changed how you think that I left off, I want to hear it.

If you want the trading-specific cousin of this list, read the companion roundup: Best Investing and Trading Books of All Time.

Want to put the decision-making psychology to work? Grab the free 15-Minute Swing Trading Starter Kit. It is the exact once-a-day routine I use to keep emotion out of the trade and stay consistent in any market.


About the author. Spencer Li is the founder of Synapse Trading and a Certified Financial Technician (CFTe) with 15 years of trading across stocks, forex, crypto, commodities, and bonds. His trade log is public, 404 trades, losses left in. He teaches low-risk swing trading in 15 minutes a day, one system for any market.

Education, not financial advice. Synapse Trading is not licensed by MAS to advise on investment products. Trading carries risk of loss; past performance is not indicative of future results.


Related

Best Investing and Trading Books of All Time · Trading psychology and the mental game · Existentialism in everyday life

0 Comments/by Spencer Li
https://synapsetrading.com/wp-content/uploads/2022/12/Thumbnail-Top-Psychology-Books-to-Read.png 720 1280 Spencer Li https://synapsetrading.com/wp-content/uploads/2019/10/logo.jpg Spencer Li2022-12-23 02:44:282026-07-06 03:22:00Top 76 Psychology Books to Read (With Key Ideas)
Spencer Li

Weekly Market Wrap: Adding on to Profitable Shorts!

Market Analysis
Hagia Sophia Turkey

Now that the bears are back in action, the market has switched from “potential reversal” mode back to “risk off” mode, and the stock market has resumed its decline.

In last week’s market outlook video, we mentioned that the best trading opportunities will be shorting the stock/REITs market.

Over the past 2 weeks, we have seen some stock indices drop by more than 10%.

Will we see new lows before the year is over?

We will be adding more shorts on any pullbacks, but doing it in a way to maximise returns and minimise risk.

Want to join us in our big short of the year?

Check out out “Daily Trading Signals” private Telegram group for real-time entry signals!


Hagia Sophia Turkey

[Photo: Hagia Sophia, Turkey – See my full travel photo log!]

For our weekly market wrap, we go through some of the trade calls and analysis from last week, which gives us valuable insights for the week ahead.

We cover 3 main markets with a total of 200+ counters, so we will never run out of trading opportunities:

  • Forex, CFDs, commodities, bonds
  • US stocks, ETFs, global stock indices
  • Cryptocurrencies, crypto indices

By covering a broad range of markets, we can focus our attention (and capital) on whichever market currently gives the best returns.

Click here to receive all these signals in real-time for only $67 a month! You will get several signals a day, and even taking just 1 trade the whole month can easily cover the fee, so what are you waiting for?


Weekly Market Outlook Video

Trading Signals Weekly market outlook 181222

Weekly Market Outlook (18 December 2022)

After the false breakout for stocks on the bullish CPI data, prices made a U-turn back down.

During the FOMC, the Fed hinted that a pivot is not so soon, which added to the bearishness.

There is a good chance of seeing new lows in the stock market.


Portfolio Highlights

Trading Signals portfolio 181222

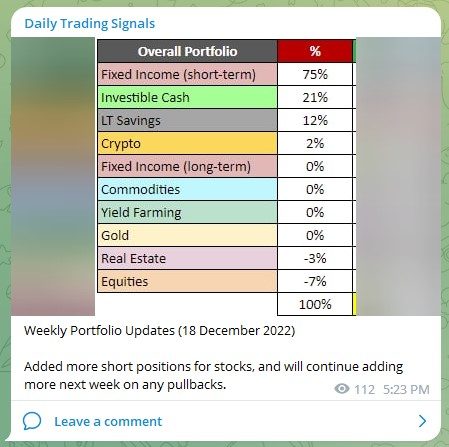
Weekly Portfolio Updates (18 December 2022)

Added more short positions for stocks, and will continue adding more next week on any pullbacks.


Forex & Commodities Market Highlights

Trading Signals AUDCHF 201222

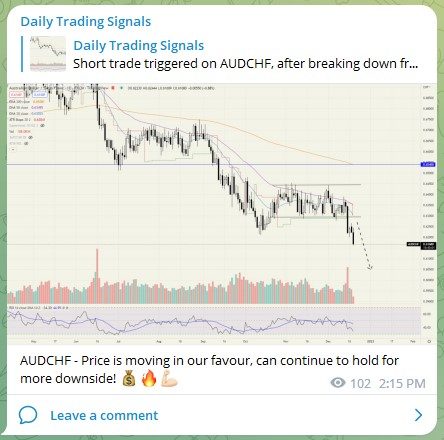
AUDCHF – Price is moving in our favour, can continue to hold for more downside! 💰🔥💪🏻


Trading Signals AUDJPY 201222

AUDJPY – Wow we did not expect it to hit our target in one day with 300+ pips profit! Congrats! 💰🔥💪🏻


Trading Signals CADJPY 201222

CADJPY – Strong downside breakout!

Headlines: “Nikkei 225 falls more than 2% after Bank of Japan widens yield target range, yen strengthens”


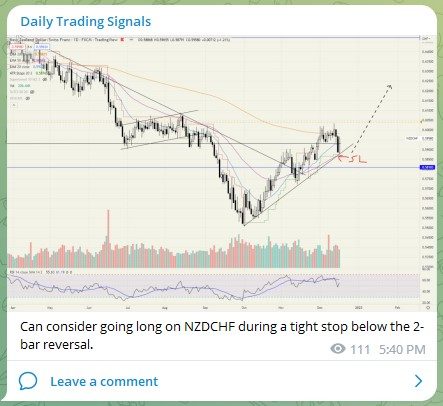
Trading Signals NZDCHF 181222

Can consider going long on NZDCHF during a tight stop below the 2-bar reversal.


Trading Signals WTIUSD 181222

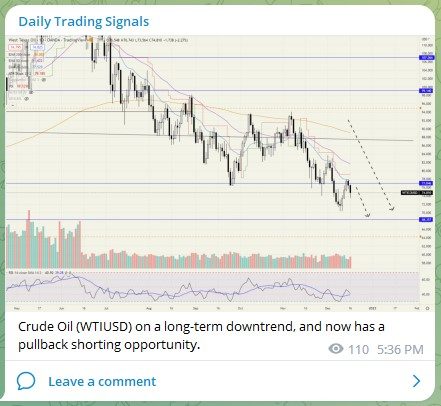
Crude Oil (WTIUSD) on a long-term downtrend, and now has a pullback shorting opportunity.


Stock & Bond Market Highlights

Trading Signals REET 171222

The long-awaited breakdown for Global REITs (REET) finally came as well, after running into the top of the trend channel.

It also formed a rising wedge just before the breakdown, which added to the bear conviction.

Congrats to those who joined in the shorts! 💰🔥💪🏻

I will be continuing to add more shorts, hopefully prices break new lows by the end of the year.


Trading Signals Inflation 211222

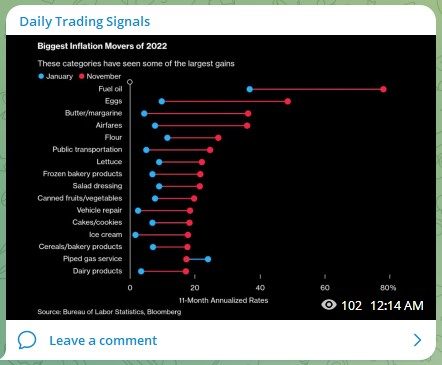
Biggest inflation movers of 2022.


Click here to receive all these signals in real-time for only $67 a month! You will get several signals a day, and even taking just 1 trade the whole month can easily cover the fee, so what are you waiting for?

Good luck, and may next week bring more excellent profits!

0 Comments/by Spencer Li
https://synapsetrading.com/wp-content/uploads/2022/12/Hagia-Sophia-Turkey.jpg 1536 2048 Spencer Li https://synapsetrading.com/wp-content/uploads/2019/10/logo.jpg Spencer Li2022-12-23 02:21:412022-12-24 11:59:21Weekly Market Wrap: Adding on to Profitable Shorts!
Spencer Li

Dark Cloud Cover Candlestick Pattern Trading Strategy Guide

Technical Analysis & Price Action
Thumbnail Dark Cloud Cover Candlestick Trading Strategy Guide

Thumbnail Dark Cloud Cover Candlestick Trading Strategy Guide

The Dark Cloud Cover Candlestick Pattern is a bearish candlestick pattern that is typically formed after an uptrend and indicates a potential trend reversal.

It is characterized by the following:

  • A long white candlestick
  • A short black candlestick that opens above the close of the previous day’s white candlestick and closes below the midpoint of the white candlestick

To identify the Dark Cloud Cover Candlestick Pattern, traders can look for the following:

  • An uptrend: The pattern is typically formed after an uptrend, as it indicates a potential trend reversal.
  • A long white candlestick: This indicates that the bulls are in control and are driving the price higher.
  • A short black candlestick: This indicates that the bears have taken control and are pushing the price lower. The black candlestick should open above the close of the previous day’s white candlestick and close below the midpoint of the white candlestick.

The psychology behind the Dark Cloud Cover Candlestick Pattern is that it represents a shift in sentiment from bullish to bearish.

During an uptrend, the bulls are in control and are driving the price higher.

However, when the Dark Cloud Cover Candlestick Pattern forms, it indicates that the bears have taken control and are pushing the price lower.

This can be seen as a sign of weakness and a potential reversal in the trend.

To use the Dark Cloud Cover Candlestick Pattern for trading, it is important to confirm the pattern with other technical analysis techniques and indicators.

One way to do this is to look for a break below the support level, which can be identified using trendlines.

To confirm the trend reversal with trendlines, traders can draw an uptrend line and wait for the price to break below it.

This indicates that the bulls have lost control and the bears are now in control.

Another way to confirm the Dark Cloud Cover Candlestick Pattern is to use support and resistance levels.

The pattern is typically formed at a key resistance level, and a break below the support level can indicate a potential trend reversal.

Traders can use previous highs and lows, or moving averages, to identify key support and resistance levels.

In addition to trendlines and support and resistance levels, traders can also combine the Dark Cloud Cover Candlestick Pattern with price patterns and price action.

For example, traders can look for other bearish patterns such as the Bearish Engulfing Pattern or the Evening Star Pattern to confirm the trend reversal.

They can also look for bearish price action such as a long black candlestick or a series of lower lows and lower highs to further confirm the trend reversal.

Traders can also use trend-following technical indicators such as moving averages and the moving average convergence divergence (MACD) to confirm the trend reversal.

These indicators can help identify the direction of the trend and confirm that the bears are in control.

Oscillator indicators such as the relative strength index (RSI) and stochastics can also be used to confirm the trend reversal.

These indicators can help identify overbought or oversold conditions and confirm the strength of the trend reversal.

When trading the Dark Cloud Cover Candlestick Pattern, it is important to consider where to enter the trade, where to place the stop loss, and where to take profit.

To enter the trade, it is recommended to wait for the black candlestick to close and then enter on a break below the low of the black candlestick.

The stop loss can be placed above the high of the black candlestick, while the take profit can be set at a key support level or based on the trader’s risk-reward ratio.

There are some limitations to the Dark Cloud Cover Candlestick Pattern that traders should be aware of.

One limitation is that the pattern is not always reliable and may not always signal a trend reversal.

In addition, the pattern can be easily faked out by false breaks or by the bulls regaining control and pushing the price higher. Therefore, it is important for traders to confirm the pattern with multiple techniques and indicators before entering a trade.

In conclusion, the Dark Cloud Cover Candlestick Pattern is a bearish candlestick pattern that is formed after an uptrend and indicates a potential trend reversal.

To identify the pattern, traders should look for an uptrend, a long white candlestick, and a short black candlestick that opens above the close of the previous day’s white candlestick and closes below the midpoint of the white candlestick.

The psychology behind the pattern is that it represents a shift in sentiment from bullish to bearish.


ed seykota

If you would like to learn more about all the different candlestick patterns, also check out: “The Definitive Guide to Candlestick Patterns”

0 Comments/by Spencer Li
https://synapsetrading.com/wp-content/uploads/2022/12/Thumbnail-Dark-Cloud-Cover-Candlestick-Trading-Strategy-Guide.png 720 1280 Spencer Li https://synapsetrading.com/wp-content/uploads/2019/10/logo.jpg Spencer Li2022-12-21 04:14:592023-01-10 01:43:38Dark Cloud Cover Candlestick Pattern Trading Strategy Guide
Spencer Li

Piercing Pattern Candlestick Trading Strategy Guide

Technical Analysis & Price Action
Thumbnail Piercing Pattern Candlestick Trading Strategy Guide

Thumbnail Piercing Pattern Candlestick Trading Strategy Guide

The Piercing Pattern is a bullish candlestick pattern that is typically formed after a downtrend and indicates a potential trend reversal.

It is characterized by the following:

  • A long black candlestick
  • A short white candlestick that opens below the close of the previous day’s black candlestick

To identify the Piercing Pattern, traders can look for the following:

  • A downtrend: The pattern is typically formed after a downtrend, as it indicates a potential trend reversal.
  • A long black candlestick: This indicates that the bears are in control and are driving the price lower.
  • A short white candlestick: This indicates that the bulls have taken control and are pushing the price higher.

The psychology behind the Piercing Pattern is that it represents a shift in sentiment from bearish to bullish.

During a downtrend, the bears are in control and are driving the price lower. However, when the Piercing Pattern forms, it indicates that the bulls have taken control and are pushing the price higher.

This can be seen as a sign of strength and a potential reversal in the trend.

To use the Piercing Pattern for trading, it is important to confirm the pattern with other technical analysis techniques and indicators.

One way to do this is to look for a break above the resistance level, which can be identified using trendlines.

To confirm the trend reversal with trendlines, traders can draw a downtrend line and wait for the price to break above it.

This indicates that the bears have lost control and the bulls are now in control.

Another way to confirm the Piercing Pattern is to use support and resistance levels.

The pattern is typically formed at a key support level, and a break above the resistance level can indicate a potential trend reversal.

Traders can use previous highs and lows, or moving averages, to identify key support and resistance levels.

In addition to trendlines and support and resistance levels, traders can also combine the Piercing Pattern with price patterns and price action.

For example, traders can look for other bullish patterns such as the Bullish Engulfing Pattern or the Morning Star Pattern to confirm the trend reversal.

They can also look for bullish price action such as a long white candlestick or a series of higher highs and higher lows to further confirm the trend reversal.

Traders can also use trend-following technical indicators such as moving averages and the moving average convergence divergence (MACD) to confirm the trend reversal.

These indicators can help identify the direction of the trend and confirm that the bulls are in control.

Oscillator indicators such as the relative strength index (RSI) and stochastics can also be used to confirm the trend reversal.

These indicators can help identify overbought or oversold conditions and confirm the strength of the trend reversal.

When trading the Piercing Pattern, it is important to consider where to enter the trade, where to place the stop loss, and where to take profit.

To enter the trade, it is recommended to wait for the white candlestick to close and then enter on a break above the high of the white candlestick.

The stop loss can be placed below the low of the white candlestick, while the take profit can be set at a key resistance level or based on the trader’s risk-reward ratio.

There are some limitations to the Piercing Pattern that traders should be aware of.

One limitation is that the pattern is not always reliable and may not always signal a trend reversal.

In addition, the pattern can be easily faked out by false breaks or by the bears regaining control and pushing the price lower.

In conclusion, the Piercing Pattern is a bullish candlestick pattern that is formed after a downtrend and indicates a potential trend reversal.

It is important to confirm the pattern with other technical analysis techniques and indicators, such as trendlines, support and resistance levels, price patterns, price action, and technical indicators.

When trading this pattern, traders should consider where to enter, where to place the stop loss, and where to take profit.

While the pattern has some limitations, it can be a useful tool for traders looking to identify potential trend reversals.


ed seykota

If you would like to learn more about all the different candlestick patterns, also check out: “The Definitive Guide to Candlestick Patterns”

0 Comments/by Spencer Li
https://synapsetrading.com/wp-content/uploads/2022/12/Thumbnail-Piercing-Pattern-Candlestick-Trading-Strategy-Guide.png 720 1280 Spencer Li https://synapsetrading.com/wp-content/uploads/2019/10/logo.jpg Spencer Li2022-12-21 04:04:532023-01-10 01:44:12Piercing Pattern Candlestick Trading Strategy Guide
Spencer Li

Evening Star Candlestick Pattern Trading Strategy Guide

Technical Analysis & Price Action
Thumbnail Evening Star Candlestick Pattern Trading Strategy Guide

Thumbnail Evening Star Candlestick Pattern Trading Strategy Guide

The evening star candlestick pattern is a bearish reversal pattern that appears after an uptrend in a financial security’s price.

It is characterized by a long upper shadow, which indicates that buyers tried to push the price higher but failed, and a small real body, which suggests that there was little trading activity during the period.

The pattern gets its name from the fact that it looks like a star setting in the evening sky.

The psychology behind the evening star pattern is that it shows a shift in sentiment from bullish to bearish.

During an uptrend, buyers are in control and are pushing the price higher.

However, when the evening star pattern appears, it indicates that the buyers are losing strength and that sellers are starting to take control.

This shift in sentiment can be caused by a variety of factors, such as a change in market conditions, the release of negative news, or the appearance of bearish technical indicators.

To use the evening star pattern for trading, it is important to confirm that it is indeed a valid pattern.

This means looking for the following characteristics:

  1. The evening star must appear after an uptrend.
  2. The upper shadow must be at least twice as long as the real body.
  3. The real body should be at the lower end of the trading range.

If these criteria are met, then the evening star pattern is considered valid and can be used as a signal to sell or short the security.

There are several trading strategies that can be used with the evening star pattern.

One strategy is to sell or short the security when the pattern appears and place a stop loss order just above the high of the evening star.

This will protect against any potential upside movement in the security’s price.

Another strategy is to wait for another bearish candlestick pattern to confirm the reversal, such as a bearish engulfing pattern or a dark cloud cover.

When it comes to placing a take profit order, traders can use a variety of techniques.

One approach is to use a fixed take profit level, such as a specific price level or a percentage of the entry price.

Another approach is to use a trailing stop loss order, which allows the trader to lock in profits as the security’s price moves in the desired direction.

There are also some limitations to the evening star pattern that traders should be aware of.

The evening star pattern has several limitations that traders should be aware of when using it to trade financial securities.

One limitation is that the pattern is not always reliable, as the security’s price may continue to rise despite its appearance.

It can also produce false signals, particularly in choppy or sideways markets.

To improve its accuracy, traders can combine the evening star pattern with other technical analysis techniques and indicators, such as bearish divergence on the relative strength index (RSI) or the appearance of the pattern at key resistance levels.

In conclusion, the evening star candlestick pattern is a bearish reversal indicator that can be used in financial market trading.

To maximize its effectiveness, traders should verify its validity and utilize suitable stop loss and take profit orders.

It is advisable for traders to be cognizant of the pattern’s limitations and consider integrating it with other technical analysis techniques and indicators to improve its reliability.


ed seykota

If you would like to learn more about all the different candlestick patterns, also check out: “The Definitive Guide to Candlestick Patterns”

0 Comments/by Spencer Li
https://synapsetrading.com/wp-content/uploads/2022/12/Thumbnail-Evening-Star-Candlestick-Pattern-Trading-Strategy-Guide.png 720 1280 Spencer Li https://synapsetrading.com/wp-content/uploads/2019/10/logo.jpg Spencer Li2022-12-21 03:36:482023-01-10 01:47:15Evening Star Candlestick Pattern Trading Strategy Guide
Page 53 of 184«‹5152535455›»

Free Trading Guides

Free Trading Guides

Blog Categories

  • Beginner's Guide
  • Blockchain & Crypto
  • Book Summaries
  • Economics & News Trading
  • Investing & Portfolio Management
  • Living Your Best Life
  • Market Analysis
  • Markets & Products
  • News & Events
  • Promotions
  • Risk & Money Management
  • Stock Trading
  • Technical Analysis & Price Action
  • Testimonials
  • Tools & Resources
  • Trading Psychology
  • Trading Strategies
  • Trading Tips
  • Travel & Lifestyle

Free Trading Guides

Free Trading Guides

Contact Us

Synapse Trading Pte Ltd
Registration No. 201316168H

Whatsapp: +65-8897-1204
Telegram: @iamrecneps
Email: info@synapsetrading.com

Links

Disclaimer
Privacy policy
Terms & Conditions
Contact us
Partnerships

© 2012-2024 Synapse Trading | All rights reserved | - powered by Enfold WordPress Theme
  • Link to Facebook
  • Link to X
  • Link to Instagram
  • Link to Youtube
  • Link to LinkedIn
  • Link to Mail
Scroll to top Scroll to top Scroll to top