• Link to Facebook
  • Link to X
  • Link to Instagram
  • Link to Youtube
  • Link to LinkedIn
  • Link to Mail
Synapse Trading
  • Home
  • About
    • My Background
    • My Trading Journey
    • My Travel Log
    • Media & Interviews
  • Mentoring
    • Trading Mastery Program
    • Results & Testimonials
  • Signals
    • Daily Trading Signals
    • Daily Trading Signals (Results)
  • Telegram (Free to join!)
  • Resources
    • Free Trading Guides
    • Tools & Resources
    • Blog & Infographics
  • Contact
    • Contact Us
    • Partnership Opportunities
  • Click to open the search input field Click to open the search input field Search
  • Menu Menu
Spencer Li

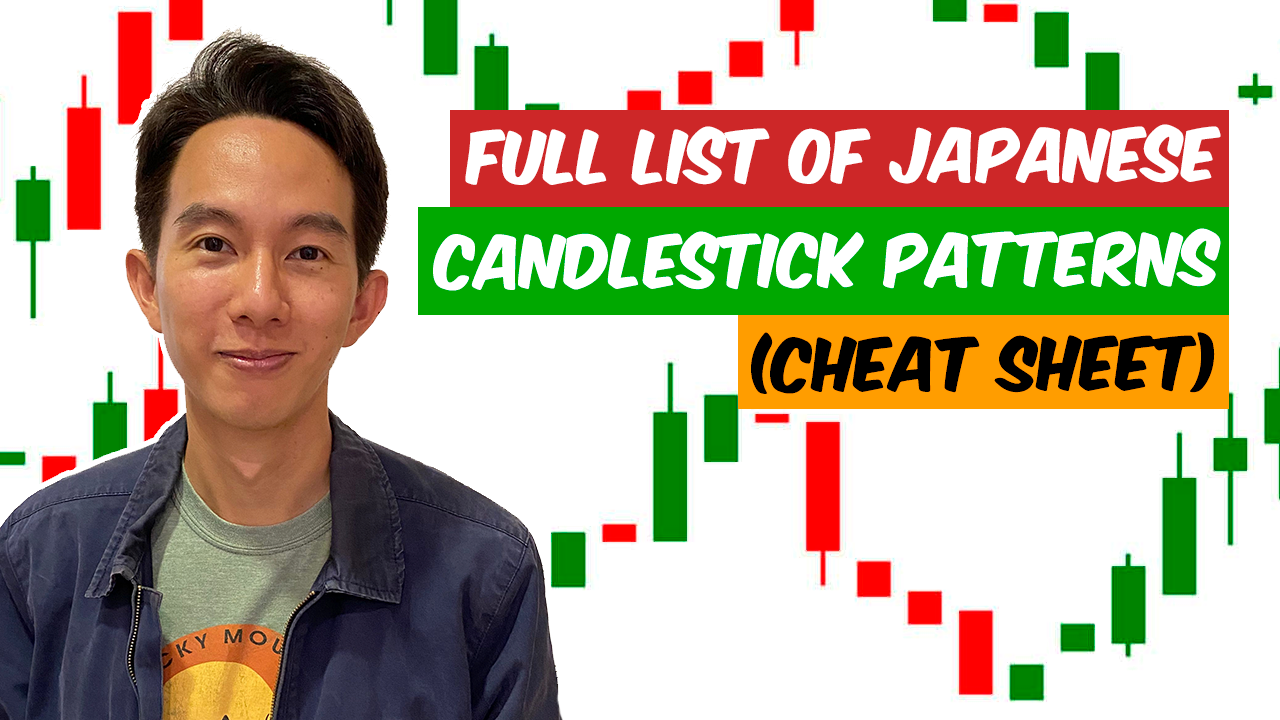
Full List of Japanese Candlestick Patterns (Cheat Sheet)

Technical Analysis & Price Action
Thumbnail Full List of Japanese Candlestick Patterns Cheat Sheet

Thumbnail Full List of Japanese Candlestick Patterns Cheat Sheet

There are many different candlestick patterns that can be used in technical analysis to interpret price data and make trading decisions.


Bullish vs. Bearish Candlestick Patterns

Bullish and bearish candlestick patterns are used in technical analysis to interpret price data and make trading decisions.

Bullish patterns suggest a potential uptrend and are generally seen as positive signals, while bearish patterns suggest a potential downtrend and are generally seen as negative signals.

Here is a list of some common candlestick patterns:

Bullish Candlestick Patterns:

  • Hammer pattern: a small body and a long lower shadow, considered to be a bullish reversal pattern
  • Hanging man: similar to the hammer pattern, but typically found at the top of an uptrend and considered to be a bearish reversal pattern
  • Bullish engulfing pattern: a large white candlestick that completely engulfs the preceding small black candlestick, considered to be a strong bullish reversal pattern
  • Morning star: a small black candlestick followed by a large white candlestick and a small black candlestick, considered to be a bullish reversal pattern
  • Three white soldiers: three long white candlesticks in a row, considered to be a strong bullish reversal pattern
  • Bullish harami: a small white candlestick inside the range of a large black candlestick, considered to be a bullish reversal pattern
  • Morning doji star: a small black candlestick followed by a doji pattern and a large white candlestick, considered to be a bullish reversal pattern
  • Bullish abandoned baby: a doji pattern with a gap above the doji, considered to be a bullish reversal pattern
  • Bullish meeting lines: two white candlesticks with the same open and close, considered to be a bullish reversal pattern
  • Bullish tasuki gap: a white candlestick with a gap below it, followed by a black candlestick with a gap above it, considered to be a bullish reversal pattern
  • Bullish three line strike: three white candlesticks with consecutively higher closes, considered to be a strong bullish reversal pattern
  • Bullish three inside up: a large black candlestick followed by a small white candlestick that is contained within the range of the black candlestick, considered to be a bullish reversal pattern
  • Bullish three outside up: a small black candlestick followed by a large white candlestick with a higher close, considered to be a bullish reversal pattern
  • Bullish three stars in the south: three small black candlesticks with consecutively lower closes, considered to be a bullish reversal pattern
  • Tweezer bottom: two or more candlesticks with equal lows, typically seen as a bullish pattern

Bearish Candlestick Patterns:

  • Shooting star: a small body and a long upper shadow, considered to be a bearish reversal pattern
  • Inverted hammer: similar to the shooting star pattern, but typically found at the bottom of a downtrend and considered to be a bullish reversal pattern
  • Bearish engulfing pattern: a large black candlestick that completely engulfs the preceding small white candlestick, considered to be a strong bearish reversal pattern
  • Evening star: a large white candlestick followed by a small black candlestick and a large white candlestick, considered to be a bearish reversal pattern
  • Three black crows: three long black candlesticks in a row, considered to be a strong bearish reversal pattern
  • Bearish harami: a small black candlestick inside the range of a large white candlestick, considered to be a bearish reversal pattern
  • Evening doji star: a large white candlestick followed by a doji pattern and a small black candlestick, considered to be a bearish reversal pattern
  • Bearish abandoned baby: a doji pattern with a gap below the doji, considered to be a bearish reversal pattern
  • Bearish meeting lines: two black candlesticks with the same open and close, considered to be a bearish reversal pattern
  • Bearish tasuki gap: a black candlestick with a gap above it, followed by a white candlestick with a gap below it, considered to be a bearish reversal pattern
  • Bearish three line strike: three black candlesticks with consecutively lower closes, considered to be a strong bearish reversal pattern
  • Bearish three inside down: a large white candlestick followed by a small black candlestick that is contained within the range of the white candlestick, considered to be a bearish reversal pattern
  • Bearish three outside down: a small white candlestick followed by a large black candlestick with a lower close, considered to be a bearish reversal pattern
  • Bearish three stars in the north: three small white candlesticks with consecutively higher closes, considered to be a bearish reversal pattern
  • Tweezer top: consists of two or more candlesticks with equal highs, typically seen as a bearish pattern

Neutral Candlestick Patterns:

  • Doji: a small body with long upper and lower shadows, considered to be a neutral pattern indicating indecision or a lack of direction in the market
  • Spinning top: similar to the doji pattern, but with a slightly larger body, considered to be a neutral pattern
  • Gravestone doji: a doji pattern with a long upper shadow, considered to have more bearish bias
  • Dragonfly doji: a doji pattern with a long lower shadow, considered to have more bullish bias
  • Tri-star doji: composed of three doji patterns in a row, considered to have more bearish bias.
  • Four price doji: a doji pattern with open, high, low, and close all at the same price, considered to be a neutral pattern

It is important to remember that there are many different candlestick patterns that can be used in technical analysis, and the list of patterns could potentially go on indefinitely.

However, it is important to keep in mind that candlestick patterns should be used in conjunction with other technical indicators and chart patterns, and should not be relied upon as the sole basis for trading decisions.

It is also important to understand the limitations of candlestick patterns and to be aware of the potential for subjectivity and interpretation in the analysis of these patterns.


ed seykota

If you would like to learn more about all the different candlestick patterns, also check out: “The Definitive Guide to Candlestick Patterns”


About the author. Spencer Li is the founder of Synapse Trading and a Certified Financial Technician (CFTe) with 15+ years of trading across stocks, forex, crypto, commodities, and bonds. His trade log is public: every trade since April 2024, dated, losses left in. He has taught a 15-minute daily trading routine since 2014, one system for any market.

Education, not financial advice. Synapse Trading is not licensed by MAS to advise on investment products. Trading carries risk of loss; past performance is not indicative of future results.

0 Comments/by Spencer Li
https://synapsetrading.com/wp-content/uploads/2022/12/Thumbnail-Full-List-of-Japanese-Candlestick-Patterns-Cheat-Sheet.png 720 1280 Spencer Li https://synapsetrading.com/wp-content/uploads/2019/10/logo.jpg Spencer Li2022-12-21 02:10:502026-10-05 12:13:38Full List of Japanese Candlestick Patterns (Cheat Sheet)
Spencer Li

What are Candlestick Patterns and How to Use them to Trade?

Technical Analysis & Price Action
Thumbnail What are Candlestick Patterns and How to Use them to Trade

Thumbnail What are Candlestick Patterns and How to Use them to Trade

Candlestick patterns are a type of chart pattern used in technical analysis to interpret price data and make trading decisions. These patterns are named after the shape of the candlestick chart that they form and can provide valuable insights into the sentiment and psychology of market participants.

The origin of candlestick patterns can be traced back to 18th century Japan, where they were developed by rice traders to analyze price movements in the rice market. The patterns were later introduced to the Western world by Steve Nison, who popularized them in his book “Japanese Candlestick Charting Techniques.”

There are several different types of candlestick patterns, including bullish patterns, bearish patterns, and neutral patterns. Bullish patterns indicate a potential uptrend and are generally considered to be positive signals, while bearish patterns indicate a potential downtrend and are generally considered to be negative signals. Neutral patterns, on the other hand, do not have a clear bullish or bearish bias and may indicate indecision or a lack of direction in the market.

Some common bullish candlestick patterns include the hammer, the hanging man, and the bullish engulfing pattern. The hammer pattern is characterized by a small body and a long lower shadow, and is considered to be a bullish reversal pattern. The hanging man pattern is similar to the hammer pattern, but is typically found at the top of an uptrend and is considered to be a bearish reversal pattern. The bullish engulfing pattern is characterized by a large white candlestick that completely engulfs the preceding small black candlestick, and is considered to be a strong bullish reversal pattern.

Some common bearish candlestick patterns include the shooting star, the inverted hammer, and the bearish engulfing pattern. The shooting star pattern is characterized by a small body and a long upper shadow, and is considered to be a bearish reversal pattern. The inverted hammer pattern is similar to the shooting star pattern, but is typically found at the bottom of a downtrend and is considered to be a bullish reversal pattern. The bearish engulfing pattern is similar to the bullish engulfing pattern, but is characterized by a large black candlestick that completely engulfs the preceding small white candlestick, and is considered to be a strong bearish reversal pattern.

There are also several neutral candlestick patterns, including the doji and the spinning top. The doji pattern is characterized by a small body and long upper and lower shadows, and is considered to be a neutral pattern that may indicate indecision or a lack of direction in the market. The spinning top pattern is similar to the doji pattern, but has a slightly larger body, and is also considered to be a neutral pattern.

There are both pros and cons to using candlestick patterns in trading. One of the main advantages of using candlestick patterns is that they can provide valuable insights into market sentiment and psychology, which can help traders to identify potential trend reversals or continuation patterns. Candlestick patterns are also relatively easy to interpret, even for traders who are new to technical analysis.

However, there are also some limitations to using candlestick patterns in trading. One of the main drawbacks is that candlestick patterns are based on past price data and do not necessarily provide a reliable prediction of future price movements. In addition, candlestick patterns can be subject to interpretation and may not always produce reliable signals.

To use candlestick patterns effectively in trading, it is important to consider them in the context of other technical indicators and chart patterns, such as trend lines, support and resistance levels, and moving averages. It is also important to understand the limitations of candlestick patterns and to be cautious when relying on them as the sole basis for trading decisions.

When using candlestick patterns to trade, it is important to consider the overall trend of the market and to look for patterns that confirm the trend or indicate a potential reversal. For example, if the market is in an uptrend, traders may look for bullish patterns such as the hammer or the bullish engulfing pattern as potential buy signals. If the market is in a downtrend, traders may look for bearish patterns such as the shooting star or the bearish engulfing pattern as potential sell signals.

It is also important to consider the context of the pattern and the overall strength of the signal. For example, a hammer pattern that appears after a long downtrend may be a stronger reversal signal than a hammer pattern that appears in the middle of an uptrend. Similarly, a bearish engulfing pattern that appears after a long uptrend may be a stronger reversal signal than a bearish engulfing pattern that appears in the middle of a downtrend.

In addition to considering the trend and the strength of the signal, traders may also want to consider the volume of trading activity and the overall liquidity of the market. Candlestick patterns may be more reliable in markets with high liquidity and strong trading volume, as they are more likely to reflect the sentiment and psychology of a large number of market participants.

Overall, candlestick patterns can be a valuable tool for traders looking to interpret price data and make informed trading decisions. By understanding the different types of patterns, the context in which they appear, and the limitations of the signals they provide, traders can use candlestick patterns to gain a deeper understanding of market sentiment and psychology and to make more informed trading decisions.


ed seykota

If you would like to learn more about all the different candlestick patterns, also check out: “The Definitive Guide to Candlestick Patterns”

0 Comments/by Spencer Li
https://synapsetrading.com/wp-content/uploads/2022/12/Thumbnail-What-are-Candlestick-Patterns-and-How-to-Use-them-to-Trade.png 720 1280 Spencer Li https://synapsetrading.com/wp-content/uploads/2019/10/logo.jpg Spencer Li2022-12-21 02:04:452023-01-10 01:49:02What are Candlestick Patterns and How to Use them to Trade?
Spencer Li

How to Profit from Inflation? (With 33 Types of Asset Investments)

Economics & News Trading
Thumbnail How to Profit from Inflation

How to Profit from Inflation: The Best Assets to Protect Your Money

Last updated: 3 July 2026 · By Spencer Li, CFTe


To profit from inflation, you hold assets whose value or income rises alongside prices, instead of holding cash that quietly loses purchasing power. The most reliable inflation hedges fall into three buckets: real assets (real estate, commodities, gold, agricultural land, infrastructure), inflation-linked bonds (TIPS and floating-rate notes, whose payouts move with rates), and equities with pricing power (companies that can pass higher costs on to customers, plus REITs, resource and infrastructure stocks). No single asset is a guaranteed win, and many of these only preserve your purchasing power rather than grow it. The honest goal here is defence first: stop inflation from eroding what you have, then look for the assets that genuinely benefit when prices rise.

Here is what inflation actually is, why it hits some people harder than others, and the full menu of assets people use to hedge it.

What is inflation?

Inflation is when the overall price of things goes up over time, so the same amount of money buys less. If a basket of groceries that cost you $100 last year costs $107 this year, that is inflation, and your $100 note is now worth less in real terms.

A few things can drive it: more demand chasing the same goods, higher production costs, or simply more money in the system. It can also show up when supply shrinks, for example during a war or a supply shock.

We measure it with the consumer price index (CPI, a tracked basket of things households typically buy). The percentage change in that basket over a period is the inflation rate. The Federal Reserve (the central bank in the US) leans on that rate when setting monetary policy.

Economists usually split inflation into three types:

  • Demand-pull (more demand than supply can meet)
  • Cost-push (rising production costs get passed on)
  • Structural (deeper problems in the economy, like poor resource use or chronic shortages)

Is inflation good or bad for the economy?

It is genuinely both, which is why it is so often misunderstood.

On the upside, mild inflation can nudge growth. If people expect prices to rise, they spend and invest sooner rather than later. It also quietly shrinks the real burden of debt, because the dollars you repay later are worth less than the ones you borrowed.

On the downside, inflation breeds uncertainty. When prices are hard to predict, people hesitate to make long-term plans, and that hesitation is its own drag on the economy. It also lands unevenly. People on low or fixed incomes feel it most, because their income does not stretch to cover the rising cost of living.

To keep prices stable, central banks use monetary policy, which means controlling the supply of money and credit. The Federal Reserve has three main levers: interest rates, reserve requirements, and open market operations.

How to profit from inflation: the asset menu

There is no single “inflation trade.” What works is owning the right mix of assets that either hold their value, pay income that keeps up with rising prices, or directly benefit when the cost of living climbs.

I have grouped the full menu below into four buckets so you can see the logic instead of staring at a flat list. Read the “Why it hedges” column carefully, because the reasoning is what tells you whether an asset fits your situation.

AssetBucketWhy it hedges inflation
CashDefensivePreserves purchasing power short term, but its real value erodes if you hold too much for too long. Reassess the amount you hold.
High-yield savings accountsDefensivePay more interest than a standard savings account. Rarely fully offset inflation, but soften the erosion.
Fixed deposits (term deposits)DefensiveFixed term, fixed rate, low risk. A parking spot, not a real hedge.
Stocks (general)Equities with pricing powerVolatile short term, but have historically performed well over the long run. Companies can pass higher costs to customers.
Small cap stocksEquities with pricing powerSmaller companies are more sensitive to the economy and can outperform large caps in inflationary periods.
Emerging market stocksEquities with pricing powerMarkets like China and India may be less affected by rising domestic costs at home.
High dividend-yielding stocksEquities with pricing powerA steady income stream that helps offset the hit to purchasing power.
Infrastructure stocksEquities with pricing powerUtilities and transport firms can pass higher costs through to consumers.
Natural resource stocksEquities with pricing powerOil, gas, and mining firms benefit when commodity prices rise and demand stays steady.
International stocksEquities with pricing powerForeign firms may dodge domestic cost pressure. Mind currency risk and political risk.
Preferred stocksEquities with pricing powerFixed dividend, priority over common stock in a wind-up. Steadier income, less inflation-sensitive than common stock.
Real estateReal assetsProperty values tend to rise over time, and as living costs climb, so can the asset.
Agricultural landReal assetsLand values tend to rise, and food demand stays stable even in hard times.
TimberlandReal assetsSteady demand for wood products, and the land itself can appreciate.
Commodities (gold, oil, agriculture)Real assetsPrices tend to rise directly with the cost of living. A classic hedge.
Infrastructure bondsInflation-linked / incomeFund roads, bridges, airports. Steady income, and the underlying assets can appreciate.
Floating rate bonds / notes (FRNs)Inflation-linked / incomePay a variable rate tied to a benchmark, so income rises as market rates rise.
Treasury Inflation-Protected Securities (TIPS)Inflation-linked / incomeUS government bonds engineered to return above the inflation rate.
Inflation-linked bonds (linkers)Inflation-linked / incomeReturns are tied directly to the inflation rate. Issued by governments or corporates.
Corporate bondsInflation-linked / incomeSteady income, but check the issuer’s creditworthiness. Value can still be dented by inflation.
Municipal bondsInflation-linked / incomeOften tax-free income from state and local government projects. Check the issuer’s credit.
Index funds (general)FundsTrack an index like the S&P 500. Diversified, good for long-term holders.
Real asset fundsFundsHold physical assets (property, commodities, infrastructure) that can appreciate with inflation.
Balanced fundsFundsA mix of stocks, bonds, and other assets for diversification and steadier results.
Infrastructure fundsFundsHold utilities, transport, and infrastructure bonds. Steady income plus appreciation potential.
Commodity fundsFundsHold a basket of commodities, so they ride rising commodity prices.
Real estate investment trusts (REITs)FundsOwn and operate property. Steady income, and real estate tends to appreciate.
Floating rate loan fundsFundsHold variable-rate loans, so income rises with rates and inflation bites less.
Municipal bond fundsFundsA basket of munis. Often tax-free income, less inflation-sensitive than other bonds.
Collectible assets (art, antiques, rare coins)AlternativesCan appreciate, especially in inflationary times. Hard to value and price; expect big swings.
Alternative investments (hedge funds, private equity)AlternativesPotential for higher returns and lower inflation sensitivity. Illiquid and riskier; not for everyone.
Cryptocurrencies (e.g. Bitcoin)AlternativesSome see them as a hedge because they are not tied to fiat currency. Highly volatile.
Master limited partnerships (MLPs)AlternativesOwn energy assets like pipelines. Steady income, and energy demand stays stable.

The pattern under all of this is simple. The assets that hedge inflation best are the ones that either own something real, lend at a rate that floats up with inflation, or sell something whose price they can raise. The assets that lose to inflation are the ones with a fixed payout and nothing real behind them.

Defence versus offence: an honest distinction

Here is the part most “profit from inflation” articles skip.

Most of the assets above defend your purchasing power. They stop the leak. They do not necessarily make you money. Holding cash in a high-yield account or buying TIPS is defence: you are trying not to fall behind.

A smaller set can actually outperform. Real assets and equities with genuine pricing power can rise faster than inflation, not just keep pace with it. That is offence.

Do note that, the two are different jobs, and you size them differently. Mixing them up is how people convince themselves a savings account is an “inflation strategy” when it is really just a slower way to lose.

Where the human edge comes in

A screener will hand you a list of “inflation hedges” in a second. That part is now free. What it will not do is tell you how much cash you can stand to hold without bleeding real value, which of these assets actually fits your time horizon and risk tolerance, or when an inflation theme is already priced in and the crowd is late. The list is the easy part. Judgment, sizing each position for the volatility it carries, and knowing which hedge the moment actually calls for is the work. That is the first of the Five Edges that no tool can trade for you.

Concluding thoughts

Inflation cuts both ways for an economy, and it quietly cuts into your personal finances whether you act or not.

Once you understand the menu, holding the right cash buffer, owning real assets and quality equities, or adding inflation-linked bonds, you can take real steps to protect the purchasing power of your wealth. Just keep two things in mind. Some of these strategies only minimise the damage rather than turn a profit. And no investment is a sure thing, so weigh the risks and rewards before you commit a single dollar.

FAQ

What is the best investment during inflation?
There is no single best one. Over the long run, real assets (real estate, commodities, gold) and equities with pricing power tend to perform well, while inflation-linked bonds like TIPS are built specifically to return above the inflation rate. The right mix depends on your time horizon and risk tolerance.

Is cash a good hedge against inflation?
Cash preserves purchasing power in the very short term and gives you flexibility, but its real value erodes the longer you hold it during inflation. A high-yield savings account softens the erosion, but rarely offsets inflation fully. Treat cash as a buffer, not a hedge.

How do TIPS protect against inflation?
Treasury Inflation-Protected Securities (TIPS) are US government bonds engineered to deliver a return above the rate of inflation, so their payout rises as inflation rises. That makes them one of the few assets designed from the ground up to hold real value when prices climb.

Why does real estate hedge against inflation?
Property values and rents tend to rise over time, often in line with the rising cost of living, so the asset and its income can keep pace with inflation. REITs (real estate investment trusts) give you similar exposure without owning a building directly.

Can stocks beat inflation?
Historically, stocks have outperformed inflation over the long run, because companies can pass higher costs on to customers through higher prices. They are volatile in the short term, so they suit long-term holders rather than anyone who needs the money soon.


Now that you have the full menu, which of these assets are you planning to add to your portfolio? And is there an inflation hedge I have missed? Let me know in the comments.

If you want the bigger picture on building a portfolio that holds up across different market conditions, read the pillar: The Definitive Guide to Investing and Building Wealth.

Want a simple system instead of a 30-item shopping list? Grab the free 15-Minute Swing Trading Starter Kit. It is the exact routine I use to scan once a day and trade any market in 15 minutes.


About the author. Spencer Li is the founder of Synapse Trading and a Certified Financial Technician (CFTe) with 15+ years of trading across stocks, forex, crypto, commodities, and bonds. His trade log is public: every trade since April 2024, dated, losses left in. He has taught a 15-minute daily trading routine since 2014, one system for any market.

Education, not financial advice. Synapse Trading is not licensed by MAS to advise on investment products. Trading carries risk of loss; past performance is not indicative of future results.


Related

Definitive Guide to Investing and Building Wealth (pillar) · How to invest in REITs · Asset allocation and diversification · Investing in commodities and gold

0 Comments/by Spencer Li
https://synapsetrading.com/wp-content/uploads/2022/12/Thumbnail-How-to-Profit-from-Inflation.png 720 1280 Spencer Li https://synapsetrading.com/wp-content/uploads/2019/10/logo.jpg Spencer Li2022-12-20 22:46:542026-10-05 12:13:44How to Profit from Inflation? (With 33 Types of Asset Investments)
Spencer Li

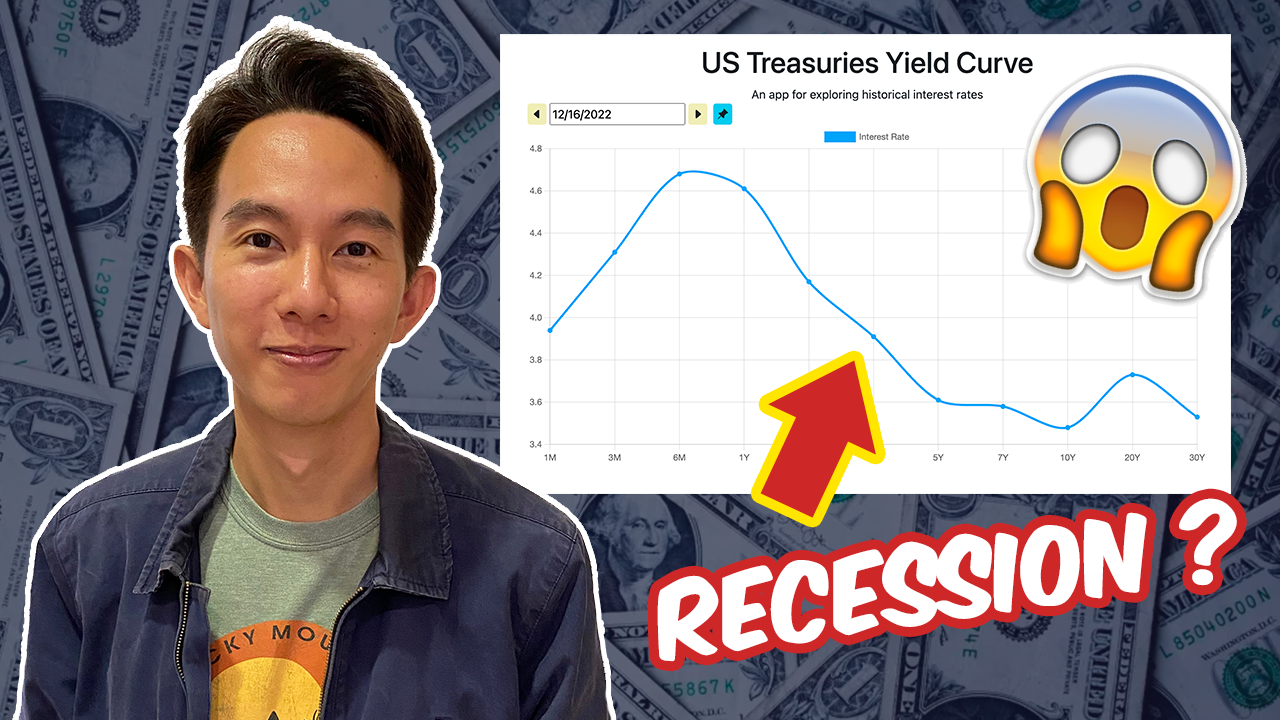
Does an Inverted Yield Curve Lead to Recession, and How to Invest in Such a Market?

Trading Tips
Thumbnail Does an Inverted Yield Curve Lead to Recession

Thumbnail Does an Inverted Yield Curve Lead to Recession

Looking to better understand the economy and financial markets?

The yield curve is a must-know!

This powerful tool shows the relationship between bond interest rates and payback times, giving us valuable insights into what people expect for economic growth and inflation.

But that’s not all – the yield curve can also impact financial institutions and even signal potential recessions.

In this blog post, I’m going to talk about what the yield curve is, why an inverted yield curve can lead to recession, and how to invest in such an environment.


What is the Yield Curve?

The yield curve is a chart that shows the relationship between the interest rate earned by investors on a bond and how long it will take for the bond to be repaid.

It’s usually plotted on a graph with the interest rate on the vertical axis and the time it takes to repay the bond on the horizontal axis.


normal yield curve

When the curve is going up, it means that bonds with longer payback times have higher interest rates than bonds with shorter payback times.

This is called a normal yield curve.


Yield Curve

When the curve is going down, it means that bonds with shorter payback times have higher interest rates than bonds with longer payback times.

This is called an inverted yield curve.

What Can the Yield Curve Tell Us?

The yield curve is a really important indicator of what’s going on in the economy because it gives us an idea of what people expect to happen with economic growth and inflation in the future.

A normal yield curve usually means that the economy is doing well and that people expect economic growth and inflation to pick up in the future, which is why they’re willing to accept lower interest rates on long-term bonds.

An inverted yield curve, on the other hand, often means that the economy isn’t doing so hot and that people expect economic growth and inflation to slow down in the future, so they want higher interest rates on long-term bonds.

What Affects the Shape of the Yield Curve?

There are a few things that can affect the shape of the yield curve.

One of the biggest factors is the level of short-term interest rates set by the central bank.

When the central bank raises short-term interest rates, it can lead to an upward sloping yield curve because investors want higher interest rates on long-term bonds to make up for the increase in short-term rates.

When the central bank lowers short-term interest rates, it can lead to a downward sloping yield curve because investors are willing to accept lower interest rates on long-term bonds due to the lower short-term rates.

The supply and demand for bonds can also affect the yield curve.

If there’s a lot of bonds available in the market, it can push down bond interest rates and lead to a downward sloping yield curve.

If there’s not a lot of bonds available, it can lead to higher bond interest rates and an upward sloping yield curve.

The expectations of market participants about future economic conditions can also influence the yield curve.

If people expect economic growth and inflation to pick up in the future, they might be willing to accept lower interest rates on long-term bonds in the hopes of getting higher returns later on.

This can lead to an upward sloping yield curve. If people expect economic growth and inflation to slow down, they might want higher interest rates on long-term bonds to make up for the lower expected returns.

This can lead to a downward sloping yield curve.

How Does an Inverted Yield Curve Lead to Recession?

Okay, so why does an inverted yield curve lead to a recession?

It’s all about how it can affect the behavior of businesses and consumers.

When the yield curve is inverted, with short-term rates higher than long-term rates, it can signal that investors are more worried about the short-term economic outlook.

This can make businesses less likely to borrow money for long-term projects, like building new factories or expanding operations.

And it can also make consumers less likely to take out long-term loans, like mortgages, to buy homes or cars.

When businesses and consumers are less likely to borrow and spend money, it can lead to a slowdown in economic activity, which can potentially turn into a recession.

An inverted yield curve can also affect the way banks and other financial institutions make lending decisions, which can further impact economic activity.

It’s important to note that the yield curve is just one indicator and no single indicator can predict the future with 100% accuracy.

But it can give us an idea of what people are expecting to happen with economic growth and inflation in the future, which can be helpful in understanding the potential risks and opportunities in the financial markets.

How to Invest in an Inverted Yield Curve Environment

So, you’re wondering how to invest during an inverted yield curve environment?

This can be tricky because an inverted yield curve is often seen as a sign of an impending recession, which is generally not good news for the economy.

However, there are a few strategies you can consider.

One option is to focus on defensive investments that tend to do well when times are tough.

These might include stocks in utilities, consumer staples, and healthcare companies, as well as bonds with shorter payback times.

Another strategy is to diversify your portfolio to include a mix of different types of assets.

This could mean stocks, bonds, real estate, and other alternative investments.

Diversification can help to spread out your risk and increase your chances of making some money over the long haul.

It’s also important to think about your investment time frame and risk tolerance.

If you have a longer time horizon and are comfortable with taking on some risk, you might be able to ride out market ups and downs and potentially benefit from a rebound.

But if you have a shorter time frame or are more risk-averse, it might be smart to be more cautious and reduce your exposure to risky assets.

Just keep in mind that investing during an inverted yield curve environment can be complicated and carries its own risks.

Concluding Thoughts

In conclusion, the yield curve is a really useful tool for understanding what people expect to happen with the economy and the potential risks and opportunities in the financial markets.

It’s important for investors, policymakers, and market participants to pay attention to the shape of the yield curve to get a sense of where the economy might be headed and what the potential implications might be.

Now that I have shared all about the inverted yield curve, what do you think are some of the best investment opportunities and strategies to use when the yield curve is inverted?

Let me know in the comments below.

0 Comments/by Spencer Li
https://synapsetrading.com/wp-content/uploads/2022/12/Thumbnail-Does-an-Inverted-Yield-Curve-Lead-to-Recession.png 720 1280 Spencer Li https://synapsetrading.com/wp-content/uploads/2019/10/logo.jpg Spencer Li2022-12-19 12:58:272023-01-10 01:50:52Does an Inverted Yield Curve Lead to Recession, and How to Invest in Such a Market?
Spencer Li

The Rise and Fall of FTX & FTT Token (Will Investors Get Their Money Back?)

Blockchain & Crypto
Thumbnail Rise and Fall of FTX

What Happened to FTX and Sam Bankman-Fried? The Collapse, the FTT Token, and the Lesson

Last updated: 2026-06-14 · By Spencer Li, CFTe


FTX was a major cryptocurrency exchange founded by Sam Bankman-Fried that collapsed in November 2022, going from a $32 billion valuation to bankruptcy in a matter of days. The trigger was its own token, FTT (the native token FTX issued and used on its platform). When rival exchange Binance announced it would sell its entire FTT position, worth around $529 million, the token’s price collapsed, customers rushed to withdraw, and the exchange could not cover them. FTX filed for Chapter 11 bankruptcy protection. Bankman-Fried was arrested in December 2022 on fraud charges, and the company was accused of undisclosed leverage, price manipulation, and self-dealing between FTX and its affiliated trading firm, Alameda Research. Investors and customers lost billions, and the replacement CEO, John Ray, said not all of it would be recovered.

The short version: a business propped up by a token it printed itself is only as solid as confidence in that token. When confidence broke, everything tied to it broke at once. Here is the full story, and the one lesson that actually protects you.

What is FTX?

FTX was a cryptocurrency exchange. A cryptocurrency exchange is a platform that lets people buy, sell, or trade cryptocurrencies for other assets, such as traditional fiat money (government-issued currency like USD) or other digital coins. Exchanges are the main place people get in and out of crypto.

They are not all the same. Some only let you trade specific pairs of coins; others offer a wide range. Some are built for professional traders, others for beginners. FTX positioned itself toward the serious end of that spectrum, and for a while it was treated as one of the more credible names in the industry.

What is the FTT token?

FTT was the native token of FTX, a cryptocurrency that FTX itself issued. It was used on the platform for various purposes, like paying fees and unlocking special features for traders.

Here is the part that matters. The value of FTT was closely tied to FTX’s own performance and reputation. So when FTX wobbled, FTT did not act like an independent asset that might hold its ground. It fell with the company. That circularity, a company leaning on a token whose price depends on the company, is the structural crack the whole story runs through.

How did FTX grow so quickly?

FTX scaled fast on aggressive marketing. It ran a Super Bowl ad campaign and bought the naming rights to the home arena of the Miami Heat basketball team. It got involved in political lobbying, made donations to various causes, and worked to position itself as a supporter of the broader crypto industry.

Timing helped too. The crypto market had been volatile and had seen significant growth in the years before, and that rising tide lifted FTX along with it. Big spend plus a hot market made the company look unstoppable. It was not.

The fall of FTX: how it unfolded

In November 2022, FTX filed for Chapter 11 bankruptcy protection after its valuation plummeted from $32 billion to nearly nothing in just a few days. That also wiped out most of Bankman-Fried’s net worth, previously estimated at around $16 billion. By his own account in November 2022, he had roughly $100,000 left in his bank account.

The collapse came after questions surfaced about how the company actually operated. FTX was accused of questionable practices: undisclosed leverage (borrowing the platform was not transparent about), manipulation of certain crypto prices, and allegations of insider trading and self-dealing between FTX and its affiliated trading firm, Alameda Research. As those concerns spread, confidence drained, and a business built on confidence cannot survive that.

Here is the sequence, stripped to the bones:

StageWhat happenedWhy it mattered
The setupFTX issued FTT and let its value ride on the company’s own reputationThe exchange and its token were not independent; they were one bet
The sparkBinance announced it would sell its entire FTT position, around $529 millionA large, public sell signal from a rival cracked confidence in the token
The runFTT’s price plummeted; customers rushed to withdraw fundsThe exchange could not cover withdrawals tied to a now-falling token
The collapseFTX filed for Chapter 11 bankruptcy; valuation fell from $32B to near zero in daysBillions in customer and investor money were frozen
The falloutBankman-Fried arrested (Dec 2022) on fraud charges; reputation destroyedOne of the largest financial frauds described in US history, per prosecutors

Binance’s CEO, Changpeng Zhao, framed the decision to liquidate the FTT holdings as protecting the interests of its users and the wider crypto community. Whatever the motive, the public announcement was the spark. Once a large, credible holder signals it is dumping a token, everyone else does the math on what that means for the issuer.

Why did FTX collapse? The shady practices

The legal trouble was not the only problem. As the situation developed, it became clear FTX had engaged in practices that should have been disclosed and were not.

  • Undisclosed leverage. Borrowing and risk-taking the platform did not make transparent to users.
  • Price manipulation. Allegations that FTX influenced the prices of certain cryptocurrencies.
  • Insider trading and self-dealing. Concerns about how money moved between FTX and Alameda Research, the affiliated trading firm.

A class-action lawsuit filed in Florida in November 2022 accused Bankman-Fried of building a fraudulent crypto scheme aimed at unsophisticated investors across the US. It named celebrities including Steph Curry, Shaquille O’Neal, Shohei Ohtani, Naomi Osaka, Larry David, and Kevin O’Leary as alleged accomplices for their roles promoting the platform. Bankman-Fried retained white-collar crime lawyer Mark S. Cohen, while Caroline Ellison, who led Alameda Research, retained the firm Wilmer Cutler Pickering Hale and Dorr.

Will FTX investors get their money back?

This is the question every affected customer asked, and the honest answer at the time was: probably not all of it, with a decent chance of getting at least something.

In December 2022, FTX and its affiliated debtors filed a motion with the bankruptcy court seeking approval to sell four businesses, including Embed, LedgerX, FTX Japan, and FTX Europe. The point of those sales was to raise funds to pay down FTX’s debts and return something to creditors. Bankruptcy recovery works like that: assets get sold, claims get ranked, and creditors are paid back in pieces over time, not refunded in full overnight.

Bankman-Fried had been seen as a leading figure in crypto. The allegations and the collapse destroyed that standing, his own and the company’s.

What is the lesson? Do your due diligence

So what do you actually take from all of this?

It is a cautionary tale about the risks of crypto, and a plain reminder to do your due diligence before putting money into any investment. Two specific red flags this saga hands you for free:

  1. A company leaning on a token it printed itself is a circular bet. If the asset backing the business is the same business’s coin, there is no independent floor under it.
  2. Where your money sits is its own risk, separate from what you are trading. Counterparty risk (the risk the platform holding your money fails) is real, and it does not show up on a price chart.

Personally, this is where I keep coming back to a point that has nothing to do with picking the right coin. A scanner can flag a price pattern. A research feed can pull a company’s headlines. Neither one will tell you to stand aside because the whole structure smells circular, or to keep your size small when the story sounds too good. That judgment, the decision to walk away from a thing everyone else is piling into, is the first of the Five Edges, and it is the part no tool trades for you. FTX did not fail because traders could not read a chart. It failed because trust was placed where it should not have been.

This is the kind of thing the Ultimate Guide to Blockchain and Cryptocurrencies is built to walk you through: how the plumbing actually works, so you can spot the cracks before they spread.

FAQ

What happened to FTX?
FTX was a cryptocurrency exchange that collapsed in November 2022, falling from a $32 billion valuation to bankruptcy in days. It filed for Chapter 11 bankruptcy protection after a crisis of confidence in its own FTT token triggered a wave of customer withdrawals it could not cover.

Why did FTX collapse?
The trigger was rival exchange Binance announcing it would sell its entire FTT position, around $529 million, which crashed the token’s price. Underneath that, FTX was accused of undisclosed leverage, price manipulation, and self-dealing between FTX and its affiliated trading firm, Alameda Research.

What is the FTT token?
FTT was the native token issued by FTX and used on its platform for fees and special features. Its value was closely tied to FTX’s own performance and reputation, so it fell along with the company rather than holding independent value.

Who is Sam Bankman-Fried?
Sam Bankman-Fried was the founder of FTX. Once estimated to be worth around $16 billion, he was arrested in December 2022 on fraud charges, in a case prosecutors described as one of the largest financial frauds in US history.

Will FTX customers get their money back?
Recovering the full amount was always unlikely, though there was a reasonable chance of getting at least part of it back. FTX sought to sell businesses including Embed, LedgerX, FTX Japan, and FTX Europe to raise funds and return money to creditors through the bankruptcy process.


The FTX story is dramatic, but the takeaway is boring on purpose: confidence is not collateral, and convenience is not safety. Were you one of the people who had funds trapped in FTX, or did you steer clear? Let me know in the comments.

If you want the bigger picture on how exchanges, tokens, and crypto plumbing actually work, read the pillar: The Ultimate Guide to Blockchain and Cryptocurrencies.

Want a calmer way to trade through chaos like this? Grab the free 15-Minute Swing Trading Starter Kit. It’s the exact routine I use to scan once a day and trade any market in 15 minutes, without betting the house on any single coin or exchange.


About the author. Spencer Li is the founder of Synapse Trading and a Certified Financial Technician (CFTe) with 15+ years of trading across stocks, forex, crypto, commodities, and bonds. His trade log is public: every trade since April 2024, dated, losses left in. He has taught a 15-minute daily trading routine since 2014, one system for any market.

Education, not financial advice. Synapse Trading is not licensed by MAS to advise on investment products. Trading carries risk of loss; past performance is not indicative of future results.


Related

Ultimate Guide to Blockchain and Cryptocurrencies (pillar) · What is Bitcoin and how does it work · How to spot a crypto scam · Risk management for traders

0 Comments/by Spencer Li
https://synapsetrading.com/wp-content/uploads/2022/12/Thumbnail-Rise-and-Fall-of-FTX.png 720 1280 Spencer Li https://synapsetrading.com/wp-content/uploads/2019/10/logo.jpg Spencer Li2022-12-18 14:37:032026-10-05 12:13:51The Rise and Fall of FTX & FTT Token (Will Investors Get Their Money Back?)
Page 55 of 184«‹5354555657›»

Free Trading Guides

Free Trading Guides

Blog Categories

  • Beginner's Guide
  • Blockchain & Crypto
  • Book Summaries
  • Economics & News Trading
  • Investing & Portfolio Management
  • Living Your Best Life
  • Market Analysis
  • Markets & Products
  • News & Events
  • Promotions
  • Risk & Money Management
  • Stock Trading
  • Technical Analysis & Price Action
  • Testimonials
  • Tools & Resources
  • Trading Psychology
  • Trading Strategies
  • Trading Tips
  • Travel & Lifestyle

Free Trading Guides

Free Trading Guides

Contact Us

Synapse Trading Pte Ltd
Registration No. 201316168H

Whatsapp: +65-8897-1204
Telegram: @iamrecneps
Email: info@synapsetrading.com

Links

Disclaimer
Privacy policy
Terms & Conditions
Contact us
Partnerships

© 2012-2026 Synapse Trading | All rights reserved | - powered by Enfold WordPress Theme
  • Link to Facebook
  • Link to X
  • Link to Instagram
  • Link to Youtube
  • Link to LinkedIn
  • Link to Mail
Scroll to top Scroll to top Scroll to top