• Link to Facebook
  • Link to X
  • Link to Instagram
  • Link to Youtube
  • Link to LinkedIn
  • Link to Mail
Synapse Trading
  • Home
  • About
    • My Background
    • My Trading Journey
    • My Travel Log
    • Media & Interviews
  • Mentoring
    • Trading Mastery Program
    • Results & Testimonials
  • Signals
    • Telegram (Free to join!)
    • Daily Trading Signals
    • Daily Trading Signals (Results)
  • Resources
    • Free Trading Guides
    • Tools & Resources
    • Blog & Infographics
  • Contact
    • Contact Us
    • Partnership Opportunities
  • Click to open the search input field Click to open the search input field Search
  • Menu Menu
Spencer Li

Monthly Market Wrap (June 2026)

Market Analysis

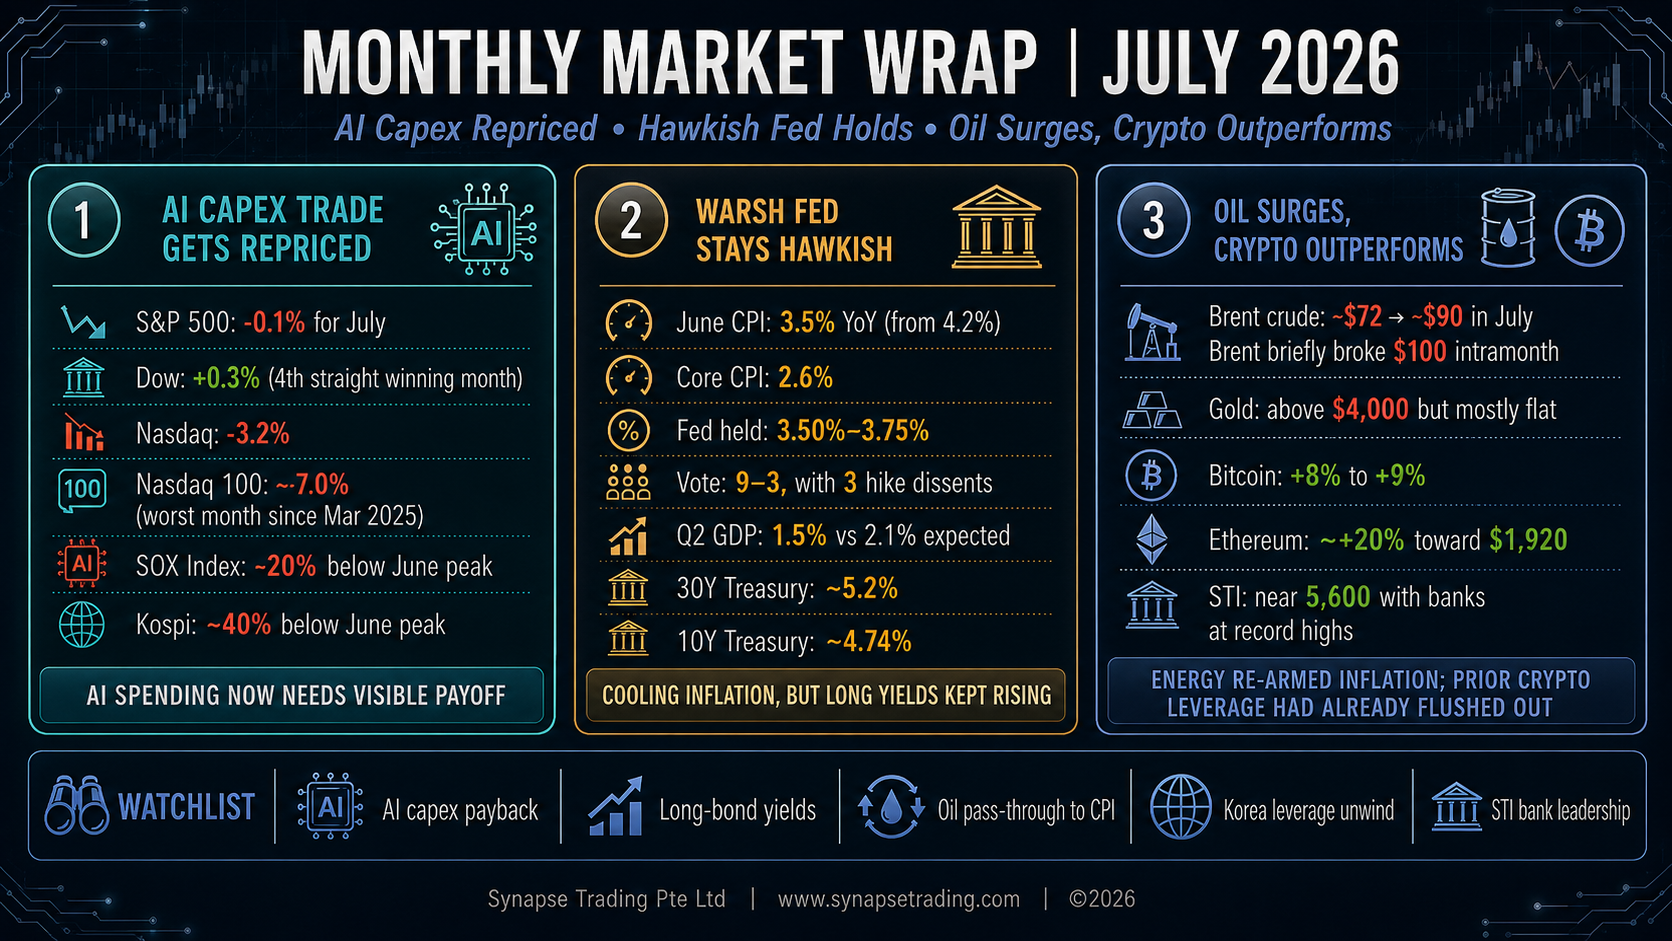
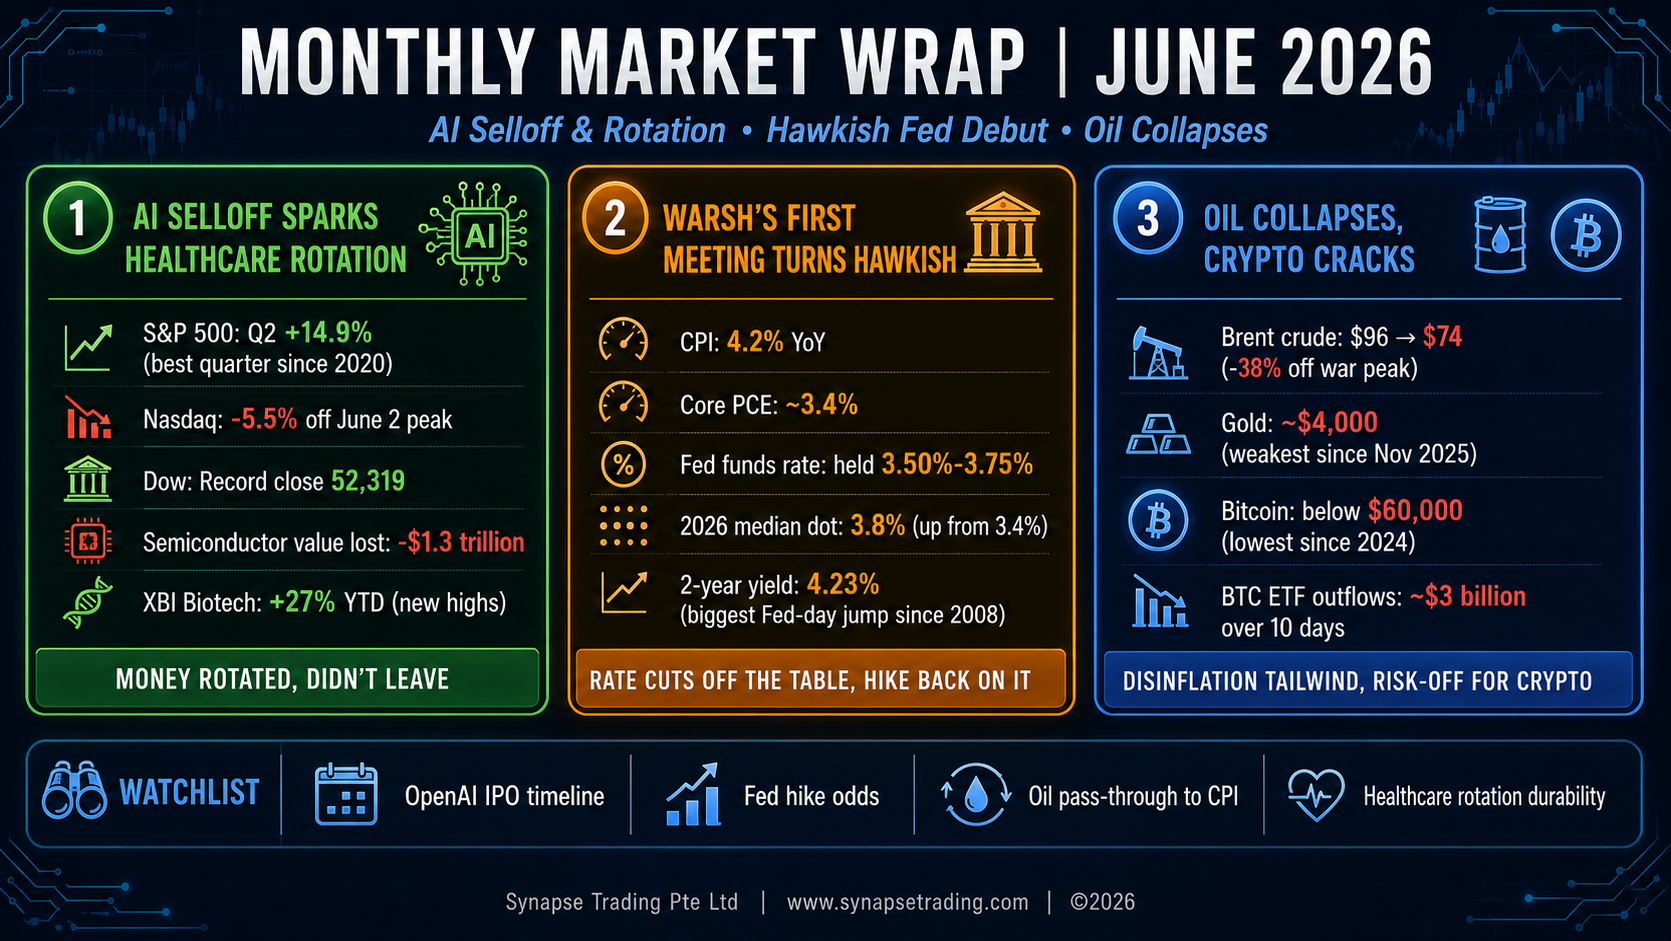
June was the month the market finally started arguing with itself. The first two days printed fresh record highs across the board, the middle of the month brought a hawkish new Fed chair and a savage AI selloff that wiped more than a trillion dollars off the chip names, and the final two sessions clawed most of it back. When the dust settled, the S&P 500 had booked its best quarter since 2020, up 14.9% for Q2, with the Nasdaq up about 21% and the Dow up roughly 13%. From a distance the tape looks calm. Up close it was anything but, and that is exactly the kind of market I find most instructive.

1. Global Equity Markets: A Record, a Rout, and a Recovery

The month opened with the melt-up still fully intact. On June 2 the S&P 500 closed above 7,600 for the first time ever, finishing at 7,609.78, its 24th record high of the year, while the Nasdaq set its own record near 27,093 and the Dow added 229 points to 51,307. AI infrastructure was still the engine, helped along by a blowout from Hewlett Packard Enterprise, which jumped about 25% on earnings and raised guidance, and by Marvell, which also ran roughly 25% after Nvidia CEO Jensen Huang said it could be the next trillion dollar company. That, in hindsight, was the top.

From there the character of the market changed completely. A hawkish Fed on June 17, which I will get to below, knocked the froth off, and then the real damage came from the AI trade itself. Late in the month, reports surfaced that OpenAI was leaning toward pushing its IPO from late 2026 into 2027, partly because SpaceX stock had round-tripped back toward its $150 debut price after listing earlier in June. The market read it as the first real crack in the AI-capex story, and it did not take the news well. Over a handful of sessions, roughly $1.3 trillion in semiconductor market value evaporated and the Nasdaq fell about 5.5% off its June 2 peak. Micron dropped 13% in a single session even after posting blowout numbers. South Korea’s KOSPI was halted limit-down more than once as Samsung and SK Hynix each fell 12%, with hundreds of billions wiped in days, and SoftBank shed more than 12% in Tokyo on the OpenAI overhang.

Here is the part worth remembering. The money did not leave the market, it rotated. While the Nasdaq was getting hit, the Dow kept printing record highs on strength in healthcare, financials and industrials. Breadth stayed healthy. This was a leadership change, not a risk-off panic, and it is a distinction that matters a great deal for how you position. Confuse the two and you sell the whole book when you should only be trimming one crowded corner of it.

The new leader was healthcare and biotech. The XBI biotech ETF broke out on June 17 and ran to fresh all-time highs, up about 27% year to date, while the Nasdaq was falling. Moderna was up 43% on the year at one point and finished as one of the top names in the S&P 500. The rotation was fed by a genuine M&A wave, something like $106 billion across 201 deals so far this year, plus solid clinical data and Eli Lilly momentum. Money coming out of crowded AI names had somewhere friendlier to go, and it went there in size.

The month ended with a two-day relief rip. On June 29 the market snapped back hard, with semis up over 3%, Alphabet joining the Dow and gaining about 5% on its first day as a component, and Tesla up 8.5%. Two tail risks came off the table at once: the Supreme Court blocked President Trump from firing Fed Governor Lisa Cook, protecting the central bank’s independence, and the US and Iran agreed to halt their tit-for-tat strikes. June 30 added to it, the Dow closed at a record near 52,319, the S&P finished around 7,499, and Nvidia, AMD and Intel led the chip rebound. For the month as a whole the big indices ended roughly flat to modestly changed after that violent round trip, but the Dow set fresh records and the quarter went into the books as one of the best in years.

Overseas, the pattern rhymed. Japan’s Nikkei pushed into record territory near 72,650 mid-month before dropping more than 4% in the AI rout. Singapore’s STI set a record around 5,242 on June 23 on bank and industrial strength. China held up better than Korea, but the KOSPI was the clear epicentre of the memory-chip selloff.

Table 1: Global Index Performance — June 2026

IndexJune Return / LevelKey MilestoneDriver
S&P 500Q2 +14.9% (best quarter since 2020)Record 7,609.78 on June 2; closed near 7,499AI melt-up, then Fed shock and AI selloff, then relief rally
Nasdaq CompositeQ2 ~+21%-5.5% off June 2 peak during the AI selloffHawkish Fed; OpenAI IPO-delay fears
Dow Jones Industrial AverageQ2 ~+13%Record close of 52,319 on June 30Rotation into healthcare, financials, industrials
KOSPI (South Korea)Halted limit-down multiple timesSamsung, SK Hynix -12%Epicentre of the memory-chip selloff
Nikkei 225 (Japan)Record ~72,650 mid-month, then -4%+Spillover from AI routRegional risk-off contagion
STI (Singapore)Record ~5,242 (June 23)All-time highBank and industrial strength
XBI Biotech ETF+27% YTDFresh all-time highs (June 17)Healthcare rotation; $106B M&A wave across 201 deals

2. Macroeconomic and Central Bank Developments

Inflation stayed hot and the Fed stayed hawkish. Those were the two facts that drove everything else.

The May CPI report, released June 10, showed headline inflation up 4.2% year over year and 0.5% for the month, with core CPI at 2.9%. Energy did most of the damage again, up 3.9% on the month for a 12-month gain of 23.5%, the lingering tax from the Iran war still working through the pipe. The Fed’s preferred gauge told the same story, with PCE running at its fastest pace in three years and core PCE sticky around 3.4%. Prices are not coming down, they are just rising a little less fast than the worst case, and the level is uncomfortably high.

The main event was the Fed meeting on June 17, Kevin Warsh’s first as chair. The committee held rates in the 3.50% to 3.75% range, which everyone expected. The shock was the dot plot. The median 2026 rate projection jumped to 3.8% from 3.4% in March, and nine of eighteen officials now pencil in at least one hike before year end. The rate-cut camp has basically vanished. Warsh himself declined to submit a dot, saying he prefers not to offer his own projections, but he left no doubt about the direction, hammering price stability and describing the committee as unanimous and unambiguous on fighting inflation. Officials lifted their 2026 inflation outlook to 3.6% headline and 3.3% core.

Markets got the message instantly. The 2-year Treasury yield jumped more than 16 basis points on the meeting day, the biggest Fed-day move since March 2008, and pushed to about 4.23%, the highest since February 2025. Think about what that means. A Fed chair appointed by a president who wants lower rates has instead delivered the most hawkish setup in years, with a real chance of a hike into year end. That tension is going to define the second half of 2026.

The labor market, for its part, kept cooling gently rather than breaking, which is the one thing keeping the soft-landing case alive. June payrolls were pulled forward to July 2 because of the holiday, so they landed just after the month closed. Elsewhere the Bank of England held at 3.75% in a 7-2 vote, and the Bank of Japan sat at a 1% policy rate, its highest since 1995.

Table 2: Key Macro and Fed Indicators — June 2026

IndicatorReported ValuePrior / ContextStrategic Implication
CPI (Headline, YoY)+4.2%MoM: +0.5%Inflation running well above target
Core CPI (YoY)+2.9%Underlying pressure remains sticky
Energy CPI+3.9% MoM; +23.5% 12-monthIran war tax still in the pipePrimary driver of the headline beat
Core PCE (YoY)~3.4%Headline at fastest pace in 3 yearsFed’s preferred gauge confirms the trend
Fed Funds RateHeld at 3.50%–3.75%Warsh’s first meeting as chairNo change, but tone shifted hawkish
2026 Median Dot3.8%Up from 3.4% in March9 of 18 officials now pencil in a hike
Fed 2026 Inflation Outlook3.6% headline; 3.3% coreRate-cut expectations effectively removed
2-Year Treasury Yield~4.23%+16bps on Fed day, biggest since March 2008Highest level since February 2025

3. Geopolitical and Commodity Developments

Oil was the whole story in commodities, and the story was collapse. Brent opened June near $96 a barrel with the war premium still fully priced, then fell all the way toward $74 by month end as the US and Iran de-escalated, agreed a 60-day oil waiver, and reopened the Strait of Hormuz. It was not a clean line down. Trump and Iran’s Pezeshkian signed a 14-point memorandum at Versailles on June 18, taking immediate effect, then Iran’s IRGC struck a Singapore-flagged vessel in the strait on June 25 and crude reversed higher, then over a weekend Iran declared Hormuz closed again and tanker transits briefly collapsed to single digits against a normal 93 a day before the US disputed the closure and traffic resumed. The direction was clear, though, and crude ended the quarter down roughly 38% off its war peak. That is a big disinflationary tailwind that will show up in future CPI prints, and it is the single most important offset to an otherwise hawkish macro picture.

Table 3: Commodities and FX Snapshot — June 2026

AssetJune Level / ChangeKey DriverOutlook Consideration
Brent Crude Oil~$96 to ~$74; -38% off war peakUS-Iran de-escalation; Hormuz reopenedDisinflationary tailwind for coming CPI prints
Gold (Spot)~$4,000; weakest since Nov 2025Firm dollar; rising rate-hike odds-25% off January’s $5,589 record; pressured while yields elevated
US Dollar (DXY)~101.3; 1-year highHawkish FedFurther strength possible if hike odds persist
Japanese Yen~162/USD; ~40-year lowBOJ-Fed policy gapContinued weakness risk

4. Corporate Earnings and Stock Movers

June was a heavy earnings month, and the results skewed strong even as prices wobbled. The tell of the whole month was that even blowout numbers could not hold a bid, which is classic late-cycle behavior.

Broadcom (AVGO) kicked things off on June 3 with record Q2 revenue of $22.2 billion, up 48%, and non-GAAP EPS of $2.44 against a $2.40 consensus. AI semiconductor revenue hit $10.8 billion, up 143%, and management guided Q3 AI revenue to $16 billion and full-year fiscal 2026 AI revenue to $56 billion, roughly 180% growth. The demand is unquestionably real. The question the rest of the month kept asking was whether the price already had all of it.

Oracle (ORCL) reported on June 10 with record Q4 revenue of $19.2 billion, up 21%, record cloud revenue of $9.9 billion, up 47%, cloud infrastructure up 93%, non-GAAP EPS of $2.11, and remaining performance obligations that ballooned by $85 billion to $638 billion. And yet the stock fell about 7% after hours, because capital spending guidance jumped toward $55.7 billion and investors are finally starting to ask what the return on all that AI spend actually is. That single reaction was a preview of the entire month.

Micron (MU) was the headline number of June. On June 24 it posted record fiscal Q3 revenue of $41.5 billion and adjusted EPS of $25.11, miles above the roughly $20.60 consensus, then guided the next quarter to a jaw-dropping $50 billion on AI and high-bandwidth-memory demand, with management describing the memory market as tight beyond 2027. The stock had been up nearly 300% on the year at its peak. And in the selloff it still dropped 13% in a single session. A great business and an overheated price are two different things, and June kept teaching that lesson to anyone who would listen.

The same memory shortage cut the other way for the device makers. Apple sank 6.12%, its worst day in over a year and roughly $265 billion of market cap gone, after hiking Mac and iPad prices, and Microsoft fell 3.23% after raising Xbox prices, both blaming the AI-driven memory and storage squeeze. So the memory suppliers win and the memory consumers pay up, and for the first time the Magnificent Seven visibly fractured rather than moving as one block.

FedEx delivered a fresh read on the real economy with Q4 revenue near $24.5 billion, up 13%, and EPS of $6.31, but the stock fell as CY2026 guidance of $16.90 to $18.10 underwhelmed despite projected second-half EPS growth around 20%. Accenture was worse, cratering 13.4% after cutting its fiscal 2026 outlook, a soft tell on enterprise AI spending that fits neatly with the Oracle worry. Among smaller names, AeroVironment jumped about 30% on earnings while Concentrix fell 22% on a miss. On the deal front, Rocket Lab agreed to buy satellite operator Iridium for roughly $8 billion, about $54 a share and a 24% premium, sending Rocket Lab up 15.9% and Iridium up 25.4% in a vertically integrated challenge to SpaceX. Nike and Constellation Brands closed the month reporting on June 30, with Nike limping into its print as one of the weakest Dow components, down about 35% year to date.

The talent war was its own signal. Google lost two of its most important AI researchers in 48 hours, with Gemini co-lead Noam Shazeer leaving for OpenAI on June 17 and AlphaFold Nobel laureate John Jumper heading to Anthropic on June 19. Alphabet fell about 5% on June 22 as investors tied the departures to both AI-spend worries and retention risk. Then, in a nice bit of irony, Alphabet joined the Dow at month end and popped 5% on its first day as a member.

Table 4: Notable Earnings and Stock Movers — June 2026

Company (Ticker)June Result / MoveKey MetricNotable Detail
Broadcom (AVGO)Reported June 3Revenue $22.2B (+48% YoY)Relentless AI demand
Oracle (ORCL)Reported June 10Record Q4 revenue $19.2B (+21%); cloud +47%Strong cloud acceleration
Micron (MU)Reported June 24; stock -13% in a single session despite the beatRecord revenue $41.5B; EPS $25.11; Q4 guide ~$50BUp ~300% YTD at peak before AI selloff swept it up
AeroVironment (AVAV)+~30% on earningsStrong beat
Concentrix (CNXC)-22%Earnings miss
Rocket Lab (RKLB)Agreed to buy Iridium~$8B dealM&A expansion

5. Commodities, Bonds, and Other Assets

Gold, oddly, did not benefit from any of the fear. It slid to around $4,000, its weakest since November 2025, and even cracked below $4,000 for the first time on June 24 with a 2.9% drop, while silver fell 4.6% on the same day and both Goldman and Deutsche Bank cut their targets. The metal now sits about 25% below its late-January record of $5,589. With war-driven fear draining, a firm dollar and rising rate-hike odds did the damage, a reminder that gold hates real yields more than it loves a crisis.

Bonds and the dollar told the hawkish story cleanly. Beyond the 2-year’s jump to about 4.23%, the 10-year yield peaked near 4.49% before easing back toward 4.40% late in the month as oil fell and growth worries crept in. Markets ended June pricing roughly an 80% chance of a December hike and about 63% for September. The dollar index climbed to a one-year high near 101.3, and the Japanese yen sank to roughly a 40-year low near 162. For bond investors, duration stayed the enemy, and the combination of sticky inflation and a hawkish repricing keeps me cautious on long-dated paper until the rate picture clears. On oil, Goldman trimmed its Q4 Brent forecast to $80 from $90 on the assumption that supply eventually normalizes.

6. Digital Assets: Crypto Gets Hit First

Bitcoin and Ethereum had an ugly month. Bitcoin started June around $66,000 and slid below $60,000 by the 25th, its lowest level since 2024, threatening its first weekly close below the 200-week moving average since October 2023, a line that tends to mark the boundary between a healthy correction and something worse. Ethereum fell in step, trading down toward the $1,560 area. The crypto Fear and Greed Index sank into extreme fear, bottoming somewhere in the teens. The drivers were the same ones hitting everything else, a hawkish Fed and vanishing rate cuts, plus heavy spot Bitcoin ETF outflows of roughly $3 billion over ten straight trading days and rumors of large-holder selling. Early in the month a broader crypto wipeout erased around $2 trillion in market value. When rates are pushing up and risk appetite is draining, the highest-beta assets always pay first, and in June they did.

Table 5: Digital Asset Performance — June 2026

AssetJune HighEnd of Month LevelKey Observation
Bitcoin (BTC)~$66,000 (start of month)Below $60,000 (June 25); lowest since 2024Threatened first weekly close below 200-week MA since Oct 2023
Ethereum (ETH)~$1,560Fell in step with Bitcoin

7. Summary and Outlook for July 2026

June was a round trip that ended better than it looked in the middle. Stocks set records in the first two days, then the AI-capex trade cracked when OpenAI signalled an IPO delay, dragging the semiconductors down more than a trillion dollars and briefly freezing the Korean market. But the money rotated into healthcare, biotech and industrials rather than leaving, breadth held up, and a two-day quarter-end rally left the Dow at a record and the S&P near its highs. Q2 finished as the best quarter since 2020.

The bigger picture is a genuine regime tension. Inflation is still running above 4% headline, oil has collapsed which helps going forward, and a hawkish new Fed under Kevin Warsh has taken rate cuts off the table and put a hike back on it. That combination is why the 2-year yield is at multi-year highs, why gold and crypto both got hit despite all the noise, and why leadership quietly shifted from the crowded AI trade to healthcare and value. The AI story is not over, but June was the first month it had to prove itself rather than just being assumed.

In terms of positioning, the approach that has worked all year still applies with one adjustment. Ride the existing winners with disciplined stops rather than chasing them, look for entries on pullbacks instead of breakouts at these levels, and keep the healthcare and biotech rotation firmly on the radar because that is where the fresh leadership is. Stay short duration in bonds until the Warsh Fed shows its full hand, treat gold as a core hedge but expect chop while real yields climb, and stay patient on crypto until it can hold a level rather than break one. Personally, I would rather trade a market that argues with itself than one that only knows how to go up. The arguing is where the opportunities live.

If you want to keep pace with these moves as they happen, rather than reading about them a month later, that is exactly what we do together inside the community. Come join us.

0 Comments/by Spencer Li
https://synapsetrading.com/wp-content/uploads/2019/10/logo.jpg 0 0 Spencer Li https://synapsetrading.com/wp-content/uploads/2019/10/logo.jpg Spencer Li2026-07-03 15:07:492026-07-04 12:55:12Monthly Market Wrap (June 2026)
Spencer Li

Monthly Market Wrap (May 2026)

Market Analysis

The month of May 2026 will be remembered as the moment two structural forces — the AI earnings supercycle and the Iran war’s de-escalation — combined to produce one of the most dramatic equity rallies in a generation. The S&P 500 closed out nine consecutive weekly gains, its longest winning streak since December 2023, powered almost entirely by a technology sector that reported blended earnings growth of 28.6% against a backdrop of rising inflation, a new Federal Reserve chair, and a geopolitical environment that remained fragile even as it improved. The rally was real, the earnings were genuine, and the narrowness of the leadership was a warning. Markets are entering June with record index levels, a tentative Iran peace deal, and a macro setup that will punish any complacency.

1. Equity Markets: Record Highs on Narrow Foundations

US equity markets delivered a historic month. The S&P 500 rose approximately 5.3% in May, extending a nine-week winning streak that ranks among the longest in four decades. The Dow Jones Industrial Average crossed the 51,000 milestone for the first time in its history, while the Nasdaq Composite surged 8.9% to close near 26,972. The Nasdaq 100 outperformed even that, gaining 10.6% as mega-cap technology names once again did the heavy lifting for the entire market.

The divergence beneath the surface, however, was stark. Of the 500 S&P 500 constituents, only 215 finished May in positive territory, while 285 closed in the red. The index hit all-time highs while the majority of its components declined — a structural dynamic that reflects the extraordinary concentration of AI-driven capital spending into a narrow cohort of beneficiaries. The technology sector as a whole advanced roughly 20%, accounting for all ten of the index’s top monthly performers. This kind of leadership narrowness has historically been a late-cycle signal worth monitoring closely.

Table 1: Major Index Performance — May 2026

IndexMay ReturnKey Level / MilestoneDriver
S&P 500+5.3%All-time high; 9-week win streakAI earnings; Iran de-escalation
Nasdaq Composite+8.9%~26,972Mega-cap tech; AI infrastructure
Nasdaq 100+10.6%Best monthly gain of 2026Semiconductor and cloud names
Dow Jones Industrial AverageMilestoneFirst-ever close above 51,000Broad risk appetite
Nikkei 225PositiveFresh record highs at month-endEasing Middle East tensions; energy imports
Shanghai CompositePositiveHighest level since 2015 (11-year high)Stronger industrial profit data
Hang SengLaggedUnderperformed regional peersRegulator crackdown on offshore brokerages
STOXX 600 (Europe)~+2%Modest gainsIran peace relief vs. energy inflation

Global markets participated in the rally with notably less conviction than US equities. Japan’s Nikkei benefited from easing Middle East tensions, which carry outsized significance for an economy dependent on energy imports. China’s Shanghai Composite climbed to an 11-year high supported by improving industrial profit data, though the Hang Seng lagged after the securities regulator moved against offshore online brokerages serving mainland investors. Europe’s STOXX 600 posted gains of just under 2%, caught between relief over Iran peace progress and the ongoing inflation drag from elevated energy prices.

2. Macroeconomic Developments: Inflation Shock and a New Fed Chair

The macroeconomic backdrop in May was defined by the pass-through of energy-driven inflation working its way into reported data, and by the most consequential change in US monetary leadership in nearly a decade. Neither development was unambiguously market-friendly, yet equities absorbed both and kept climbing — a testament to the earnings momentum underneath, and a warning about the assumptions embedded in current valuations.

The April CPI report, released on May 12, showed headline inflation rising 0.6% month-on-month and 3.8% year-on-year — the highest annual reading since May 2023. Energy was the primary driver, with the gasoline index up 28.4% year-on-year and the energy component accounting for over 40% of the monthly increase in isolation. Core CPI rose 0.4% for the month and 2.8% year-on-year, indicating that inflationary pressure is not confined to energy. Real average hourly wages declined 0.5% in April, meaning the purchasing power of workers is actively contracting.

The Fed’s preferred gauge confirmed the trend. The April PCE report, released on May 28, showed headline PCE accelerating to 3.8% year-on-year from 3.5% in March — also a three-year high — while core PCE rose to 3.3%. The personal saving rate dropped to 2.6%, its lowest level since June 2022, as households depleted savings to cope with rising costs. Americans are not absorbing this inflation comfortably; they are funding it by drawing down their financial cushion.

The labor market continued to moderate. April nonfarm payrolls came in at 115,000, well above the 55,000 consensus but down from a strong March print. The unemployment rate held at 4.3%, average hourly earnings rose 3.6% year-on-year, and the labor force participation rate slipped to 61.8%, its lowest since October 2021. The economy is generating jobs, but the directional trend is clearly one of deceleration.

Table 2: Key US Macroeconomic Indicators — April 2026 Data (Released in May)

IndicatorReported ValuePrior / ConsensusStrategic Implication
CPI (Headline, YoY)+3.8%Prior: ~3.5%; Highest since May 2023Inflation moving in the wrong direction
CPI (Headline, MoM)+0.6%Energy: 40%+ of monthly increasePass-through from Iran war shock
Core CPI (YoY)+2.8%MoM: +0.4%Broad price pressure; not just energy
PCE (Headline, YoY)+3.8%Prior: +3.5%; Three-year highFed’s preferred gauge confirms trend
Core PCE (YoY)+3.3%Above Fed’s 2% targetRate cut probability near zero
Personal Saving Rate2.6%Lowest since June 2022Households depleting buffers
Nonfarm Payrolls (Apr)+115,000Consensus: +55,000Beat, but trend is decelerating
Unemployment Rate4.3%SteadyLabor market cooling gently
Average Hourly Earnings (YoY)+3.6%Softer than expectedReal wages negative; consumer squeeze

The defining institutional event of the month was the confirmation of Kevin Warsh as Federal Reserve Chair. Confirmed by the Senate on May 13 in a 54-to-45 vote and sworn in as Powell’s replacement on May 15 — Powell having chosen to remain on the Board of Governors — Warsh inherits one of the most uncomfortable setups a new central banker could ask for. Rates are sitting at 3.50%–3.75% following the Fed’s April pause, and inflation is moving upward rather than toward target.

The market reaction was significant. Rate cut expectations for 2026 have effectively evaporated. Futures markets are now assigning roughly 40% probability to a rate hike by the December meeting. The dynamic is politically awkward: a Fed chair nominated by an administration that campaigned on lower rates may be forced to raise them. How Warsh navigates that tension — and how the market prices it — will be among the most important themes of the second half of the year.

3. Geopolitical Developments: Iran, De-escalation, and the Strait of Hormuz

The Iran war, which began in late February with joint US-Israeli airstrikes, remained the central geopolitical variable in markets throughout May. But the direction of travel shifted decisively. Where March and April were defined by the shock of open conflict and the closure of the Strait of Hormuz, May was defined by the painstaking construction of an off-ramp.

Building on the temporary ceasefire announced in early April, US and Iranian negotiators worked through May toward a broader framework. President Trump called off planned strikes on May 19. By May 23, he was describing a deal to reopen the Strait of Hormuz as “largely negotiated.” By May 28, negotiators had reached a tentative 60-day memorandum of understanding: an extended ceasefire, formal negotiations on Iran’s nuclear program, a temporary moratorium on uranium enrichment, discussions over sanctions relief, and a phased reopening of Persian Gulf maritime trade routes.

As of month-end, Trump had not given final sign-off and Iran had not formally confirmed acceptance, leaving the agreement tentative. The path was not smooth — on May 25, US forces conducted strikes on missile launch sites and boats in southern Iran in what Central Command described as defensive actions, a reminder that the ceasefire remains fragile. Markets also had to absorb a false peace report on May 28 that briefly moved prices before being retracted.

Nonetheless, the net market effect was unambiguous. The Strait of Hormuz handles roughly 20% of global oil trade. Each step toward reopening it lifted equities and pressured oil lower. The peace trade was arguably the single most important driver of risk appetite in the back half of the month, and its resolution — or breakdown — will determine much of the macro setup heading into Q3.

4. Corporate Earnings: The AI Supercycle Delivers

Q1 2026 was one of the strongest earnings seasons in S&P 500 history. With 97% of companies having reported by month-end, 85% exceeded EPS estimates and 81% beat on revenues. Blended year-on-year earnings growth came in at 28.6% — more than double the 13.1% expected at the end of March. The driver was the AI infrastructure buildout flowing through to revenues and margins across the technology supply chain. The headline numbers were not statistical noise; they reflected genuine demand for data centers, semiconductors, and cloud platforms at a scale that has reset the earnings bar for the sector.

Table 3: Notable Stock Movers — May 2026

Company (Ticker)May PerformanceKey MetricNotable Detail
Dell Technologies (DELL)+101% (best month ever; top S&P 500 performer)Revenue +88% YoY; EPS $4.86 vs $2.96 consensusAI-optimized server revenue +757% YoY to $16.13B; $24.4B in AI orders; raised FY AI server guidance to ~$60B
Micron Technology (MU)~+88%HBM demand surgeBeneficiary of high-bandwidth memory demand for AI servers; AI trade broadening to memory
Snowflake (SNOW)~+87%+36% in a single session (best day ever)Beat estimates on AI momentum; announced ~$6B, 5-year cloud and AI infrastructure deal with AWS
Nvidia (NVDA)+18% YTD heading into print; slipped ~1.5% after hoursRevenue $81.6B (+85% YoY); EPS $1.87 vs $1.76 consensusData center revenue $75.2B (+~100% YoY) = 92% of sales; boosted dividend to $0.25; $80B buyback announced
Palantir (PLTR)~+10%Sympathy moveRose on Dell results as validation of joint “AI factory” partnership
Zoetis (ZTS)Sharp declineEPS $1.53 vs $1.61 consensus missCut full-year revenue and earnings guidance
AutoZone (AZO)DeclinedBeat on earnings but sold offGross margin contraction of 57 basis points; market punished margin weakness despite top-line beat

Dell’s result deserves emphasis. Revenue of $43.84 billion represented an 88% year-on-year increase and a 23% beat against consensus — figures that would have been considered implausible as recently as eighteen months ago. AI-optimized server revenue of $16.13 billion, up 757% year-on-year, and $24.4 billion in new AI orders in a single quarter reflect the scale of the infrastructure investment cycle underway. The stock’s 32% single-day gain and 101% monthly return made it the S&P 500’s top performer. Together with Micron and Snowflake, it confirmed that the AI trade has materially broadened beyond chip designers into servers, memory, and enterprise data infrastructure. The pattern from this and recent quarters is consistent: extraordinary rewards for confirmed AI beneficiaries, and swift punishment for any earnings miss or margin compression elsewhere.

5. Commodities and Fixed Income: Oil Retreats, Bonds Sell Off

Oil remained the asset class at the center of everything. Brent crude, which had broken above $100 per barrel at the height of the conflict, spent May grinding lower as peace prospects improved, trading around $96–$98 by late month — down roughly 9% from a month earlier but still more than a third higher than pre-war levels. Individual headlines on Iran negotiations produced violent intraday moves, including a 5% drop on mixed signals from Trump regarding the peace deal. If the Strait of Hormuz reopens on schedule, additional downside for crude is the base case; however, with the deal unsigned at month-end, the market is not yet pricing a full resolution.

Gold had a volatile month at historically elevated levels. Spot gold traded around $4,556 per ounce mid-month after pulling back approximately 2% from highs, caught between two opposing forces: war-driven inflation fears providing structural support, and rising real yields plus a strong dollar acting as a headwind. Central bank demand remained a consistent support with net purchases of 244 tonnes in Q1 2026, up 3% year-on-year, but the metal struggled to make meaningful progress against the rising opportunity cost of holding a non-yielding asset.

Bond markets had a difficult month. The 10-year Treasury yield climbed to 4.59% by mid-May, its highest level in nearly a year, as investors repriced the Fed from a cutting mode to a potential hiking mode. The US dollar was the natural beneficiary, posting its best weekly gain in two months around mid-month and strengthening through May as higher yields attracted capital flows. For fixed income investors, duration remains the enemy, and the combination of sticky inflation and the Warsh Fed’s uncertain policy trajectory suggests continued caution on long-dated paper until the rate picture clarifies.

Table 4: Commodities and Fixed Income Snapshot — May 2026

AssetMay Level / ChangeKey DriverOutlook Consideration
Brent Crude Oil~$96–$98 (late month); -9% MoMIran de-escalation; peace tradeFurther downside if Hormuz reopens; deal still unsigned
Gold (Spot)~$4,556/oz; -~2% from highsWar inflation fears vs. real yield headwindCentral bank demand structural support; chop while real yields climb
10-Year Treasury Yield4.59% (near 1-year high)Fed repricing from cuts to potential hikeStay short duration; Warsh Fed’s first FOMC critical
US Dollar (DXY)Strengthened; best weekly gain in 2 monthsRising US yields drawing capitalBeneficiary of higher-for-longer repricing

6. Digital Assets: A Notable Divergence from Equities

Crypto was conspicuously absent from the May equity rally, and the divergence was meaningful. Bitcoin began the month positively, climbing above $82,000 by May 6 — its highest level since January. The rally had no legs. BTC faded to approximately $77,000 by May 19 and spent the balance of the month largely range-bound. The real damage came at month-end: Bitcoin broke down sharply and opened June below $67,000. For a month in which the Nasdaq gained nearly 9%, Bitcoin finishing deep in the red represents a genuine break in the correlation between crypto and risk assets that has characterized much of 2024 and 2025.

Ethereum fared worse. ETH traded up to around $2,400 in early May before sliding to approximately $2,130 by mid-month, and by early June had broken below the psychologically significant $2,000 level. Ethereum has been persistently underperforming Bitcoin with no major catalyst on the horizon to reverse the trend. The relative weakness across both majors is consistent with capital rotating from crypto into AI equities, where earnings momentum is both real and accelerating. Until that flow reverses or Bitcoin establishes a new narrative, the tactical case for adding digital asset exposure is not compelling, and the late-May breakdown warns of further downside in the near term.

Table 5: Digital Asset Performance — May 2026

AssetMay HighEnd of May / Early June LevelKey Observation
Bitcoin (BTC)~$82,000 (May 6)Below $67,000 (early June)Broke down late month; diverged sharply from Nasdaq
Ethereum (ETH)~$2,400 (early May)Below $2,000 (early June)Broke key psychological level; persistent BTC underperformance

7. Synthesis and Strategic Outlook for June 2026

May 2026 delivered a rare and uncomfortable combination: record-breaking equity index levels powered by a genuine AI earnings supercycle, set against rising inflation, a new Fed chair navigating a policy environment that may require hiking rather than cutting, and a war winding down but not yet resolved. The S&P 500’s nine-week winning streak and the Dow’s first close above 51,000 were driven almost entirely by technology. Dell, Micron, and Snowflake posted some of the largest monthly gains in index history. The majority of index constituents, however, declined. That structural narrowness is the rally’s most significant vulnerability.

The macro backdrop is genuinely difficult. Inflation at 3.8% and trending higher, a softening labor market, a savings rate near cycle lows, and a market that has shifted from pricing rate cuts to pricing a possible hike under Kevin Warsh — these are not conditions that support expanding valuations on discretionary or rate-sensitive names. The bull case depends on three things holding simultaneously: the Iran peace deal advancing toward implementation, oil continuing to retreat toward pre-war levels, and AI earnings continuing to deliver results that justify the extraordinary multiples being assigned. Any one of those three failing would test this market quickly.

For positioning, the trend in AI infrastructure leaders remains firmly intact and fighting it has been costly, but chasing triple-digit monthly gains is not a strategy. Existing positions in AI winners should be held with disciplined stop placements; new entries are more sensible on pullbacks than at breakout levels from an already extraordinary run. Energy exposure remains a reasonable hedge: the peace deal is tentative, any negotiation breakdown would send Brent back toward $100, and the risk-reward on a small energy position remains asymmetric. Duration in bonds should be kept short until the Warsh Fed’s first FOMC meeting — scheduled for June — provides clearer signals on the new policy reaction function. Gold remains a sound core hedge given structural central bank demand, though expect volatility while real yields are elevated. For crypto, the late-May breakdowns in both Bitcoin and Ethereum argue for patience; stabilization and a reclaim of broken levels would be the minimum required before considering new exposure.

  1. Iran MOU Finalization: Trump’s final sign-off and Iran’s formal acceptance of the 60-day memorandum of understanding remain outstanding. The timeline for Hormuz reopening and the durability of any agreement are the most significant near-term macro variables for energy prices and risk appetite globally.
  2. June FOMC — Warsh’s First Meeting: The inaugural Federal Open Market Committee meeting under Kevin Warsh will provide the first concrete signal of the new policy regime. With inflation at 3.8% and futures pricing a meaningful probability of a hike, Warsh’s press conference tone will be as important as the rate decision itself.
  3. AI Earnings Durability Heading into Q2: The Q1 results from Dell, Nvidia, Micron, and Snowflake have set an exceptionally high bar. Whether the AI capex commentary holds up through Q2 results and whether software names can begin to demonstrate revenue conversion from AI investment will determine whether the current leadership concentration broadens or cracks.
  4. Consumer Health: With the personal saving rate at 2.6% and real wages negative, the US consumer is under pressure in a way that has not been visible in equity indices. Watch retail sales, credit card delinquencies, and consumer confidence data for signs that the demand destruction from energy inflation is beginning to show up in corporate revenues outside the technology sector.

The wall of worry is real and documented. So is the earnings power underneath this market. May demonstrated that both can coexist for longer than expected, driven by a structural technology cycle that is in only its middle innings. Stay long the proven AI infrastructure winners with defined risk, remain selective everywhere else, and treat the June FOMC and the Iran MOU outcome as the two events most likely to define the second half of 2026.

0 Comments/by Spencer Li
https://synapsetrading.com/wp-content/uploads/2019/10/logo.jpg 0 0 Spencer Li https://synapsetrading.com/wp-content/uploads/2019/10/logo.jpg Spencer Li2026-06-07 23:16:012026-06-07 23:16:01Monthly Market Wrap (May 2026)
Spencer Li

Monthly Market Wrap (April 2026)

Market Analysis

The global financial ecosystem in April 2026 operated at the intersection of a significant regional war and a transformative technological supercycle. While the month of March was characterized by the initial shock of open hostilities between the United States and Iran, leading to the effective closure of the Strait of Hormuz, April witnessed a profound decoupling of financial assets from geopolitical volatility. This period was marked by the S&P 500 delivering a 10.5% monthly return, a rare occurrence documented only 13 times in the last half-century, as investors looked past the immediate fog of war to capitalize on the accelerating artificial intelligence (AI) infrastructure build-out. The narrative of the month was one of structural economic resilience, where robust corporate earnings and productivity-enhancing business investment countered the headwinds of double-digit energy inflation and a hawkish shift in global monetary expectations.

1. Macroeconomic Momentum: The Transition to Investment-Led Growth

The U.S. economy demonstrated a notable acceleration in the first quarter of 2026, with the advance estimate of Real Gross Domestic Product (GDP) rising at an annual rate of 2.0%. This performance was particularly significant as it followed a period of stagnation at the end of 2025, where growth had slowed to a mere 0.5% amidst a federal government shutdown. The rebound suggests that the underlying momentum of the private sector remained intact despite fiscal disruptions. A critical driver of this growth was the quadrupling of Business Fixed Investment (BFI), which contributed 1.4 percentage points to the topline GDP figure. This surge in capital expenditure was led by an annualized 17.2% increase in business equipment and a 13.0% rise in intellectual property products, reflecting a strategic pivot by American corporations toward automation and software-driven productivity.

Table 1: U.S. Economic Indicators and GDP Composition (Q1 2026)

IndicatorValue / RateQuarterly Change / Contribution
Real GDP (Advance Estimate)+2.0%+1.5% from Q4 2025
Personal Consumption Expenditures (PCE)+1.6%+1.1 ppts
Business Fixed Investment (BFI)+10.0%++1.4 ppts
– Real Business Equipment+17.2%Leading Component
– Intellectual Property Products+13.0%Software Acceleration
– Data Center Structures+22.0%Infrastructure Boom
Private Domestic Final Purchases (PDFP)Solid Rate+2.2 ppts
Government Spending (State & Local)Rebound+0.7 ppts
Residential InvestmentContraction5th Consecutive Decline

The composition of growth indicates a bifurcated economy. While business investment flourished, residential investment continued its moderate contraction, marking the fifth consecutive quarter of decline. This downturn was primarily driven by a fall in single-family residence construction and a decrease in brokers’ commissions, highlighting the continued sensitivity of the housing market to elevated mortgage rates. However, the resilience of Private Domestic Final Purchases (PDFP)—which includes personal consumption, BFI, and residential investment—suggests that the domestic core of the economy is on a stable path, contributing 2.2 percentage points to growth. The labor market supported this stability, with initial jobless claims holding near 209,000 in early May, reinforcing the narrative of a “higher-for-longer” economic equilibrium where employment remains tight despite restrictive monetary conditions.

2. Inflationary Complexities: The Energy Shock and Pipeline Pressures

Inflation in April 2026 presented a challenging puzzle for policymakers, as core price moderation was offset by a massive energy-driven headline spike. Twelve-month core Consumer Price Index (CPI) inflation stood at 2.6% in March, showing a slight moderation from the previous year, yet monthly core inflation ticked up to an average of 0.2% per month in the first quarter. The primary source of concern, however, was the energy sector. Energy price inflation reached 12.5% on a twelve-month basis through March 2026, a stark contrast to the 3.3% decline recorded a year earlier. Gasoline prices, specifically, surged 18.9% over the twelve months ending in March, reflecting the immediate impact of the Persian Gulf disruptions on domestic fuel costs.

Table 2: U.S. Inflation Metrics – March 2026 (Released April 2026)

Category1-Month % Change12-Month % ChangeKey Drivers
All Items (Headline CPI)+1.0% (NSA)+3.3%Energy, Gasoline
Core CPI (Less Food & Energy)+0.2%+2.6%Shelter, Airfares
Energy Goods and Services+0.6%+12.5%Fuel Oil (+44.2%), Gasoline
Food at Home+0.2%+2.7%Meats (-0.9% YoY), Eggs (-3.4%)
Food Away from HomeStable+3.8%Service Labor Costs
Shelter+0.3%ElevatedRent, Owners’ Equivalent Rent
Airline Fares+2.7%+14.9%Energy Pass-through
Producer Price Index (PPI)+0.5% (SA)+4.0%Energy (+8.5%), Goods (+1.6%)

The Producer Price Index (PPI) data released in mid-April signaled that further consumer-level price hikes may be imminent. Final demand PPI rose 0.5% in March, with goods prices jumping 1.6%, driven largely by an 8.5% surge in energy components. Of particular concern to analysts is the widening gap between PPI core consumer goods and CPI core goods, which expanded to 2.1 percentage points in March from 1.0 percentage point in September 2025. This suggests that manufacturers and retailers are currently absorbing higher input costs that have not yet been fully reflected in consumer retail prices. Furthermore, the persistent elevation of “food away from home” inflation, which has remained in the 3.6%-4.0% range since mid-2024, points to a structural wage-price floor in the services sector that may resist the Federal Reserve’s efforts to reach its 2% target.

3. Central Banking and the Transition of Power at the Federal Reserve

The month of April was a period of high-stakes transition for the Federal Reserve. On March 4, 2026, President Trump formally sent the nomination of Kevin Warsh to the Senate to serve as the next Chairman of the Federal Reserve. The nomination aimed to replace Jerome Powell, whose term as chair expires on May 15, 2026. Warsh’s path to confirmation, however, was initially clouded by a criminal investigation into Jerome Powell regarding a $2.5 billion renovation of the Fed’s headquarters, a situation Senator Thom Tillis used as leverage to block Warsh’s hearing. The impasse broke on April 24, when U.S. Attorney Jeanine Pirro announced the end of the probe into Powell, clearing the way for Warsh to testify before the Senate Banking Committee.

During his testimony, Warsh sought to project an image of strict independence, stating that the President had never asked him to predetermine interest rate decisions. However, market participants noted that Warsh has echoed administration rhetoric regarding the role of AI in boosting productivity, suggesting that the economy can grow faster without triggering inflation—a stance that implies a more dovish outlook on the neutral rate. Despite this potential shift, the FOMC, still under Powell’s leadership, voted unanimously at the April 28-29 meeting to maintain the federal funds target range at 3.50%-3.75%. The committee’s implementation note also directed the Open Market Desk to continue increasing Treasury holdings to maintain an ample level of reserves, signaling a preference for stability during the leadership handover.

Table 3: Global Central Bank Posture (April 2026)

InstitutionPolicy RateApril ActionPolicy Outlook
Federal Reserve3.50% – 3.75%Hold (Unanimous)Warsh nomination; 0 cuts priced for 2026.
Bank of Japan~0.75%Hold (6-3 Vote)Increasing hawkish dissent; June hike possible.
European Central Bank2.00%HoldJune hike signaled if energy prices stay high.
Bank of England5.00%+ (implied)N/AGilt yields at 18-year highs; inflation concern.

Internationally, the trend toward tighter policy was more pronounced. The Bank of Japan (BoJ) kept its overnight call rate at 0.75% at its April 28 meeting, but the decision was a narrow 6-3 majority. Three board members—Nakagawa, Takata, and Tamura—voted for an immediate hike to 1.0%, citing the achievement of price stability targets and the upside risks posed by overseas developments and second-round price effects. This high level of internal dissent suggests that Japan’s exit from accommodative policy is accelerating. Similarly, the European Central Bank (ECB), while holding its deposit rate at 2.0% on April 30, noted that officials debated a rate increase during the meeting. President Lagarde signaled that a June hike is likely if energy prices continue to pressure Eurozone CPI, which was estimated at 3.0% for April.

4. Geopolitical Turmoil: The Strait of Hormuz and Peace Proposals

The ongoing conflict between the United States and Iran remained the most volatile variable in global markets throughout April 2026. Since military strikes began in early March, the Strait of Hormuz has been functionally closed, choking off 20% of global oil supply. The resulting logistical nightmare has left approximately 1,500 ships and 20,000 crew members trapped in the region. On April 7, a temporary two-week ceasefire was brokered by Pakistan, during which President Trump announced that Iran would immediately open the strait and work toward a final peace agreement. However, by April 9, Iran accused the U.S. and Israel of violating the truce with strikes in Lebanon, and ships remained unable to move.

Diplomatic efforts intensified in late April as Axios reported that Iran, through Pakistani mediators, had submitted a “one-page memorandum” to end the war. The Iranian proposal offered to reopen the Strait of Hormuz and extend the ceasefire in exchange for the lifting of the U.S. naval blockade on Iranian ports. Notably, the proposal suggested postponing nuclear negotiations to a later date, a move the White House viewed with skepticism as it would remove U.S. leverage over Iran’s enriched uranium stockpile. Furthermore, Iran introduced a controversial plan to charge vessels a fee for transiting the strait, with Supreme Leader Mojtaba Khamenei referring to a “new management” that would reap economic benefits for the regime.

In early May, the U.S. launched “Project Freedom,” a military effort to coordinate and guide stranded vessels out of the strait. While the Pentagon initially reported success in clearing a path, the operation saw immediate escalation, with U.S. forces destroying six Iranian small boats and intercepting cruise missiles. Within twenty-four hours of its launch, President Trump paused “Project Freedom” to allow for further peace talks, causing Brent crude prices to dip from $114 to $109 per barrel. The fragility of these negotiations continues to keep the energy premium high across all commodity classes.

5. Equity Market Performance: The Tech-Led Rebound

Despite the geopolitical backdrop, U.S. equity markets staged a historic rally in April 2026. The S&P 500 rose 10.5%, and the Nasdaq-100 surged 15.7%, marking its best month in 23 years. This “risk-on” rotation was driven by a powerful combination of oversold conditions and a renewed frenzy surrounding AI, cloud infrastructure, and semiconductors. Leadership was heavily concentrated, with Communication Services (+18.5%) and Information Technology (+17.5%) sectors outperforming all others.

Table 4: U.S. Equity Index and Sector Performance (April 2026)

Index / SectorMonthly ReturnYTD Return (as of 4/30)Significance
S&P 500+10.5%+5.7%13th 10% month in 50 years.
Nasdaq-100+15.7%+8.2%Best performance since Oct 2002.
Russell 2000+12.3%N/ASmall-cap tech rebound.
SOX (Semiconductors)+38.0%+211% (Rolling 12M)Best month since Feb 2000.
Communication Services+18.5%Leading SectorDriven by Mag 7.
Technology (XLK)+17.5%Second LeadingData Center/AI Capex.
Financials+5.6%SolidRebound in capital markets activity.
Health Care-0.4%LaggingSpecific device recalls/regulatory.
Energy-3.5%DecliningProfit-taking from March highs.

The semiconductor sector achieved a legendary performance in April, with the PHLX Semiconductor Index (SOX) gaining 38%, more than double any monthly gain in the prior 23 years. This was fueled by extraordinary individual stock performances: Intel (INTC) surged 114.1% in April after shattering earnings expectations and announcing a manufacturing deal for Elon Musk’s “Terafab” AI chip complex in Austin. Advanced Micro Devices (AMD) followed with a 74.3% gain, while ON Semiconductor (ON) rose 62.8%. Memory chip manufacturers also saw parabolic moves, with SanDisk (SNDK) up 72.6% and Micron (MU) up 53.1%, as AI data center demand for high-bandwidth memory reached new peaks.

The strength of the rally was corroborated by massive capital inflows. Technology sector ETFs attracted a record $14.2 billion in monthly inflows. The Invesco QQQ Trust (QQQ) alone pulled in $10.1 billion, its best month of flows on record. Conversely, leveraged equity ETFs saw outflows of $17.1 billion as traders cashed out of high-octane positions following the rapid gains, suggesting a tactical de-risking amidst the volatility.

6. Corporate Earnings: Mag 7 and Market Movers

The Q1 2026 earnings season was one of the strongest in recent years. Blended earnings growth for the S&P 500 tracked at +27.1%, the fastest pace since late 2021. Profit margins remained exceptionally high, with the blended net profit margin for the index reaching 13.4%, the highest level in 15 years. However, the “Magnificent Seven” results revealed a complex narrative where robust revenue growth was often overshadowed by staggering capital expenditure guidance for AI infrastructure.

Table 5: Major Stock Highlights – Q1 2026 Results (April Reporting)

CompanyResultMarket ReactionContext / Driver
Intel (INTC)EPS $0.29 vs $0.01 est.+114% (Monthly)Terafab partnership; massive beat.
Apple (AAPL)$111.2B Revenue+5% (After-hours)Record iPhone 17 demand.
Alphabet (GOOGL)Strong Revenue BeatSurgedCloud computing division engine.
Microsoft (MSFT)Q3 Strong GrowthInitial PressureAggressive AI data center Capex.
Meta (META)Strong RevenueNegativeInvestors wary of AI spending levels.
Amazon (AMZN)Strong RevenueMixedCloud growth vs infrastructure costs.
J.P. Morgan (JPM)$50.5B RevenueStrongPayments revenue up 12% YoY.
Nasdaq (NDAQ)+14% Net RevenueStrongFinTech organic growth at +18%.

While the tech sector provided the momentum, several high-profile losers highlighted the risks of structural decline or execution failures. Charter Communications (CHTR) tumbled 23.5% in April after reporting the net loss of 120,000 Spectrum Internet customers, a sign of intensifying competition in the broadband space. Tractor Supply (TSCO) fell 22.5% as it missed earnings and sales estimates due to softening discretionary demand and the impact of higher tariffs and transportation costs. Insulet (PODD) dropped 18.0% following an expansion of its Omnipod insulin delivery system recall to a Class I level—the most serious FDA category—following reports of 29 serious injuries.

7. Fixed Income, Commodities, and Forex

The bond market remained a source of tension in April, with the “higher-for-longer” narrative becoming the dominant theme. U.S. Treasury yields building on a sharp bear flattening trend from March, with the 10-year yield ending the month at 4.37%. In the UK, the 10-year Gilt yield rose to over 5.0% for the first time in nearly two decades, as investors weighed the inflationary impact of higher energy prices against a resilient labor market. This environment provided a strong tailwind for the U.S. Dollar, though the DXY index actually declined 1.9% in April as risk appetite returned to global equity markets.

Table 6: Asset Class Returns and Key Benchmarks (April 30, 2026)

Asset ClassIndicator / PriceMonthly Change12-Month / YTD
CommoditiesBrent Crude Oil$115.00/bbl+57% YTD
Gold Bullion$4,617.85/oz-1.08% (MoM)
Silver Bullion$73.75/oz-1.89% (MoM)
Copper$6.00/lbSideways
Fixed IncomeUS 10-Year Yield4.37%Building on Mar Bear Flat
UK 10-Year Yield5.01%18-Year High
ForexUS Dollar (DXY)104 – 105 range-1.9% (MoM)
Digital AssetsBitcoin (BTC)$81,000++12.1% (MoM)
Ethereum (ETH)$2,360Record ETF Inflows

In the commodities space, precious metals faced headwinds from rising yields. Gold prices retreated 2.29% across the month, ending at approximately 1,009.82 RMB/g (spot) or $4,617.85 per ounce. This decline was driven by a reversal of the safe-haven trade as peace talks progressed and profit-taking occurred at elevated levels. However, analysts noted that gold and silver began to trade more like high-beta risk assets late in the month, surging alongside equities as oil prices tumbled on peace hopes. Industrial metals like copper traded sideways at $6/lb, as a supply squeeze in sulfuric acid—a byproduct of the Middle East conflict—offset the dampening effects of high rates.

8. Digital Assets: The Convergence of Crypto and Macro

Bitcoin and Ethereum continued their integration into the broader macro-financial framework in April. Bitcoin rose 11.87% for the month, mirroring the 10.42% advance of the S&P 500, which analysts cite as further evidence that crypto is currently behaving as a high-beta risk asset rather than a traditional safe haven. April was the strongest month of the year for U.S. spot Bitcoin ETFs, which recorded net inflows of $1.97 billion. Ethereum also saw a reversal of fortunes, with its ETFs recording $356 million in inflows, ending a prolonged streak of outflows.

Technical levels remain critical, with Bitcoin trading above $81,000 for the first time in three months before facing rejection at its 200-day EMA in early May. Despite short-term pullbacks, the structural demand for digital assets as a “debasement trade” against fiat currency erosion remains a key theme, especially with U.S. government debt and energy-driven inflation remaining elevated. Regulatory developments also provided support, with Virginia enacting new legislation to protect dormant cryptocurrency accounts, a move expected to prevent unintended liquidations.

9. The Political Dimension: Midterms and Affordability

As the U.S. enters the primary season for the November 2026 midterm elections, the political landscape is being reshaped by economic anxiety. “Affordability” has become the central campaign issue, as the cost of living remains the top concern for voters. Household utility costs have risen 41% since 2021, and the median age for first-time home purchases has climbed to 40 years. Republican control of the House is viewed as vulnerable, with Democrats leading in 213 races and 14 of the 17 “toss-up” races featuring Republican incumbents.

Table 7: U.S. Midterm Political and Market Outlook

MetricStatus / ValueMarket Implication
House ControlGOP (217) – DEM (213)Gridlock historically favored.
Senate ControlGOP (53)High hurdle for Democrats to flip.
Key IssueAffordability / Cost of LivingRisks to Pharma/Financial stocks.
Approval Rating23% on Cost of LivingHeadwind for incumbent GOP party.
RedistrictingFL/TX Maps ApprovedPotential for 4-5 GOP seat gains.

Political uncertainty is expected to increase market volatility in the second half of the year, a trend consistent with historical midterm patterns where returns often lag in election years before rebounding strongly in the following year. The administration is rolling out targeted measures to reduce credit card interest rates and prescription drug costs to aid consumers, though these initiatives create specific market risks for the financial and pharmaceutical sectors.

10. Global Market Quick-Take: Regional Divergence

Outside of the U.S., equity markets delivered mixed but generally positive results. South Korea’s Kospi Index provided one of the most stunning moves in early May, soaring 6.5% to shatter the 7,000 milestone for the first time. This was led by a 14.4% gain in Samsung Electronics, which pushed its market capitalization above $1 trillion. In Japan, the Nikkei 225 hit fresh record highs, finishing April with a YTD gain of 20.3%, the highest among major indexes.

European markets also rallied, with the Stoxx Europe 600 climbing 2.2% in a single session in early May on peace hopes. Germany’s DAX rose 9% in April, though it remained slightly lower on the year as business confidence indicators, such as the Ifo index, fell to pandemic-era lows. In the UK, the FTSE 100 gained 2.8% in local currency but rose 5.6% in U.S. dollar terms due to sterling strength, even as consumer sentiment hit its lowest level since 2023.

11. Summary and Outlook

April 2026 will be remembered as the month the financial markets successfully decoupled from a localized but severe energy war. The resilience of the U.S. economy, characterized by a transition toward high-tech business investment and a historic surge in semiconductor valuations, allowed equities to ignore the immediate inflationary pressures of the Strait of Hormuz closure. The 10.5% gain in the S&P 500 and the 38% explosion in the SOX index underscore a structural shift in investor sentiment, where the long-term productivity gains from artificial intelligence are being priced in with unprecedented speed.

However, the outlook remains complicated by the transition at the Federal Reserve and the fragility of the U.S.-Iran peace negotiations. With Kevin Warsh poised to take the helm at the central bank, markets are anticipating a shift toward a policy framework that favors productivity-led growth but remains wary of the “higher-for-longer” interest rate environment. The persistence of double-digit energy inflation and the widening gap between producer and consumer prices suggest that the “Oil Shock” is not yet fully neutralized. As the 2026 midterm elections approach, the focus on affordability and the potential for a shift in congressional control will likely introduce a new layer of domestic political risk. For professional investors, the current environment demands a careful balance between riding the AI momentum and hedging against a potential second-round inflationary wave driven by geopolitical instability and a possible policy pivot at the world’s most powerful central bank.

The record-breaking performance of the U.S. markets in April 2026 serves as a testament to the power of secular growth themes to override cyclical geopolitical shocks. While the month saw extreme volatility in energy and individual stocks like Intel and Charter, the aggregate market movement was a resounding vote of confidence in the technological future. As the global community waits for the finalization of a peace agreement in the Middle East, the structural resilience of the global economy appears well-positioned to navigate the remaining uncertainties of the year.

0 Comments/by Spencer Li
https://synapsetrading.com/wp-content/uploads/2019/10/logo.jpg 0 0 Spencer Li https://synapsetrading.com/wp-content/uploads/2019/10/logo.jpg Spencer Li2026-05-10 20:06:412026-05-10 21:02:21Monthly Market Wrap (April 2026)
Spencer Li

Monthly Market Wrap (March 2026)

Market Analysis

monthly market wrap march 2026

The global financial landscape in March 2026 underwent a structural transformation, as a period of relative economic resilience was abruptly superseded by a regime of heightened geopolitical volatility and supply-side inflationary impulses. The transition from a narrative dominated by the potential of artificial intelligence to one centered on kinetic conflict in the Middle East has forced a comprehensive re-valuation of asset classes. At the core of this transition was the escalation of hostilities between the United States, Israel, and Iran, which culminated in the effective closure of the Strait of Hormuz—a maritime chokepoint responsible for the transit of approximately one-fifth of the world’s petroleum and liquefied natural gas (LNG). This disruption introduced a stagflationary shock that effectively dismantled the “soft landing” consensus that had prevailed since the start of the year, leading to the worst monthly performance for the S&P 500 since September 2022.

1. Geopolitical Escalation and the Maritime Blockade

The primary driver of market activity in March was the rapid widening of the conflict in the Persian Gulf. Following initial U.S. strikes on Iranian infrastructure in late February, the situation deteriorated as regional militias, including Yemen’s Houthi rebels, entered the theater of operations. The strategic response from Tehran—the blockade of the Strait of Hormuz—represented an unprecedented challenge to global energy security. Maritime tracking data revealed a staggering 96% decrease in vessel transits through the strait during the first two weeks of March compared to the prior period. This blockade removed an estimated $11.1$ million barrels of oil per day from the global market, alongside a third of the world’s fertilizer supply and significant volumes of industrial raw materials.

The impact on commodity pricing was immediate and severe. Brent crude, the international benchmark, surged by more than 60%, surpassing $100 per barrel for the first time in nearly four years and reaching intraday peaks above $118. The price action was characterized by extreme reflexivity to diplomatic rhetoric; markets experienced violent “technical bounces” on rumors of potential de-escalation, only to retreat as Iranian leadership reiterated its intent to maintain the blockade until security guarantees were met. The volatility was further exacerbated by comments from the U.S. administration, which oscillated between threats of targeted strikes on Iran’s power infrastructure and claims of “serious discussions” with a potential successor regime.

Table 1: Key Energy and Commodity Price Movements (March 2026)

CommodityOpening Price (Mar 1)Peak/Closing Price (Mar 31)Monthly Change (%)Contextual Driver
Brent Crude Oilapprox $70.00$118.00+63%

Strait of Hormuz Closure

WTI Crude Oilapprox $68.00$ 102.88+51%

Domestic Insulation vs Global Shock

U.S. Gasoline (Avg)<$3.00>$4.00+33.3%

Pass-through to Consumer

U.S. Diesel (Avg)$ 3.76$ 5.45+44.9%

Freight and Logistics Pressure

Gold (Spot)$5,200$4,664.39-11.2%

Real Yield Spikes vs Hedge Demand

Silverapprox $91.00$72.96-19.9%

Industrial Demand vs Liquidity Needs

The second-order effects of this energy shock reverberated through the global transport and manufacturing sectors. U.S. gasoline prices breached the $4 per gallon mark nationwide for the first time since 2022, effectively acting as a regressive tax on consumer discretionary income. The jump in diesel prices was even more pronounced, rising from $3.76 to $5.45 per gallon, which threatened to reignite the “cost-push” inflation that had plagued the economy in previous cycles. For corporate America, the increase in fuel costs emerged as a significant headwind for earnings margins, particularly for industrials and consumer-facing entities.

2. Macroeconomic Indicators and the Federal Reserve’s Hawkish Pivot

The Federal Open Market Committee (FOMC) convened in mid-March under conditions of extreme uncertainty. While the committee voted 11-1 to maintain the federal funds rate at its target range of 3.50% – 3.75%, the accompanying Summary of Economic Projections (SEP) signaled a critical shift in the monetary policy trajectory. The Fed acknowledged that the geopolitical situation was “unpredictable” and that the rise in oil prices was inherently inflationary. Consequently, the “dot plot” indicated that most officials now project only one rate cut for the remainder of 2026, a significant reduction from previous expectations of a more aggressive easing cycle.

The Decoupling of Labor and Inflation Data

The economic data released in March presented a complex and often contradictory picture of the U.S. economy. The labor market showed signs of significant cooling; nonfarm payrolls for February, reported in early March, showed a decline of 92,000 jobs, sharply missing expectations for a 50,000 gain. This contraction, the most significant in the current cycle, pushed the unemployment rate up to 4.4%. Analysts attributed the weakness to a combination of factors: harsh winter weather in January and February, ongoing layoffs in the technology sector as firms reassessed AI-related spending, and a general hiring freeze in industries sensitive to energy costs.

Despite the weakening labor market, inflation remained stubbornly above the Federal Reserve’s 2% target. The Consumer Price Index (CPI) remained unchanged at 2.4% year-over-year, while core inflation held steady at 2.5%. However, the Fed’s updated projections raised the expected 2026 PCE inflation rate from 2.4% to 2.7%, acknowledging the upward pressure from energy prices and the potential for tariffs to sustain goods inflation. Chair Jerome Powell noted that while inflation had improved from its 2022 highs, the supply-side shocks from the Middle East complicated the path toward price stability.

Table 2: U.S. Macroeconomic Data Summary (March 2026)

IndicatorReported ValuePrevious ValueForecast/TargetImplications
Nonfarm Payrolls-92,000Positive+50,000

Structural Cooling in Labor

Unemployment Rate4.4%4.3%4.4%

Reached Cycle High

CPI (YoY)2.4%2.4%2.0%

Inflation Floor Established

Core PCE (2026 F)2.7%2.6%2.0%

Upward Revision on Energy

GDP (2026 F)2.4%2.3%2.0%

Resilient Output Expectations

ISM Manufacturing52.750.950.0

Continued Expansion

ISM Services56.153.450.0

Strong Service Demand

A notable divergence was observed in the Purchasing Managers’ Index (PMI) data. Both the Manufacturing PMI ($52.7$) and the Services PMI ($56.1$) showed continued expansion, suggesting that the underlying demand in the economy remains robust despite the hiring slowdown. This creates a “policy trap” for the Federal Reserve: slowing employment might normally warrant rate cuts, but the expansionary PMI data and spiking energy prices suggest that premature easing could trigger a second wave of inflation.

3. U.S. Equity Benchmarks: Correction and Sector Divergence

The S&P 500 finished March down 4.98%, closing at 6,528.52, marking its most severe drawdown in nearly four years. The correction was characterized by weak market breadth, with 84% of index components declining during the month. The Nasdaq Composite experienced a similar fate, falling 4.68% to 21,408.08 and entering technical correction territory as it closed more than 10% below its previous peak. The Dow Jones Industrial Average, while also negative, showed relative resilience with a 4% loss, aided by its heavier weighting in defensive and energy-related blue-chip stocks.

The Energy Sector as a Lone Outlier

Sector performance was almost entirely dominated by the energy complex. Energy was the only S&P 500 sector to post positive returns in March, gaining 10.26% – 12%. This outperformance was a direct result of the supply constraints in the Middle East, which improved the margins for upstream producers and refiners. Outside of energy, every other sector fell by more than 3%, with Industrials (-8.45%), Consumer Staples (-8.41%), and Healthcare (-8.11%) leading the declines.

SectorMarch Return (%)YTD Return (%)Dominant Theme
Energy+10.26%+30%+

Supply Shock Windfall

Utilities+10.36% (Mixed)Positive

Defensive Rotation

Industrials-8.45%Weak

Fuel and Logistics Costs

Consumer Staples-8.41%Weak

Margin Compression

Health Care-8.11%Weak

Risk-Off De-leveraging

Information Tech-3.56%Strong

AI Reassessment

Cons. Discretionary-3.56%Weak

Falling Real Wages

Financials-3.76%Weak

Flattening Yield Curve

The technology sector, previously the engine of market gains, faced a period of reassessment. Investors began to weigh the immense energy costs required for AI infrastructure against the broader macroeconomic slowdown. While some semiconductor firms like NVIDIA and Micron saw late-month technical recoveries, the broader sector was pressured by rising Treasury yields, which reduced the present value of future earnings for growth-oriented companies.

4. Corporate Performance and Idiosyncratic Risks

While macro themes drove the indices, several individual companies experienced significant moves due to specific news and earnings releases.

The Super Micro Computer (SMCI) Indictment

One of the most high-profile corporate events of March was the unsealing of a Department of Justice indictment against individuals associated with Super Micro Computer, Inc.. The DOJ alleged a “scheme to divert massive quantities of servers housing U.S. artificial intelligence technology to customers in China”. Specifically, the indictment named co-founder and Senior VP Yih-Shyan Liaw, Taiwan general manager Ruei-Tsang Chang, and a third-party broker, Ting-Wei Sun, as conspirators in a project that allegedly generated $ 2.5 billion in illegal revenue between 2024 and 2025.

On this news, SMCI shares plummeted 33.3% on March 20, closing at $20.53 on unusually high volume. The company attempted to distance itself by placing the employees on administrative leave and stating its cooperation with authorities, but the legal overhang triggered a series of class-action lawsuits and a massive de-rating of the stock. This event highlighted the heightened regulatory risks facing the AI hardware supply chain in an era of increasing U.S.-China tension.

M&A Activity and Consumer Staples Turmoil

The consumer staples sector was hit by both macro headwinds and deal-related uncertainty. The Estée Lauder Companies (EL) became the worst performer in the S&P 500 for March, falling 34.4%. The decline was attributed to transaction-related uncertainty following its agreement to acquire the remaining interest in Forest Essentials, occurring against a backdrop of weakening global demand for luxury personal care products.

In contrast, the food industry saw a major consolidation move as McCormick & Company announced a $29 billion agreement to merge with Unilever’s global food unit. However, the market’s reaction to large-scale M&A in March was generally skeptical; Sysco shares plunged 12% after announcing its own $29 billion acquisition of Jetro Restaurant Depot, as investors expressed concern over the company’s debt levels in a rising-rate environment.

Table 3: Significant U.S. Stock Moves (March 2026)

TickerCompanyMarch Change (%)Reason for Move
LYBLyondellBasell+40.1%

Petrochemical Supply Disruption

APAAPA Corporation+39.7%

Upstream Energy Leverage

SMCISuper Micro-29.7%

DOJ Indictment / Export Violations

ELEstée Lauder-34.4%

M&A Uncertainty / Sector Weakness

PARAParamount Skydance-33.2%

WBD Merger Risk-Off

SYYSysco-12.0%

Debt-Heavy Acquisition Concern

NKENike-14.5%

Wholesale Strategy Shift / Consumer Drag

XOMExxon Mobil+10%+

Record Quarterly Gain

In the energy sector, giants like Exxon Mobil and Chevron reached multi-year highs. Exxon recorded its largest quarterly gain in history, driven by a combination of surging crude prices and expanded refining margins as the global market scrambled to replace Persian Gulf supplies.

5. The SpaceX IPO and the Evolution of Market Structure

March 2026 marked a potential watershed moment for the private markets with the confidential IPO filing of SpaceX. The company, led by Elon Musk, is reportedly targeting a valuation of between $1.75$trillion and $2 trillion, which would make it the largest public offering in history. The filing, which targets a possible June listing, comes after SpaceX’s merger with xAI earlier in the year, creating a conglomerate with dominance in launch services, satellite internet (Starlink), and advanced AI models.

Rule Changes and Index Manipulation Concerns

The potential listing has ignited a fierce debate over market integrity and the role of passive investment funds. Nasdaq recently finalized changes to the Nasdaq-100 index rules, effective May 1, 2026, which allow a newly public company of sufficient size to be added to the index in as little as 15 trading days—a drastic reduction from the previous requirement of one year. Notable investors, including Michael Burry, have characterized these changes as “structural manipulation,” arguing that they are designed to provide “exit liquidity” for insiders by forcing passive ETFs and 401(k) plans to purchase shares at a high valuation regardless of fundamentals.

On social media platforms like Reddit’s r/WallStreetBets and r/investing, sentiment was highly polarized. While some retail investors view SpaceX as a “generational wealth” play, others expressed skepticism about the company’s valuation, noting that the merger with xAI effectively bundled a cash-burning AI entity into the profitable SpaceX core. Rumors that Musk might allocate up to 30% of the IPO to retail investors—three times the typical allocation—further fueled the “meme-stock” narrative surrounding the listing.

6. Global Market Performance and Foreign Exchange

The impact of the March crisis was not confined to the United States. In fact, international and emerging markets often experienced even more severe drawdowns due to their direct exposure to energy imports and the strengthening of the U.S. dollar.

International Equities and Regional Responses

The MSCI EAFE index, representing developed markets outside the U.S. and Canada, fell 10.3%, while the MSCI Emerging Markets index dropped 13.1%. Asia was the epicenter of the decline among emerging markets, as countries like South Korea and Japan are heavily reliant on the Strait of Hormuz for their energy needs. Japan’s Nikkei 225, which had been a top performer earlier in the year, saw a late-month slide as the rising cost of energy imports threatened to undermine the country’s fragile economic recovery.

In contrast, Canada’s S&P/TSX Composite Index showed remarkable resilience, gaining 7.57% in February and remaining stable through March. This was largely due to the TSX’s heavy weighting in materials and energy, as well as its status as a “safe haven” for investors seeking exposure to North American commodities away from the geopolitical theater.

IndexMarch/Q1 Return (%)StatusKey Driver
S&P 500 (USA)-4.98%Correction

Worst Month since 2022

TSX (Canada)+7.57% (Feb/Mar)Record Highs

Commodity Exposure

Nikkei 225 (Japan)-0.3% (late Mar)Consolidation

Energy Import Costs

Euro Stoxx 50-1.5% (late Mar)Under Pressure

ECB Hawkishness

MSCI EM-13.1%Bearish

Oil Dependency / Dollar Strength

European markets faced a difficult month as rising energy prices revived concerns about “second-round” inflation effects, potentially forcing the European Central Bank (ECB) into a more hawkish stance. The STOXX 600 fell 1.1% late in the month, with cyclicals and travel-related stocks bearing the brunt of the sell-off due to rising fuel costs.

Forex and the U.S. Dollar Index (DXY)

The U.S. Dollar Index (DXY) acted as a primary beneficiary of the flight-to-quality trade. The index reached peaks near $120.89$ in late March, as investors sought the safety of the world’s reserve currency amid global instability. The dollar’s strength was further supported by the Fed’s hawkish pivot and the perception that the U.S. economy, as a net energy exporter (WTI), was better positioned to weather the Hormuz closure than Europe or Asia.

The strength of the dollar put immense pressure on other major currencies. The Euro (EUR/USD) traded near 1.153, while the Japanese Yen (^USDJPY) saw significant volatility as the Bank of Japan struggled to balance currency intervention with the inflationary impact of high oil prices.

7. Fixed Income and the Bond Market Sell-Off

Traditionally, investors flock to sovereign bonds during times of geopolitical crisis. However, the unique nature of the March shock—a supply-side inflationary event—broke this relationship. Treasury yields rose sharply as markets factored in a higher floor for inflation and a more restrictive Federal Reserve.

The yield on the 10-year Treasury rose from 3.97% in late February to peaks as high as 4.44% in March, before settling near 4.32%. This move up in the “risk-free rate” had immediate implications for the broader economy, driving mortgage rates and corporate borrowing costs higher. The 2-year yield rose even more dramatically, by 42 basis points to 3.79%, leading to a “bear flattening” of the yield curve. This structural shift suggests that the bond market is bracing for a period of sustained high rates rather than a temporary spike followed by a quick reversal.

Treasury TermFeb Yield (%)Mar Peak/End Yield (%)Basis Point Change
2-Yearapprox 3.37%3.79%

+42 bps

10-Year3.97%4.44%

+38 to +47 bps

30-Yearapprox 4.50%4.88%

+38 bps

In the private credit markets, cracks began to appear in the software lending sector. The average bid for software-related private loans declined significantly, reflecting a broader reassessment of technology valuations and the sector’s vulnerability to rising funding costs. While the impact was not deemed an “existential threat” to the asset class, it highlighted the uneven pressure across different segments of the credit market.

8. Digital Assets: Bitcoin’s Emergence as a “Crisis Asset”

In a surprising turn of events, the cryptocurrency market, specifically Bitcoin (BTC) and Ethereum (ETH), displayed a higher degree of resilience than traditional safe havens like gold in March 2026. Bitcoin broke a five-month losing streak, trading between $67,000 and $73,000 for much of the month.

Institutional Flows and the “Saylor Effect”

The stabilization of Bitcoin was driven largely by massive institutional accumulation. U.S. spot Bitcoin ETFs recorded net inflows of over $1.1 billion in a single week in early March, with BlackRock’s IBIT capturing more than half of the total volume. This influx of capital occurred as gold ETFs saw record outflows, suggesting a structural rotation of institutional “inflation-hedge” capital from precious metals to digital assets.

MicroStrategy continued its relentless accumulation strategy, adding over 40,000 BTC in the first half of March alone. As of March 2026, the company held over 720,000 BTC, acting as a psychological and structural backstop for the market. Analysts noted that Bitcoin was beginning to be viewed as a “safe-haven asset” due to its lack of direct exposure to maritime transit routes or Persian Gulf infrastructure.

Ethereum: Network Strength vs. Price Pressure

Ethereum’s performance was more nuanced. While the price hovered near $2,100, experiencing some selling pressure in the derivatives market following aggressive rhetoric from the U.S. administration, the network’s underlying fundamentals remained robust. Ethereum saw near-record levels of daily active addresses (over 788,000) and new account creation, suggesting that decentralized finance (DeFi) and smart contract activity were continuing unabated by the macro turmoil. However, institutional demand for Ethereum ETFs appeared to lag behind Bitcoin, with some funds seeing modest outflows as investors favored the simpler “digital gold” narrative of BTC during the crisis.

AssetPrice (Mar 31)30-Day Change (%)Institutional Signal
Bitcoin (BTC)approx $67,500Stable / Positive

ETF Inflows / MSTR Buying

Ethereum (ETH)approx $2,050+2.1% (Mixed)

On-chain Highs / ETF Outflows

Gold (Spot)$4,664.39-11.2%

Significant ETF Outflows

The divergent performance of Bitcoin (+2% to +3.3%) and Gold (-11%) represents a potential paradigm shift in crisis management for portfolio managers. Historically, the inverse would have been expected, but the combination of high real yields and the digitalization of finance has created a new set of market dynamics.

9. Summary of Market Drivers and Strategic Outlook

March 2026 was a month of deep transition, where geopolitical risk became the primary determinant of asset values, overwhelming the fundamental strength observed in the early part of the year. The effective closure of the Strait of Hormuz acted as a “black swan” event, driving oil prices to levels that challenged the global disinflation narrative and forced the Federal Reserve into a hawkish stance despite a weakening labor market.

The correction in U.S. equities was broad-based but highly uneven. While the energy sector reached record highs, the rest of the market—particularly consumer-facing and tech-heavy segments—was pressured by rising fuel costs and higher Treasury yields. Corporate scandals, exemplified by the SMCI indictment, further eroded investor confidence in the technology supply chain. Meanwhile, the confidential filing for the SpaceX IPO signaled a massive shift in market structure, with multi-trillion dollar private entities preparing to enter the public domain under new, fast-track index rules.

Globally, the strengthening of the U.S. dollar and the high cost of energy imports created a difficult environment for emerging markets and developed Asia. In contrast, commodity-rich Canada emerged as a regional winner. In the alternative asset space, the rotation from gold into Bitcoin suggests that institutional investors are increasingly looking to digital assets for protection against sovereign and geopolitical shocks that traditional hedges are failing to mitigate.

Looking toward the second quarter of 2026, the primary question for investors is whether the current geopolitical tensions will result in a permanent shift in energy logistics or if a diplomatic resolution can restore the status quo. Until the Strait of Hormuz is reopened and energy prices stabilize, volatility is expected to remain elevated, and the Federal Reserve will likely remain constrained in its ability to support the economy through rate cuts.

0 Comments/by Spencer Li
https://synapsetrading.com/wp-content/uploads/2019/10/logo.jpg 0 0 Spencer Li https://synapsetrading.com/wp-content/uploads/2019/10/logo.jpg Spencer Li2026-04-03 23:48:372026-04-03 23:48:37Monthly Market Wrap (March 2026)
Spencer Li

Monthly Market Wrap (February 2026)

Market Analysis

monthly market wrap feb 2026

The month of February 2026 represents a seminal inflection point in American monetary history, defined by a shift from the cautious, data-dependent stance of the Jerome Powell era toward a more disciplined, rules-based doctrine following the nomination of Kevin Warsh as the next Chair of the Federal Reserve. This transition occurred against a backdrop of complex economic signals, where the lagging effects of a 2025 government shutdown collided with robust January labor data, creating a paradox of cooling growth and stubborn inflation. The “Warsh Shock,” as dubbed by market participants, triggered a violent repricing across all major asset classes, as investors recalibrated expectations for a central bank that would prioritize currency stability and balance sheet reduction over asset price support.

1. The Macro-Monetary Pivot: Federal Reserve Transition and the Warsh Shock

The nomination, announced on January 30 and reverberating through February, positioned Warsh as the architect of a new monetary doctrine. Having served as a Fed Governor during the 2008 financial crisis and as a partner at Morgan Stanley, Warsh brought a “triple-threat” background of market mechanics, crisis management, and institutional critique. His long-standing opposition to expansive quantitative easing and his advocacy for a “monetary humility” that follows market signals rather than leading them suggests a definitive pivot toward “Sound Money”. The immediate market reaction saw the U.S. Dollar Index surge while inflation-hedge assets, specifically gold and bitcoin, faced a brutal sell-off, reflecting a belief that the “Fed backstop” for speculative excesses was being dismantled.

IndicatorPre-Nomination TrendPost-Nomination Reaction (Feb)Strategic Implication
U.S. Dollar Index (DXY)Multi-week declineSharp recovery and breakoutShift toward dollar scarcity and higher real rates.
Gold (XAU/USD)Near record highs9% – 18% decline depending on durationReduced demand for inflation-hedges under “Sound Money.”
Bitcoin (BTC)Consolidating above $100k>25% decline to sub-$75k levelsRecalibration of “digital gold” as a liquidity play.
10-Year Treasury YieldDeclining toward 4.0%Bear steepening; long-term yields roseAnticipation of active MBS/Treasury sales (QT).

The transition is not merely a change in personnel but a change in the Fed’s reaction function. Warsh is expected to implement a “QT-for-cuts” strategy, a framework that potentially offers front-loaded interest rate reductions to support the administration’s growth agenda while simultaneously accelerating the shrinkage of the Fed’s $6.6 trillion balance sheet. This approach aims to decouple the federal funds rate from long-term market rates, allowing the Fed to exit its role as an active market participant while maintaining the stability of the currency. However, critics argue that aggressive selling of mortgage-backed securities (MBS) could introduce volatility into the housing market, which is already reeling from its sharpest decline in sales activity since the 2020 lockdowns.

2. Labor Market Dynamics and the Economic Growth Rebound

The U.S. labor market demonstrated unexpected resilience in early 2026, serving as a stabilizing force amidst the broader monetary and geopolitical turmoil. The January employment report, released in February, revealed a robust increase in nonfarm payrolls of 130,000 jobs, significantly outperforming the consensus estimate of 55,000. This strength was primarily localized in the private sector, which added 172,000 positions, effectively offsetting a 34,000-job contraction in the federal government sector—a byproduct of continued separations following deferred resignation programs initiated in 2025.

Despite this headline strength, the underlying data suggested a cooling trend that had been masked by the government shutdown. Annual benchmark revisions implemented in February reduced estimates of monthly job gains for 2025 by approximately 35,000 per month, leaving the average monthly gain for that year at a modest 15,000. This revision paints a picture of a labor market that is “stabilizing” rather than “accelerating,” with the unemployment rate ticking down to 4.3% from 4.4% in December 2025.

Labor Market MetricJanuary 2026 ActualConsensus ForecastHistorical Context (2025 Avg)
Nonfarm Payrolls+130,000+55,000+15,000 (after revisions)
Private Sector Payrolls+172,000+70,000+45,000
Unemployment Rate4.3%4.4%4.2% (SEP Median)
Labor Participation62.5%62.4%62.5% (Flat YoY)
Real Avg. Hourly Earnings+1.2% YoY+1.0% YoY+0.8% YoY

Sector-specific analysis reveals a concentration of growth in healthcare (+33,000) and social assistance (+42,000), while financial activities saw a decline of 22,000 jobs, continuing a downward trend that began in mid-2025. The manufacturing workweek edged up slightly to 40.1 hours, suggesting that while hiring remains selective, existing capacity is being utilized more intensely. This labor stability provides a critical buffer for the economy as it attempts to rebound from the 1.4% annualized GDP growth recorded in Q4 2025—a figure heavily suppressed by the federal shutdown. Early indications for 2026 suggest a return to “above-trend” growth, supported by robust investments in artificial intelligence and a recovery in private domestic final demand, which maintained a 2.9% growth rate even during the shutdown period.

3. Inflationary Pressures and the Consumption Landscape

Inflation remained a primary concern for policymakers throughout February, with headline and core figures continuing to hover above the FOMC’s 2% long-term goal. As of December 2025, the 12-month headline Personal Consumption Expenditures (PCE) price index stood at 2.9%, with core PCE—excluding volatile food and energy—unchanged at 3.0%. Consumer Price Index (CPI) data for the same period showed a headline rate of 2.7%, down from 3.0% in September but still elevated relative to the pre-pandemic era.

The persistence of inflation is largely attributed to “supercore” inflation—core services excluding housing—which remains stubbornly elevated. While housing inflation has begun to ease, the imposition of new tariffs has introduced a fresh layer of “goods price inflation”. The Supreme Court’s February ruling on tariff authorization has introduced significant uncertainty into the inflation outlook, as producers continue to pass through the costs of existing tariffs to consumers. Federal Reserve officials, including New York Fed President John Williams, have noted that while these tariffs may have “one-off” effects on the price level, the lack of second-round effects on wages suggests that the underlying trend toward 2% remains intact, albeit delayed.

Inflation GaugeDec 2025 / Jan 2026 ValueFed TargetPrimary Driver
Headline PCE (YoY)2.9%2.0%Services and Tariff Pass-through
Core PCE (YoY)3.0%2.0%Persistent “Supercore” services
Headline CPI (YoY)2.7%2.0%Energy goods and Food stability
Core Goods Prices0.0% (Flat)N/ATariff pass-through vs. AI productivity
Producer Price Index (YoY)2.88%N/AManufacturing input cost acceleration

Consumer behavior in February reflected this nuanced inflationary environment. Existing home sales experienced an 8.43% month-over-month decline, the sharpest drop since the COVID-19 lockdowns, as high mortgage rates and record-high prices finally dampened demand. The median sales price for an existing home fell below $400,000 for the first time in nearly a year, suggesting that the housing market may be reaching a cyclical peak. Conversely, retail sales and food services showed a slight contraction of 0.02%, while consumer confidence fell to a 12-year low, driven by geopolitical angst and uncertainty surrounding the Federal Reserve’s independence.

4. Geopolitical Kineticism: The February 28 Iran Strikes

The geopolitical risk profile of the global economy shifted dramatically on February 28, 2026, when the United States and Israel launched a coordinated military strike against the Islamic Republic of Iran. The operation, described by President Trump as an effort to dismantle Iran’s nuclear program and end the regime’s power, resulted in the confirmed death of Supreme Leader Ayatollah Ali Khamenei. This event represents a departure from the “symbolic attacks” of previous years, signaling a move toward “major combat operations” and regime change.

The immediate market response was a classic “flight to safety,” though the assets chosen for refuge differed from previous cycles. While the U.S. dollar and gold surged initially, the impact on energy markets was the most profound. Iran’s reported closure of the Strait of Hormuz—a chokepoint through which approximately 20% of global oil flows—triggered an immediate 6% spike in WTI crude oil prices during Asian trading sessions.

Geopolitical EventImmediate Asset ImpactStrategic Concern
Iran Nuclear StrikesWTI spikes above $70; Nasdaq futures fall 0.9%Prolonged regional war involving Gulf states.
Khamenei Death“Haven first” flows into USD; Gold volatilityPower vacuum and potential hardline military successor.
Strait of Hormuz ClosureBrent-WTI spread widens; Shipping stocks volatileDisruption of OPEC exports and global supply chains.
Spain Trade HaltSpanish ADRs (Santander) drop 14%Weaponization of trade over military base access.

The death of Khamenei and the potential rise of a military dictatorship led by the Revolutionary Guard have introduced a “regime change” premium into oil prices. Historically, such transitions in major oil-producing nations have led to price spikes averaging 76% from onset to peak. Furthermore, the escalation has drawn in neutral countries, with Iran reportedly launching retaliatory strikes against U.S. assets in Saudi Arabia, the UAE, and Qatar. This regionalization of the conflict threatens the “deterrence” bull case that had dominated market sentiment throughout early February, moving the global economy into “uncharted territory”.

5. Trade Policy and the Reauthorization of Section 122 Tariffs

February 2026 saw a significant reconfiguration of the American trade regime following a landmark Supreme Court decision on February 20. The Court upheld a ruling that the International Emergency Economic Powers Act (IEEPA) does not grant the President the authority to impose tariffs unilaterally. In an immediate pivot, President Trump utilized Section 122 of the Trade Act of 1974 to impose a 10% universal tariff on all imports, effective February 24.

The Section 122 tariffs are designed to address large-scale balance of payments deficits and provide the executive branch with a different statutory basis for trade intervention. While the administration exempted civil aviation products and initiated trade investigations into other sectors, the broad application of these tariffs has intensified concerns regarding “second-round” inflationary effects.

Tariff AuthorityLegal Status (Feb 2026)Economic Impact
IEEPARestricted by Supreme CourtRemoved as a tool for broad-based import duties.
Section 122Activated (10% Universal)Immediate input price pressure for U.S. manufacturers.
Section 301Active (Targeted)Continued pressure on specific technology and raw material imports.
Canada-China RoadmapChallenged by U.S.Led to threats of retaliatory tariffs against Canada.

The trade landscape was further complicated by idiosyncratic disputes, notably a total trade halt with Spain. This move, triggered by Spain’s refusal to allow U.S. aircraft to use military bases for strikes on Iran, highlights the increasing intersection of trade policy and geopolitical objectives. Market participants have noted that while such “tantrums” create short-term volatility—exemplified by the 14% drop in Spanish banking stocks—they also present buying opportunities for those who believe the structural integrity of the European trade zone will eventually limit the duration of such halts.

6. The AI Scare and Sectoral Rotation in Equity Markets

The U.S. equity market in February was defined by a profound “AI Scare,” a phenomenon where the rapid advancement of artificial intelligence began to be viewed as a disruptive threat rather than a purely additive growth driver. While the S&P 500 and Nasdaq Composite posted monthly declines of 0.8% and 3.3% respectively, the internal dispersion was extreme. The cap-weighted Nasdaq 100 had its worst monthly performance since March 2025, falling 2.3%, while the S&P 500 Equal Weight Index rose 3.5%, outperforming its cap-weighted counterpart for the fourth consecutive month.

The “AI Scare” was catalyzed by product releases from startups like Anthropic, whose “Claude Code” tool demonstrated the ability to modernize legacy COBOL programming—a core pillar of enterprise IT infrastructure. This sparked a “SaaS-pocalypse” narrative, where investors feared that AI agents could automate the functions of thousands of software-as-a-service (SaaS) licenses.

Sector / IndexFeb 2026 Total ReturnYTD Total ReturnNarrative Driver
Utilities (XLU)+10.4%+8.2%Defensive safe haven + power demand for data centers.
Energy (XLE)+9.5%+11.3%Iran conflict and rising oil/gas prices.
Information Tech (XLK)-3.6%+6.0%“AI Scare” disruption fears in software.
Financials (XLF)-3.8%-4.1%Private credit fears and Warsh “QT” concerns.
Nasdaq Composite-3.3%-2.7%Top-heavy concentration in disrupted growth names.
S&P 500 Equal-Weight+3.5%+7.0%Broadening participation in cyclicals/defensives.

The “AI Paradox” of 2026 is that the market is simultaneously pricing in the disruption of software incumbents and the overbuilding of AI infrastructure. While the iShares Expanded Tech-Software Sector ETF (IGV) plummeted 9.9% in February, semiconductor and networking equipment providers continued to report strong demand. This suggests a rotation of capital toward firms that profit from AI expenditure (the “picks and shovels”) and away from those at risk of AI obsolescence.

7. Corporate Earnings Analysis: Q4 2025 and FY 2026 Guidance

Corporate earnings for the fourth quarter of 2025 remained “solid,” with the S&P 500 reporting double-digit earnings growth for the fifth consecutive quarter. With 96% of companies having reported by late February, 73% exceeded EPS estimates and 73% beat revenue expectations. The blended year-over-year earnings growth rate stood at 14.2%, while revenue growth reached 9.4%, the highest rate since Q3 2022.

However, the “Magnificent Seven” continued to carry a disproportionate share of the load. These seven companies reported actual earnings growth of 27.2%, while the remaining 493 S&P 500 companies grew at a more modest 9.8%.

CompanyQ4 2025 EPS (Actual)EPS SurpriseFY 2026 Outlook
NVIDIA (NVDA)$1.62+5.2%Sustained demand for Blackwell GPUs.
Alphabet (GOOGL)$2.82+31.2%Rebound in ad spend and Gemini growth.
Microsoft (MSFT)$4.14+5.9%Strong Azure growth but AI Capex scrutiny.
Boeing (BA)$9.92N/ADriven by a $9.6B gain on DAS transaction.
Cisco (CSCO)$1.04 (Non-GAAP)+11.0%Networking refresh and AI infrastructure surge.
Workday (WDAY)$2.47+28.6%AI Agent push despite slight outlook miss.
Celsius (CELH)$0.26+38.4%Market share expansion in U.S. energy drinks.

The earnings narrative in February shifted from “past performance” to “future disruption.” While results were strong, analysts lowered Q1 2026 EPS estimates by 1.5% during the first two months of the quarter, even as they increased estimates for the later half of the year. This suggests a “wait-and-see” approach as companies navigate the impact of tariffs and the AI transition. Notably, software companies like Workday and Salesforce are repositioning their platforms around “agentic AI” to prove their value in a changing landscape.

8. Global Market Dispersion: Asia and Europe Outperformance

A significant trend in February was the continued outperformance of international equities relative to major U.S. benchmarks. Emerging markets led the way, advancing 5.5% as investors doubled down on the Asian technology supply chain.

South Korea’s KOSPI Index emerged as the standout market, surging 20% in February alone. This rally reflects heavy investor inflows into semiconductor and chip equipment companies viewed as the “backbone” of the AI build-out. In contrast to the “AI Scare” in the U.S., Asian firms are being valued as essential suppliers within the global technology supply chain, insulating them from SaaS-related disruption fears.

Global Market IndexFeb 2026 PerformancePrimary Driver
MSCI Asia Pacific+6.7%Record February; AI infrastructure demand.
Kospi (S. Korea)+20.0%World’s best-performing major gauge.
Nikkei 225 (Japan)+5.8%Strong exports; thinned Lunar New Year trading.
MSCI Europe ex UK+3.5%Solid earnings; signs of economic stabilization.
FTSE 100 (UK)> 10,000 LevelSurpassed record highs despite political angst.
MSCI Emerging Markets+5.5%Capital flows returning to growth regions.

European markets also demonstrated resilience, with several benchmarks reaching all-time highs. The Eurozone economy grew by 0.3% in Q4 2025, exceeding expectations, with Spain leading the way despite political tensions surrounding Greenland and Venezuela. The UK’s FTSE 100 surpassed the 10,000 level for the first time, supported by a positive surprise in growth data and improved consumer confidence, even as inflation rose to 3.4%.

9. Commodity Markets: Haven Demand and the Warsh Effect

The commodity asset class experienced a volatile February, characterized by sharp price reversals and shifting sentiment. Precious metals, which had reached record highs in January (Gold > $5,500), saw their 30-day volatility surge to levels not seen since the 2008 financial crisis.

The nomination of Kevin Warsh acted as a major headwind for gold and silver, as the anticipation of a stronger dollar and higher real rates reduced the appeal of non-yielding assets. Gold fell nearly 18% from its early-month peaks in some sessions, while silver experienced a 26% plunge. However, by the end of the month, the escalation of the Iran conflict reignited “haven demand,” helping gold to stabilize and post a 7.9% gain for the full month of February.

CommodityFeb 2026 ReturnPeak/Key LevelMarket Narrative
Gold (XAU)+7.93%$5,626 (Record)Warsh shock vs. Iran haven demand.
Silver (XAG)+12.66%$92.15Multi-decade volatility highs; industrial demand.
WTI Crude+2.88%$70.00 (Resistance)Geopolitical spike vs. soft global demand.
Brent Crude-0.48%$71.90Middle East benchmark outperforming WTI.
Natural Gas-10.0%+$3.10U.S. price drop vs. European spike.
Copper+0.37% (Daily)$5.96/lbAI data center and electrical infrastructure demand.

Energy products outperformed crude oil, with gasoline and heating oil futures posting gains of 5.3% and 7.3% respectively. This was driven by the expectation of a strong 2026 driving season and the “distillate refining spreads” that favor Brent-linked products. Agriculture also saw a rally, with soybean and wheat futures rising over 8% due to uncertainty over Northern Hemisphere weather and the ongoing war in Ukraine.

10. Foreign Exchange and Fixed Income: The Dollar’s Structural Edge

In the foreign exchange markets, the U.S. dollar maintained a structural advantage throughout February. As geopolitical risks intensified, the gap between “energy producers” (like the U.S.) and “energy importers” (like Europe and Japan) widened, lifting the dollar across the G10 space.

The British Pound was the hardest hit among major currencies, falling 1.5% against the dollar—its biggest monthly decline since October 2025. This was driven by political uncertainty following a by-election defeat for the Labour party and growing expectations for Bank of England rate cuts as inflation began to cool. The Euro also faced pressure, trading near the 1.18 level, as the “energy squeeze” in Europe weighed on business activity.

Currency PairFeb 2026 Close (Ask)Monthly ChangeCentral Bank Stance
EUR/USD1.1805-0.04%ECB “agile” but core inflation sticky.
GBP/USD1.3519-1.50%BoE March cut “finely balanced.”
USD/JPY155.72VolatileBoJ intervention risks at 160 level.
AUD/USD0.7077ResilientRBA raised rates to 3.85% in February.
DXY Index97.62Strong“Warsh Shock” recovery from 4-year lows.

In the fixed income market, Treasury yields fell sharply during the month, with the 10-year yield dropping 29 basis points to 3.97%. This rally in bonds occurred despite a “hot” wholesale inflation report, suggesting that investors were more concerned about “economic growth momentum” and AI-driven displacement than near-term price pressures. However, the yield curve experienced a “bear steepening” in the final days of the month as the market began to price in Warsh’s preference for balance sheet reduction over balance sheet expansion.

11. Digital Assets: Institutional Retreat and the Warsh Repricing

The cryptocurrency market faced significant headwinds in February 2026, marking its fifth consecutive month of decline. Institutional interest in Bitcoin and Ethereum ETFs waned, with record outflows totaling over $9 billion across both assets during the past four months.

Bitcoin, which had reached a peak of $126,000 in late 2025, ended February near the $66,000 level. The asset class was particularly sensitive to the “Warsh Shock,” as the nominee’s “Sound Money” rhetoric directly challenged the “inflation-hedge” and “liquidity-proxy” bull cases for crypto. Furthermore, Bitcoin failed to act as a safe haven during the Iran conflict, sliding as investors pivoted toward traditional haven assets like the U.S. dollar and tokenized gold.

Crypto AssetFeb 2026 ReturnPrice (Feb 27)Peak to Trough
Bitcoin (BTC)-21.7%$65,883.99-47% from Oct 2025 peak.
Ethereum (ETH)-28.5%$1,931.32-60% from Aug 2025 high.
BTC ETF Flows-$6.39B (4mo)N/ALongest monthly outflow streak.
ETH ETF Flows-$2.76B (4mo)N/ASubstantial institutional exit.

12. Individual US Equities: High-Volume Movers and Performance Outliers

Individual stock performance in February was a study in extreme momentum and rapid sector rotation. While the software sector bled, energy and commodity-oriented technology stocks saw massive fair-value increases.

Fastly (FSLY) emerged as the top performer of the month, gaining 107.2%, followed by Kosmos Energy (KOS) at 71.3%. These moves were driven by specific catalysts: FSLY benefitted from a massive rotation into edge computing and networking infrastructure, while KOS surged on rising oil prices and geopolitical tensions.

TickerFeb 2026 Gain/LossIndustryVolume/Catalyst
FSLY+107.2%TechnologyMonthly leader; Edge infrastructure demand.
KOS+71.3%EnergyIran conflict; YTD leader (+161%).
VAL+65.5%EnergyOffshore drilling demand; Crude spike.
GLW+45.6%TechnologyShortage in commodity-oriented AI products.
IBM-23.7%Technology“Claude Code” COBOL modernization scare.
RDDT-33.3%Comm. ServicesDown 33% YTD; post-IPO volatility.
HOOD-30.7%FinancialsCrypto volume decline; Warsh shock.
SNDK+396% (FV increase)TechnologyExtreme shortage in commodity storage.

Late-cycle technology stocks, particularly those considered “commodity-oriented,” saw the greatest fair value increases. Morningstar increased its valuation on SanDisk (SNDK) by 396%, Western Digital (WDC) by 68%, and Corning (GLW) by 58%. These companies are benefiting from a severe shortage in products whose supply was previously taken for granted during the AI build-out. Conversely, consumer cyclical stocks and retailers like Amazon, Shopify, and Coinbase faced heavy selling pressure as the “AI Scare” and “Warsh Shock” dampened risk appetite.

13. Synthesis and Strategic Outlook for Q2 2026

The month of February 2026 has fundamentally altered the trajectory of the global economy for the remainder of the year. The “Warsh Shock” has introduced a “Sound Money” regime that will likely prioritize balance sheet integrity and currency stability over the accommodative liquidity that fueled the 2024-2025 bull market. While interest rate cuts remain on the table—primarily to offset the drag of a cooling labor market and the friction of new tariffs—the simultaneous acceleration of Quantitative Tightening (QT) will create a challenging environment for long-duration assets and highly leveraged firms.

The “AI Scare” has marked the end of the “speculative momentum” phase of the artificial intelligence boom. Investors are now distinguishing between the “infrastructure providers” (Asia, semiconductor capital equipment, networking) and the “software incumbents” (SaaS, enterprise services). The rotation away from top-heavy tech leadership toward cyclicals, defensives, and small caps—which remain at a 13% discount to fair value—suggests a healthier, more balanced market structure.

Geopolitically, the direct military engagement with Iran and the closure of the Strait of Hormuz represent the most significant near-term threat to global stability. The “deterrence” model of 2025 has been replaced by a “combat” model, which carries far greater ramifications than previous geopolitical flare-ups. If oil prices remain sustained above $70-$75, the “disinflation” narrative that allowed the Fed to begin its cutting cycle may be at risk.

As we move into March and the second quarter of 2026, the key variables to monitor include:

  1. Fed Independence and the Warsh Confirmation: The Senate’s vetting process for Kevin Warsh will provide critical signals on the future of the Fed’s balance sheet and the “QT-for-cuts” strategy.

  2. Strait of Hormuz Duration: The duration of the waterway closure and the potential for a “protracted oil supply disruption” will determine the path of interest rates and the probability of a 2026 recession.

  3. Tariff Pass-Through: The speed at which producers pass the 10% Section 122 tariffs through to consumer prices will be the deciding factor in whether the Fed can achieve its 2% inflation target by year-end.

  4. AI ROI Validation: Future earnings reports must demonstrate that the massive AI Capex is translating into productivity gains and revenue for the software sector to stem the current “SaaS-pocalypse”.

14. Summary of Market Movers

February 2026 was a month of profound structural shifts, headlined by the “Warsh Shock” and a radical repricing of the artificial intelligence narrative. The U.S. economy, while demonstrating labor market resilience with 130,000 new jobs and a 4.3% unemployment rate, faced headwinds from a 1.4% GDP growth slowdown and the imposition of a 10% universal tariff under Section 122. The nomination of Kevin Warsh as the next Fed Chair signaled a transition to “Sound Money” and “Monetary Discipline,” causing a surge in the U.S. dollar and a sharp decline in gold and bitcoin, as markets anticipated a less interventionist central bank and an accelerated reduction of the Fed’s balance sheet.

The “AI Scare” trade upended the technology sector, driving a massive rotation from disrupted software incumbents like Salesforce and IBM toward “picks and shovels” infrastructure providers, particularly in Asia. While the Nasdaq Composite fell 3.3%, international markets like South Korea’s KOSPI surged 20%, highlighting a global dispersion in AI-related optimism. Geopolitically, the U.S.-Israel strike on Iran and the death of its Supreme Leader introduced a “regime change” premium into energy markets, with the closure of the Strait of Hormuz pushing WTI crude above critical resistance at $70 and raising fears of a protracted regional conflict.

As we look toward the second quarter, the investment landscape is defined by “consolidation and verification.” The era of speculative momentum has been replaced by a focus on “Sound Money” fundamentals and the actual ROI of AI investments. While earnings remain solid and global growth resilient, the convergence of trade policy uncertainty, geopolitical volatility, and a shifting monetary reaction function suggests that the “taste of volatility” seen in February is merely a harbinger of a more turbulent 2026. Investors are encouraged to maintain a “barbell” approach, balancing exposure to high-growth AI infrastructure with high-quality, value-oriented defensives to navigate the transition.

0 Comments/by Spencer Li
https://synapsetrading.com/wp-content/uploads/2019/10/logo.jpg 0 0 Spencer Li https://synapsetrading.com/wp-content/uploads/2019/10/logo.jpg Spencer Li2026-03-05 15:06:582026-03-05 15:22:06Monthly Market Wrap (February 2026)
Page 1 of 184123›»

Free Trading Guides

Free Trading Guides

Blog Categories

  • Beginner's Guide
  • Blockchain & Crypto
  • Book Summaries
  • Candlestick Patterns
  • Economics & News Trading
  • Investing & Portfolio Management
  • Living Your Best Life
  • Market Analysis
  • News & Events
  • Price Chart Patterns
  • Promotions
  • Risk & Money Management
  • Stock Trading
  • Testimonials
  • Tools & Resources
  • Trading Psychology
  • Trading Strategies
  • Trading Tips
  • Travel & Lifestyle

Free Trading Guides

Free Trading Guides

Contact Us

Synapse Trading Pte Ltd
Registration No. 201316168H

Whatsapp: +65-8897-1204
Telegram: @iamrecneps
Email: info@synapsetrading.com

Links

Disclaimer
Privacy policy
Terms & Conditions
Contact us
Partnerships

© 2012-2024 Synapse Trading | All rights reserved | - powered by Enfold WordPress Theme
  • Link to Facebook
  • Link to X
  • Link to Instagram
  • Link to Youtube
  • Link to LinkedIn
  • Link to Mail
Scroll to top Scroll to top Scroll to top