What Is Technical Analysis? A Trader’s Plain-English Guide
Last updated: 3 July 2026 · By Spencer Li, CFTe
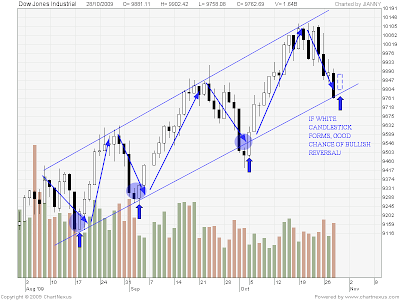
Technical analysis is the study of price patterns and trends in a market in order to trade them. It is, in effect, applied mass psychology, because a chart is the collective action of every participant in that market, drawn out in price. Technicians do not try to calculate what a stock is “really” worth. They assume the market has already priced in everything known, and they read the chart to find moments when the probabilities tilt in their favour. The big draw is speed and reach: reading a chart can take five minutes where a full valuation takes days, and the same skills transfer across stocks, forex, crypto, and commodities, because every one of those charts is just human psychology plotted over time. One honest caveat up front. Technical analysis is a calculated guess about the future built from past data. It is not a crystal ball.
Here is what it actually is, how the two schools differ, and where it stops working.
What does technical analysis actually study?
A chart is a record of every buy and sell decision in a market. Technical analysis reads that record for patterns, because crowds behave in repeatable ways at the same kinds of price levels.
That is the whole premise behind the technician’s core belief: market action discounts everything. Instead of trying to figure out the “true” value of a stock through valuation, the technician lets the market do that work and reads the consensus of all participants off the chart. The “true value” is whatever the crowd is willing to pay right now.
This is why the same skills travel. A head-and-shoulders pattern on a stock chart can be read the same way on a forex or commodity chart, because all three are pictures of the same thing: market psychology, which is just the collective psychology of individual traders. That portability is genuinely useful. If you need an immediate opinion on a market you know nothing about, the chart will give you one in minutes.
Classical vs statistical: the two schools of technical analysis
There are two main schools of thought, the classical approach and the statistical approach. Most of the noise online treats them as rivals. They are not. They answer different questions.
| What it uses | What it produces | The catch |
|---|
| Classical (chart-based) | Hand-drawn lines: support, resistance, trendlines, channels, chart patterns | Behavioural read of where the crowd acts | Subjective, two technicians can read the same chart differently |
| Statistical (data-based) | Indicators, formulas, algorithms run on the price data | Mathematical patterns and probabilities | Objective, but blind to context a human would catch |
The classical approach came first, from the days before computers, when people plotted charts on graph paper by hand and drew lines to spot behavioural patterns. It is still widely used today. The statistical approach uses data and mathematical formulas to find quantifiable patterns and estimate probabilities.
Personally, I find the best approach is to combine the two. Think of it like driving. You let the autopilot handle the calculations and feed you useful input, but in certain situations it is better to take the wheel yourself. The indicators do the arithmetic; you supply the judgement about when to trust them.
Is technical analysis art or science?
It is both, and that is the point. The two branches complement each other precisely because one is part art and one is part science.
The classical, chart-reading side carries real subjectivity. Different technicians can look at the same chart and draw different conclusions. Charts also cannot predict sudden fundamental events, things like earnings surprises, a rights issue, an M&A announcement, or an employment data release. Those arrive from outside the chart.
Hence, a technician still has to track the fundamental news that acts as a price catalyst. Reading the chart well does not excuse you from knowing what is about to hit it.
Technical analysis vs fundamental analysis: which one should you use?
You do not have to choose. Technical analysis gives you a fast way to scan markets, find opportunities, and time an entry. Fundamental analysis tells you the bigger story behind why a price is moving. Used together, you get both the timing and the reasoning.
The cleanest way to hold the relationship in your head is cause and effect. Fundamentals are the cause, the economic reasons a market moves. Technicals are the effect, the actual movement of price on the chart.
| Technical analysis | Fundamental analysis |
|---|
| Studies | Price action and the psychology behind it | Underlying value: economy, industry, company |
| Speed | Minutes per chart | Days for a full valuation |
| Best at | Timing, price targets, key levels | Explaining the “why” and long-run direction |
| Blind spot | Sudden news shocks | Precise entry and exit timing |
In the short run, cause and effect can conflict, and it is close to impossible to pin every observed price move on a specific cause. Over the long run, though, the two tend to converge. Price eventually reflects value.
There is a humbler reason to pair them. In stock investing, only the insiders truly know everything about a company. The rest of us are outsiders, and even after gathering extensive research on the company, the industry, and the country, we can still be wrong. Coupling technicals (the price consensus of every participant) with fundamentals (specific knowledge of the industry and company) simply raises your probability of a positive return. They are not mutually exclusive.
Where the human edge comes in
A platform will plot the indicators and flag the patterns for you in a second now. That part is free. What it will not do is tell you when the chart’s read conflicts with a piece of news about to land, or when a textbook-clean pattern sits in a market you should simply skip. Technical analysis finds the moments when probabilities are in your favour and projects the likely paths and key levels price may reach. Deciding which of those signals to actually trade, and which to pass, is judgement. That is the first of the Five Edges a machine cannot trade for you, and it is the part worth building.
So, treat the chart as what it is. A tool for stacking probabilities in your favour, not a window into the future.
FAQ
What is technical analysis in simple terms?
It is reading a price chart to spot patterns and trends, then trading them. Because a chart is the combined action of every market participant, technical analysis is really applied mass psychology.
Does technical analysis actually work?
It works as a way to put probabilities in your favour and to time entries, exits, and price targets. It does not forecast the future with certainty, and it cannot predict sudden news events like earnings or M&A. It is a calculated guess from past data, not a crystal ball.
What is the difference between technical and fundamental analysis?
Technical analysis studies price action to time trades quickly, often in minutes. Fundamental analysis studies underlying value to explain why a market moves, which can take days. One is the effect, the other is the cause, and they tend to converge over the long run.
Should I use technical or fundamental analysis?
For most traders, a combination works best. Use technicals for timing and key levels, and use fundamentals to understand the bigger picture and to stay ahead of news that can move the price.
Can technical analysis be used on any market?
Yes. The same skills transfer across stocks, forex, crypto, and commodities, because every chart reflects the same thing, the collective psychology of its participants. A head-and-shoulders pattern reads the same way on each.
Now that you know what technical analysis is, the natural next step is learning to read the patterns the crowd leaves behind. For the full set mapped to a simple system, read the pillar: The Definitive Guide to Trading Price Chart Patterns.
Want a system, not just signals? Grab the free 15-Minute Swing Trading Starter Kit. It is the exact routine I use to scan once a day and trade any market in 15 minutes.
About the author. Spencer Li is the founder of Synapse Trading and a Certified Financial Technician (CFTe) with 15+ years of trading across stocks, forex, crypto, commodities, and bonds. His trade log is public: every trade since April 2024, dated, losses left in. He teaches low-risk swing trading in 15 minutes a day, one system for any market.
Education, not financial advice. Synapse Trading is not licensed by MAS to advise on investment products. Trading carries risk of loss; past performance is not indicative of future results.
Related
Definitive Guide to Price Chart Patterns (pillar) · Technical analysis vs fundamental analysis · Beginner’s guide to trading and technical analysis · Expanding triangle strategy