• Link to Facebook
  • Link to X
  • Link to Instagram
  • Link to Youtube
  • Link to LinkedIn
  • Link to Mail
Synapse Trading
  • Home
  • About
    • My Background
    • My Trading Journey
    • My Travel Log
    • Media & Interviews
  • Mentoring
    • Trading Mastery Program
    • Results & Testimonials
  • Signals
    • Daily Trading Signals
    • Daily Trading Signals (Results)
  • Telegram (Free to join!)
  • Resources
    • Free Trading Guides
    • Tools & Resources
    • Blog & Infographics
  • Contact
    • Contact Us
    • Partnership Opportunities
  • Click to open the search input field Click to open the search input field Search
  • Menu Menu
Spencer Li

Inverted Hammer Candlestick Pattern Trading Strategy Guide

Technical Analysis & Price Action
Thumbnail Inverted Hammer Candlestick Pattern Trading Strategy Guide

Thumbnail Inverted Hammer Candlestick Pattern Trading Strategy Guide

The Inverted Hammer Candlestick Pattern is a powerful tool for traders looking to identify trend reversals and potential buying opportunities.

But what is the Inverted Hammer Candlestick Pattern, and how can it be used to make profitable trades?

In this blog post, I’m going to teach you all about this candlestick pattern, how to identify it, the strategies to trade it, and some practical applications of this pattern.


How to Identify the Inverted Hammer

First, let’s take a look at how to identify the Inverted Hammer Candlestick Pattern.

This pattern is formed when the following conditions are met:

  • The market is in a downtrend
  • The candlestick has a small body, typically white in color
  • The candlestick has a long upper shadow
  • The lower shadow is small or absent

In other words, the Inverted Hammer Candlestick Pattern looks like a small white candle with a long tail pointing upwards.

This pattern indicates that, while the market was initially moving downwards, buyers were able to push prices up towards the end of the trading period.

Psychology of the Pattern

The psychology behind the Inverted Hammer Candlestick Pattern is one of potential bullish reversal.

While the market was previously moving downwards, the presence of buyers able to push prices upwards suggests that the downtrend may be coming to an end.

This can be a good opportunity for traders to enter the market and potentially profit from a potential uptrend.

How to Use it to Trade

So, how can the Inverted Hammer Candlestick Pattern be used to trade?

One strategy is to look for this pattern at key support levels.

If the market is approaching a key support level and an Inverted Hammer Candlestick Pattern appears, this may be a good opportunity to enter the market and buy.

Stop loss orders can be placed below the low of the Inverted Hammer Candlestick, while profit can be taken at resistance levels or using a trailing stop.

Where to Enter a Trade

When using the Inverted Hammer Candlestick Pattern as a potential bullish reversal signal, traders can enter the market by placing a buy order at the open of the next candlestick.

This allows traders to take a position in the market as soon as possible after the pattern appears.

Where to Place the Stoploss

Stop loss orders can be placed below the low of the Inverted Hammer Candlestick.

This allows traders to limit their potential losses in case the market does not move in their favor.

Where to Take Profit on the Trade

Profit can be taken at resistance levels or using a trailing stop.

By taking profit at a resistance level, traders can capitalize on the potential uptrend.

Alternatively, a trailing stop can be used to lock in profits as the market moves in the trader’s favor.

How to Combine with Trendlines

The Inverted Hammer Candlestick Pattern can also be combined with trendlines to identify potential trend reversals.

By drawing a trendline through the lows of the candlesticks, traders can identify a potential uptrend if the Inverted Hammer Candlestick appears near the trendline.

This can be a good opportunity to enter the market and potentially profit from an uptrend.

How to Combine with Support and Resistance Levels

Support and resistance levels can also be useful in conjunction with the Inverted Hammer Candlestick Pattern.

If the market is approaching a key support level and an Inverted Hammer Candlestick appears, this may be a good opportunity to enter the market and buy.

Stop loss orders can be placed below the low of the Inverted Hammer Candlestick, while profit can be taken at resistance levels or using a trailing stop.

How to Combine with Price Patterns

The Inverted Hammer Candlestick Pattern can also be combined with other price patterns to increase the reliability of trade signals.

For example, if the Inverted Hammer Candlestick appears in conjunction with a Double Bottom pattern, this may be a particularly strong signal for a potential trend reversal.

How to Combine it with Price Action

Price action analysis is the study of the movement of a security’s price over a given period of time.

When combined with the Inverted Hammer Candlestick Pattern, price action analysis can help traders identify potential bullish reversal signals and make informed trading decisions.

To combine the Inverted Hammer Candlestick Pattern with price action analysis, traders can look for other bullish reversal patterns in conjunction with the Inverted Hammer.

For example, if the market is in a downtrend and an Inverted Hammer Candlestick appears, traders can look for other bullish reversal patterns, such as Bullish Engulfing Patterns or Hammer Patterns, to confirm the potential trend reversal.

How to Combine it with Trend-following Indicators

Trend-following technical indicators such as moving averages, MACD, and ADX can also be useful in combination with the Inverted Hammer Candlestick Pattern.

By using these indicators to confirm a potential trend reversal, traders can increase the reliability of their trade signals.

How to Combine with Oscillators

When the RSI is combined with the Inverted Hammer Candlestick Pattern, traders can look for bullish reversal signals in oversold markets.

For example, if the market is in an downtrend and the RSI is below 30, the appearance of an Inverted Hammer Candlestick Pattern may be a good opportunity to buy.

Similarly, the Stochastics indicator is a momentum oscillator that measures the location of a security’s price relative to its price range over a set period of time.

Like the RSI, the Stochastics indicator can be useful in identifying overbought and oversold conditions.

When combined with the Inverted Hammer Candlestick Pattern, traders can look for bullish reversal signals in oversold markets.

Limitations of Inverted Hammer Pattern

It’s important to keep in mind that the Inverted Hammer Candlestick Pattern is not a perfect trading tool and should not be relied upon exclusively.

It’s always important to use a range of indicators and techniques to increase the reliability of trade signals and to minimize risk.

The pattern may also be less reliable in volatile or low volume markets, as these conditions may create false signals.

Practical Applications & Tips

As a professional trader, I have a strong understanding of how to trade effectively and consistently.

This knowledge has helped me to level the playing field against other retail traders, and has given me an edge in the market.

My former experience in fund trading has also given me valuable insights into how professionals trade differently, and I have been able to apply this knowledge to my personal trading.

Finally, I make use of the principle of confluence in my trading, looking for alignment between different approaches and techniques.

I use a multi-faceted approach that combines different indicators and techniques, such as trendlines, support and resistance levels, and oscillator indicators.

This approach helps me to make the most informed trades possible, and has helped me to consistently grow my trading account.

Concluding Thoughts

In conclusion, the Inverted Hammer Candlestick Pattern is a valuable tool for traders looking to identify trend reversals and potential buying opportunities.

By combining this pattern with other techniques and indicators, traders can increase the reliability of their trade signals and maximize their chances of making profitable trades.

While the Inverted Hammer Candlestick Pattern is not a perfect trading tool, it can be a valuable addition to any trader’s toolkit.

Now that I have covered all about this candlestick pattern, is it something that you will add to your trading toolbox?

Let me know in the comments below.


ed seykota

If you would like to learn more about all the different candlestick patterns, also check out: “The Definitive Guide to Candlestick Patterns”

0 Comments/by Spencer Li
https://synapsetrading.com/wp-content/uploads/2023/01/Thumbnail-Inverted-Hammer-Candlestick-Pattern-Trading-Strategy-Guide.png 720 1280 Spencer Li https://synapsetrading.com/wp-content/uploads/2019/10/logo.jpg Spencer Li2023-01-01 16:02:412023-01-10 01:42:51Inverted Hammer Candlestick Pattern Trading Strategy Guide
Spencer Li

Weekly Market Wrap: Review of 2022 & Outlook for 2023

Market Analysis
Kolsay Lakes National Park Kazakhstan

Looking back, 2022 has been challenging for the stock market and many analysts do not have high expectations for 2023.

There is a growing consensus among analysts that there will be a selloff in the first half of next year due to negative estimates for future performance.

However, some believe that the next year could present a good opportunity to buy before the Federal Reserve (Fed) potentially needs to lower interest rates in 2024 in order to support the economy during a recession.

To protect from downside risk, the more prudent approach is to hedge by investing in inflation-related themes, or by using fixed income products such as T-bonds or T-bills.

When the yields start turning down, it would be an early indicator to rotate back into the stock market, in time for the next major bull market.

To kickstart your 2023 trading & investing journey, join our “Daily Trading Signals” Telegram channel!


Kolsay Lakes National Park Kazakhstan

[Photo: Kolsay Lakes National Park, Kazakhstan – See my full travel photo log!]

For our weekly market wrap, we go through some of the trade calls and analysis from last week, which gives us valuable insights for the week ahead.

We cover 3 main markets with a total of 200+ counters, so we will never run out of trading opportunities:

  • Forex, CFDs, commodities, bonds
  • US stocks, ETFs, global stock indices
  • Cryptocurrencies, crypto indices

By covering a broad range of markets, we can focus our attention (and capital) on whichever market currently gives the best returns.

Click here to receive all these signals in real-time for only $67 a month! You will get several signals a day, and even taking just 1 trade the whole month can easily cover the fee, so what are you waiting for?


Special Report: Review of 2022 & Outlook for 2023

The global stock market has seen a significant decrease due to high levels of inflation and aggressive actions taken by central banks, particularly the U.S. Federal Reserve, to increase interest rates.

While the energy sector has performed well, some companies that benefited from the pandemic, like DocuSign, Roku, and Peloton, have struggled. The NASDAQ Composite index, which is heavily focused on technology, has dropped by about 33% this year.

The Fed has raised interest rates by 4.25% this year and Chair Jerome Powell has indicated that more work needs to be done to reduce inflation.

Goldman Sachs analysts predict that the Fed will further increase the benchmark interest rate to between 5.0-5.2%. Goldman strategists have also stated that they do not expect the Fed to lower the interest rate until the economy is at risk of entering a recession, which they do not expect to occur next year.

Even well-known companies like Meta Platforms, Tesla, and Amazon have seen significant declines in their stock prices this year, with declines of 65%, 65%, and 50% respectively.

While the decrease in the S&P 500 index this year has primarily been due to inflation and actions taken by central banks, analysts believe that negative estimates for future performance will contribute to further declines.

Currently, the consensus among analysts is that the S&P 500 will earn around $216 in 2023, but some more optimistic analysts predict earnings of around $220, representing only slight growth compared to 2022.

On the other hand, a group of bearish analysts believe that earnings per share (EPS) will decrease by about 10% to $200. Morgan Stanley and Bank of America have been particularly bearish, stating that the bear market in stocks will not end until the S&P 500 reaches a range of 3000-3400 later this year.

The current average price target for the S&P 500 for 2023, based on forecasts from 23 analysts, is 4,080.


Weekly Market Outlook Video

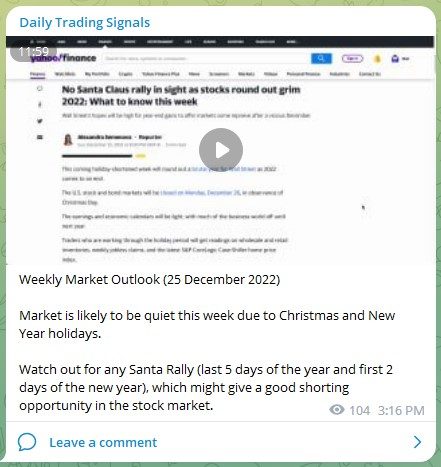
Trading Signals Weekly market outlook 251222

Weekly Market Outlook (25 December 2022)

Market is likely to be quiet this week due to Christmas and New Year holidays.

Watch out for any Santa Rally (last 5 days of the year and first 2 days of the new year), which might give a good shorting opportunity in the stock market.


Portfolio Highlights

Trading Signals Weekly portfolio updates 251222

Weekly Portfolio Updates (25 December 2022)

Added more short positions for stocks and REITs, and will continue adding more on any pullbacks.


Forex & Commodities Market Highlights

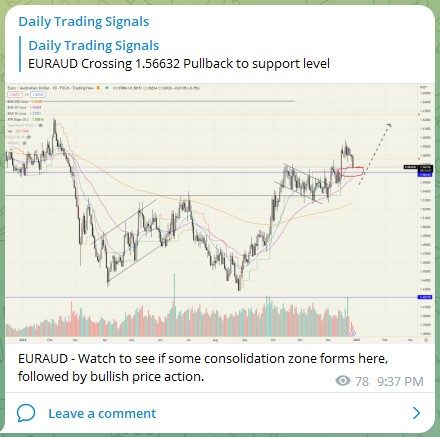
Trading Signals EURAUD 281222

EURAUD – Watch to see if some consolidation zone forms here, followed by bullish price action.


Trading Signals USDCNY 301222

USDCNY – With China opening up, the Yuan is strengthening, and this pair looks like it will be heading lower after breaking out from the bear flag/pennant pattern.


Trading Signals USDSGD 301222

USDSGD – Looks like this is going to continue heading down to test the major support level, which is the bottom of the wide range.


Trading Signals CADJPY 301222 1

CADJPY – And the downtrend continues, congrats to those who are also holding short positions! 💰🔥💪🏻


Stock & Bond Market Highlights

Trading Signals US100 301222

US100 (NASDAQ 100) – After dropping about 12% from the recent swing highs, it is now testing major support.

Currently, there is a good chance it will test previous lows and even break new lows.

If it manages to make a U-turn and break above the previous swing high of aounrd 12400, then there is a good chance of a market reversal.


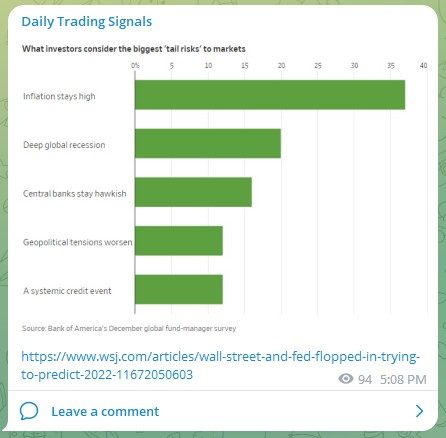
Trading Signals inflation news 271222

https://www.wsj.com/articles/wall-street-and-fed-flopped-in-trying-to-predict-2022-11672050603


Click here to receive all these signals in real-time for only $67 a month! You will get several signals a day, and even taking just 1 trade the whole month can easily cover the fee, so what are you waiting for?

Good luck, and may next week bring more excellent profits!

0 Comments/by Spencer Li
https://synapsetrading.com/wp-content/uploads/2022/12/Kolsay-Lakes-National-Park-Kazakhstan.jpg 1536 2048 Spencer Li https://synapsetrading.com/wp-content/uploads/2019/10/logo.jpg Spencer Li2022-12-30 02:12:452023-01-01 03:40:49Weekly Market Wrap: Review of 2022 & Outlook for 2023
Spencer Li

Hanging Man Candlestick Pattern Trading Strategy Guide

Technical Analysis & Price Action
Thumbnail Hanging Man Candlestick Pattern Trading Strategy Guide

Thumbnail Hanging Man Candlestick Pattern Trading Strategy Guide


The Hanging Man Candlestick Pattern is a technical analysis tool used in trading to identify potential reversals in the market.

This pattern is formed when the price of an asset opens at a high and then closes lower, creating a candle with a long downward wick and a small body.

The pattern gets its name from the shape of the candle, which looks like a person hanging by their feet.

While it is not as well-known as other candlestick patterns, such as the Bullish Engulfing Pattern or the Bearish Engulfing Pattern, the Hanging Man Pattern can be a valuable tool for traders looking to enter or exit a position.

In this blog post, I’m going to teach you all about this candlestick pattern, how to identify it, the strategies to trade it, and some practical applications of this pattern.


How to Identify the Hanging Man

  • The Hanging Man Pattern is characterized by a small body and a long downward wick.
  • The small body can be either bullish or bearish, but the long downward wick is always bearish.
  • The body of the candle is typically located at the top of the candle, near the open price, and the downward wick extends below the body.

Psychology of the Pattern

  • The Hanging Man Pattern is often seen as a bearish reversal pattern, indicating that the price may be about to fall after a uptrend.
  • This pattern suggests that the bears are starting to gain control of the market, as they push the price down from the high open.
  • However, it is important to note that the Hanging Man Pattern is not always a strong reversal signal and should be used in conjunction with other technical analysis tools.

How to Use it to Trade

  • One way to use the Hanging Man Pattern is to trade the reversal by selling a long position or buying a short position.
  • Another way to trade the pattern is to wait for confirmation of the reversal, such as with a bearish candle following the Hanging Man Pattern.
  • It is also important to consider the overall trend and the strength of the pattern when making a trade decision.

Trading Strategies for the Hanging Man Pattern

  • One strategy for trading the Hanging Man Pattern is to enter a short position after the pattern has formed and wait for the price to fall.
  • Another strategy is to enter a long position on a breakout above the high of the Hanging Man Pattern, as this may indicate a continuation of the uptrend.
  • It is also possible to use the Hanging Man Pattern as a stop loss strategy, by placing a stop loss order below the low of the pattern.

Where to Enter a Trade

  • One option for entering a trade based on the Hanging Man Pattern is to place a market order at the open of the next candle following the pattern.
  • Another option is to use a limit order, setting the entry price at a level above or below the pattern, depending on the direction of the trade.

Where to Place the Stoploss

  • One option for placing a stop loss when trading the Hanging Man Pattern is to use a percentage of the asset’s trading range, such as 2-3%.
  • Another option is to place the stop loss at a level below the low of the Hanging Man Pattern, as this may provide a clear level for the stop loss to be triggered if the price moves against the trade.

Where to Take Profit on the Trade

  • One way to take profit when trading the Hanging Man Pattern is to use a target price based on the size of the pattern and the expected move.
  • Another option is to use a trailing stop loss, which allows the trade to remain open as long as the price continues to move in the desired direction.

How to Combine with Trendlines

  • Trendlines can be a useful tool for identifying the trend  and potential reversal points in the market. When combined with the Hanging Man Pattern, trendlines can help traders confirm the reversal signal and make more informed trade decisions.
  • For example, if the Hanging Man Pattern forms after an uptrend and is accompanied by a trendline break, this may provide further confirmation of a potential trend reversal.
  • Similarly, if the Hanging Man Pattern forms after a downtrend and is accompanied by a trendline bounce, this may indicate a potential trend continuation.

How to Combine with Support and Resistance Levels

  • Support and resistance levels can also be useful for identifying potential reversal points in the market. When combined with the Hanging Man Pattern, these levels can help traders confirm the reversal signal and make more informed trade decisions.
  • For example, if the Hanging Man Pattern forms near a strong support level, this may indicate that the price is likely to bounce off the support and continue the uptrend.
  • On the other hand, if the Hanging Man Pattern forms near a strong resistance level, this may indicate that the price is likely to break through the resistance and continue the downtrend.

How to Combine with Price Patterns

  • Combining the Hanging Man Pattern with other price patterns, such as head and shoulders or double tops, can also provide further confirmation of a potential trend reversal.
  • For example, if the Hanging Man Pattern forms at the top of a head and shoulders pattern, this may indicate that the price is about to reverse and move lower.
  • Similarly, if the Hanging Man Pattern forms at the top of a double top pattern, this may also indicate a potential trend reversal to the downside.

How to Combine it with Price Action

  • Price action trading involves analyzing the movement of the price itself, rather than relying on indicators or other technical analysis tools. Combining the Hanging Man Pattern with price action analysis can provide a more complete picture of the market and help traders make more informed trade decisions.
  • For example, traders can look for other price action signals, such as bearish engulfing patterns or bearish harami patterns, to confirm the reversal signal provided by the Hanging Man Pattern.

How to Combine it with Trend-following Indicators

  • Trend-following technical indicators, such as moving averages and MACD, can be useful for identifying the overall trend and potential reversal points in the market. When combined with the Hanging Man Pattern, these indicators can help traders confirm the reversal signal and make more informed trade decisions.
  • For example, if the Hanging Man Pattern forms after an uptrend and is accompanied by a bearish crossover in the moving averages or a bearish divergence in the MACD, this may provide further confirmation of a potential trend reversal.

How to Combine with Oscillators

  • Oscillator indicators, such as RSI and Stochastics, can be useful for identifying overbought and oversold conditions in the market. When combined with the Hanging Man Pattern, these indicators can help traders confirm the reversal signal and make more informed trade decisions.
  • For example, if the Hanging Man Pattern forms after an uptrend and is accompanied by an overbought reading in the RSI or a bearish crossover in the Stochastics, this may provide further confirmation of a potential trend reversal.

Limitations of Hanging Man Pattern

  • It is important to note that the Hanging Man Pattern is not a reliable reversal signal on its own and should be used in conjunction with other technical analysis tools.
  • The pattern may also be less reliable in volatile or low volume markets, as these conditions may create false signals.
  • Additionally, the Hanging Man Pattern may not always indicate a trend reversal, as it can also occur during a consolidation or sideways movement in the market.

Practical Applications

The Hanging Man Pattern has helped me in my personal trading by providing potential reversal signals that I can use to enter or exit positions.

For example, when trading for a living as a full-time trader, it is important to be able to identify potential reversals in order to maximize profits and minimize losses.

By using the Hanging Man Pattern as one of my technical analysis tools, I have been able to improve my trade timing and make more informed decisions about when to enter or exit a position.

As a professional trader, I have found that the Hanging Man Pattern can be a valuable tool for identifying potential reversals in the market.

By using this pattern in combination with other technical analysis tools, such as trendlines and oscillator indicators, I have been able to improve my trade accuracy and increase my profits.

For example, when the Hanging Man Pattern forms at a key resistance level and is accompanied by a bearish divergence in the RSI, I have often found this to be a strong signal to sell.

Concluding Thoughts

In conclusion, the Hanging Man Candlestick Pattern is a technical analysis tool that can be used to identify potential reversals in the market.

While it is not a reliable signal on its own, it can be a useful tool when combined with other technical analysis techniques, such as trendlines, support and resistance levels, and oscillator indicators.

By using the Hanging Man Pattern in my personal trading, I have been able to improve my trade timing and make more informed decisions about when to enter or exit a position.

However, it is important to remember that no single technical analysis tool is foolproof and that it is always important to consider the overall market conditions when making trade decisions.

Now that I have covered all about this candlestick pattern, is it something that you will add to your trading toolbox?

Let me know in the comments below.


ed seykota

If you would like to learn more about all the different candlestick patterns, also check out: “The Definitive Guide to Candlestick Patterns”
0 Comments/by Spencer Li
https://synapsetrading.com/wp-content/uploads/2022/12/Thumbnail-Hanging-Man-Candlestick-Pattern-Trading-Strategy-Guide.png 720 1280 Spencer Li https://synapsetrading.com/wp-content/uploads/2019/10/logo.jpg Spencer Li2022-12-27 01:40:032023-01-10 01:43:12Hanging Man Candlestick Pattern Trading Strategy Guide
Spencer Li

Book Summary: Security Analysis by Benjamin Graham

Book Summaries
Thumbnail Security Analysis by Benjamin Graham

Security Analysis by Benjamin Graham: Summary, Key Ideas, and How to Apply Them

Last updated: 3 July 2026 · By Spencer Li, CFTe


Security Analysis, written by Benjamin Graham (with David Dodd) and first published in 1934, is the founding textbook of value investing: it teaches you to buy a security for less than its intrinsic value, the worth you arrive at by analysing the actual business rather than the price ticker. The book’s core argument is simple and still holds 90 years later. Price is what the market is feeling today. Value is what the company is actually worth, which you estimate from its earnings, dividends, balance sheet, and debt. When price falls far below value, you have a margin of safety, and that gap is where careful investors make their money. Graham wrote it for professionals, and it is dense, but the central discipline (analyse the business, ignore the crowd, demand a cushion) is something any serious investor can use. This post gives you the summary, the 10 key ideas, and 10 ways to put them to work.

Here is who Graham was, what the book covers, and how to apply it without needing to read all 700 pages first.

Who was Benjamin Graham?

Benjamin Graham was born in London in 1894 and moved to the United States as a young boy. He studied finance and economics at Columbia University, then worked as a stockbroker and analyst before returning to Columbia to teach.

One of his students there was a young Warren Buffett, who later called Graham the second most influential person in his life after his own father. That lineage matters. When people talk about “value investing” today, they are talking about the framework Graham built in this book and refined later in The Intelligent Investor.

What is Security Analysis about?

The book is a comprehensive guide to analysing and valuing stocks, bonds, and other securities. It is built in three parts: the principles of security analysis, the analysis of common stocks, and the analysis of bonds and preferred stocks.

The main theme running through all three is fundamental analysis (studying a company’s financial statements and business data to estimate what it is genuinely worth). Graham’s claim is that if you do this work carefully, you can find securities the market has mispriced, buy them below their intrinsic value, and wait for the gap to close.

Personally, I read this book less as a stock-picking manual and more as a discipline. The specific accounting rules from 1934 have aged. The mindset (be a business analyst, not a price chaser) has not.

The 10 key ideas, at a glance

Graham covers a lot, but the practical core comes down to ten ideas. Here they are side by side with how I would act on each one.

Key ideaWhat it meansHow to apply it
1. Fundamental analysis comes firstStudy the business, not the chartRead the financials before you form an opinion on price
2. Intrinsic value over market priceWhat it is worth vs what it is quoted atEstimate value independently, then compare to price
3. Earnings and dividends signal healthA company’s real output, not its storyTrack earnings trends and dividend reliability over years
4. The P/E ratio is a quick checkPrice-to-earnings, price paid per dollar of profitUse P/E to flag rich or cheap, then dig deeper
5. Strong balance sheets, low debtFinancial stability survives bad yearsFavour low debt and solid assets over a good narrative
6. Diversify to reduce riskNo single position can sink youSpread holdings across companies and sectors
7. Growth stocks: higher reward, higher riskMore upside, more ways to be wrongSize growth bets smaller and demand a real edge
8. Value stocks: slower, steadier upsideUndervalued now, room to re-rate laterBuy the gap between price and intrinsic value
9. Review and rebalance regularlyPortfolios drift away from your planSchedule reviews; trim winners, top up to target
10. Sentiment moves price, not valueThe crowd is loud but not always rightUse sentiment as context, never as the whole thesis

Do note that, the famous “margin of safety” idea sits underneath all ten. Graham’s point is that you will get your valuation wrong sometimes, so you buy with enough of a cushion that being a little wrong still leaves you safe.

How do you apply Security Analysis as a trader?

Most readers of this book are long-term investors, and the applications above are built for that. But the discipline carries over to trading too, and that is the part I find most useful.

Three of Graham’s points are written as investing advice, but they work just as well as risk and behaviour rules:

  • Develop a long-term plan and stick to it. A system you abandon under pressure is worse than no system. Decide your rules when you are calm, then follow them when you are not.
  • Manage risk deliberately. Graham wrote about position sizing and protecting capital long before the phrase “risk management” was common. Stops, sizing, and a hard loss limit are the modern version.
  • Stay disciplined and avoid emotional decisions. The crowd’s mood is the most expensive thing you can trade on. Graham’s whole method is built to keep you anchored to data when sentiment is screaming.

He also flags the practical drags people forget: taxes and fees eat returns, inflation quietly erodes them, and the broader economy sets the backdrop for everything. And the most personal point of all, your own goals and risk tolerance should shape your strategy, not someone else’s hot tip.

One honest caveat. Graham suggests working with a financial advisor, which made sense for his 1934 audience. Today you have more tools and more information than any 1930s investor could dream of, so the bigger risk is not lack of access, it is lack of discipline.

Where the human edge comes in

Here is the part that has not changed in 90 years, and will not change with AI either. A model can pull a company’s financials, compute its P/E, and screen for low-debt balance sheets in seconds. That part is now nearly free. What it will not do is tell you how much margin of safety you personally need to sleep at night, or stop you from selling a sound business in a panic because the crowd is. Graham’s edge was never the arithmetic. It was the temperament to act on value when price said otherwise. That judgment, and the discipline to hold it, is the part worth building, and it is the first of the Five Edges no screener can supply.

FAQ

What is Security Analysis by Benjamin Graham about?
It is the founding textbook of value investing. It teaches fundamental analysis: studying a company’s financial statements to estimate its intrinsic value, then buying securities trading below that value with a margin of safety.

What is the main idea of Security Analysis?
That price and value are different things. Price is what the market quotes today; value is what the business is actually worth. The investor’s job is to estimate value independently and buy when price falls well below it.

Is Security Analysis worth reading today?
The specific accounting examples from 1934 have dated, but the core discipline (analyse the business, ignore the crowd, demand a margin of safety) is as relevant as ever. For most readers, The Intelligent Investor is the easier starting point, and Security Analysis is the deeper follow-up.

What is the difference between Security Analysis and The Intelligent Investor?
Security Analysis (1934) is the dense, technical textbook written for professionals. The Intelligent Investor (1949) is Graham’s more accessible book for the general investor, and the one Buffett recommends people start with.

What is the margin of safety?
It is the gap between a security’s price and your estimate of its intrinsic value. Buying with a margin of safety means you have a cushion, so even if your valuation is somewhat wrong, you are still protected from a large loss.


Now that you have the summary and the ten ideas, would you add this one to your reading list? And for those who have already read it, what stuck with you most? Let me know in the comments.

If you want the full set of investing classics worth your time, read the roundup: Best Investing and Trading Books of All Time.

Want a system you can actually run? Grab the free 15-Minute Swing Trading Starter Kit, the exact routine I use to scan once a day and trade any market in 15 minutes.


About the author. Spencer Li is the founder of Synapse Trading and a Certified Financial Technician (CFTe) with 15+ years of trading across stocks, forex, crypto, commodities, and bonds. His trade log is public: every trade since April 2024, dated, losses left in. He has taught a 15-minute daily trading routine since 2014, one system for any market.

Education, not financial advice. Synapse Trading is not licensed by MAS to advise on investment products. Trading carries risk of loss; past performance is not indicative of future results.


Related

Best Investing and Trading Books of All Time (pillar) · The Intelligent Investor summary · Fundamental analysis vs technical analysis

0 Comments/by Spencer Li
https://synapsetrading.com/wp-content/uploads/2022/12/Thumbnail-Security-Analysis-by-Benjamin-Graham.png 720 1280 Spencer Li https://synapsetrading.com/wp-content/uploads/2019/10/logo.jpg Spencer Li2022-12-25 01:00:032026-10-05 12:13:13Book Summary: Security Analysis by Benjamin Graham
Spencer Li

Book Summary: The Intelligent Investor by Benjamin Graham

Book Summaries
Thumbnail The Intelligent Investor by Benjamin Graham

The Intelligent Investor by Benjamin Graham: Summary, Key Ideas, and How to Apply Them

Last updated: 3 July 2026 · By Spencer Li, CFTe


The Intelligent Investor, written by Benjamin Graham and first published in 1949, is the most widely recommended book on value investing: it teaches you to buy a stock for less than the underlying business is worth, and to treat the market as a moody business partner rather than a source of truth. Graham’s core argument is simple and has held up for 75 years. Price is what the market is feeling today. Value is what the company is actually worth, which you estimate from its earnings, assets, and debt. When price falls well below value, you have a margin of safety, the cushion that protects you when your estimate is a little wrong. Warren Buffett, who studied under Graham, calls this “by far the best book on investing ever written.” It is conservative by design and built for the long term, not for quick trades. This post gives you the summary, the 10 key ideas, and 10 ways to put them to work.

Here is who Graham was, what the book covers, and how to apply it without reading all four parts first.

Who was Benjamin Graham?

Benjamin Graham was a renowned investor and financial theorist, often called the “father of value investing.”

He was born in London in 1894 and immigrated to the United States with his family as a child. He earned his bachelor’s degree in economics from Columbia University, then an MBA there as well. After graduating he worked on Wall Street as a stockbroker before starting his own investment firm.

Graham’s philosophy was built on one idea: investors should focus on the intrinsic value of a company (what the business is genuinely worth), not just its stock price. That approach is value investing, which means identifying undervalued companies with strong financials and holding them for the long term. One of his students at Columbia was a young Warren Buffett, which is why this 1949 book still anchors how serious investors think today.

What is The Intelligent Investor about?

The book is a comprehensive guide to Graham’s value-investing philosophy, divided into four parts, each covering a different aspect of investing.

  • Part 1, General Principles. The core of the philosophy: the importance of a margin of safety, the difference between speculating and investing, the role of diversification, the case for a long-term perspective, and the dangers of overconfidence.
  • Part 2, Types of Securities. The instruments you can choose from (stocks, bonds, cash), the difference between growth and value stocks, and how to evaluate them using fundamental analysis (studying a company’s financial statements to judge its worth).
  • Part 3, Management of Investment Funds. How different funds work (mutual funds, pension funds), the role of professional money managers, and how to judge their performance.
  • Part 4, Investment Policies for the Individual Investor. The specific policies an individual should set: a clear written investment policy, the role of patience and discipline, and how to manage the risk that comes with investing.

Personally, I read this less as a stock-picking manual and more as a temperament manual. The specific numbers from 1949 have dated. The mindset (be a business owner, not a price chaser) has not.

The 10 key ideas, at a glance

Graham covers a lot of ground, but the practical core comes down to ten ideas. Here they are side by side with how I would act on each one.

Key ideaWhat it meansHow to apply it
1. Value investingBuy undervalued assets with long-term upsideEstimate intrinsic value first, then compare to price
2. DiversificationSpread risk so no single position can sink youHold across companies and sectors, not one bet
3. Margin of safetyThe gap between intrinsic value and market priceOnly buy when price sits well below your value estimate
4. Long-term focusShort-term moves are noisy and misleadingJudge the business over years, not the ticker over days
5. Market psychologyThe crowd follows feelings, not factsUse sentiment as context, never as the thesis
6. Risk managementMatch risk to what you can actually stomachSet your risk level first, then diversify to fit it
7. Compound interestReturns snowball when you start earlyStart saving and investing as soon as you can
8. Investment principlesDiscipline and patience beat clevernessWrite your rules down and follow them under pressure
9. Stock pickingFinancials and management reveal real qualityRead the statements before you form a price opinion
10. Market historyCycles rhyme, even when they do not repeatStudy past markets so you recognise the pattern live

Do note that, the famous “margin of safety” idea sits underneath all ten. Graham’s point is that you will get your valuation wrong sometimes, so you buy with enough of a cushion that being a little wrong still leaves you safe.

How do you apply The Intelligent Investor?

The ten ideas are principles. Here are ten concrete ways to act on them, drawn straight from the book.

  1. Start saving and investing as early as possible, so compound interest has time to work.
  2. Diversify your portfolio to spread risk and soften the impact of any single holding.
  3. Use the margin of safety: look for undervalued assets with real long-term potential.
  4. Take a long-term view. Focus on returns over years instead of trying to time the market.
  5. Do not get swept up by market psychology and emotion. Stay disciplined and stick to your plan.
  6. Decide how much risk you can actually carry, then diversify to match it.
  7. When evaluating a stock, favour companies with strong financials and a capable management team.
  8. Stay informed on market trends, but be wary of sensationalised headlines and hype.
  9. Consider seeking guidance from a qualified professional if you want a second set of eyes.
  10. Review and reassess your portfolio regularly to keep it aligned with your goals and risk tolerance.

A few honest caveats from the book itself. It was written in 1949, so some of the specifics are out of date. The core principles (margin of safety, diversification, fundamental analysis, a long-term horizon) are still relevant. Graham’s approach is more conservative than most, and value investing will not suit everyone. If you are chasing high-risk, high-reward bets, this is not your book. Match the strategy to your own goals and risk tolerance, not to someone else’s hot tip.

Where the human edge comes in

Here is the part that has not changed in 75 years, and will not change with AI either. A model can screen for low-debt balance sheets, compute a company’s intrinsic value, and rank undervalued stocks in seconds. That part is now nearly free. What it will not do is tell you how much margin of safety you personally need to sleep at night, or stop you from selling a sound business in a panic because the crowd is panicking. Graham’s edge was never the arithmetic. It was the temperament to act on value when price said otherwise. That judgment, and the discipline to hold it, is the part worth building, and it is the first of the Five Edges no screener can supply.

FAQ

What is The Intelligent Investor about?
It is the foundational book on value investing. It teaches you to estimate a company’s intrinsic value from its fundamentals, buy when the market price sits well below that value (a margin of safety), and hold for the long term while ignoring the crowd’s mood.

What is the main idea of The Intelligent Investor?
That price and value are different things. Price is what the market quotes today; value is what the business is actually worth. The intelligent investor estimates value independently and buys only when price falls far enough below it to leave a cushion.

Is The Intelligent Investor still worth reading today?
Yes. The 1949 specifics have dated, but the core discipline (margin of safety, diversification, fundamental analysis, a long-term horizon) is as relevant as ever. It is the book most professionals recommend a new investor start with.

What is the difference between The Intelligent Investor and Security Analysis?
Security Analysis (1934) is Graham’s dense, technical textbook written for professionals. The Intelligent Investor (1949) is his more accessible book for the general investor, and the one Buffett tells people to read first.

What is the margin of safety?
It is the gap between a stock’s price and your estimate of its intrinsic value. Buying with a margin of safety means you have a cushion, so even if your valuation is somewhat wrong, you are still protected from a large loss.


Now that you have the summary and the ten ideas, would you add this one to your reading list? And for those who have already read it, what were your key takeaways? Let me know in the comments.

If you want the full set of investing classics worth your time, read the roundup: Best Investing and Trading Books of All Time.

Want a system you can actually run? Grab the free 15-Minute Swing Trading Starter Kit, the exact routine I use to scan once a day and trade any market in 15 minutes.


About the author. Spencer Li is the founder of Synapse Trading and a Certified Financial Technician (CFTe) with 15+ years of trading across stocks, forex, crypto, commodities, and bonds. His trade log is public: every trade since April 2024, dated, losses left in. He has taught a 15-minute daily trading routine since 2014, one system for any market.

Education, not financial advice. Synapse Trading is not licensed by MAS to advise on investment products. Trading carries risk of loss; past performance is not indicative of future results.


Related

Best Investing and Trading Books of All Time (pillar) · Security Analysis by Benjamin Graham summary · Common Sense on Mutual Funds (Bogle) summary

0 Comments/by Spencer Li
https://synapsetrading.com/wp-content/uploads/2022/12/Thumbnail-The-Intelligent-Investor-by-Benjamin-Graham.png 720 1280 Spencer Li https://synapsetrading.com/wp-content/uploads/2019/10/logo.jpg Spencer Li2022-12-24 03:18:542026-10-05 12:13:18Book Summary: The Intelligent Investor by Benjamin Graham
Page 52 of 184«‹5051525354›»

Free Trading Guides

Free Trading Guides

Blog Categories

  • Beginner's Guide
  • Blockchain & Crypto
  • Book Summaries
  • Economics & News Trading
  • Investing & Portfolio Management
  • Living Your Best Life
  • Market Analysis
  • Markets & Products
  • News & Events
  • Promotions
  • Risk & Money Management
  • Stock Trading
  • Technical Analysis & Price Action
  • Testimonials
  • Tools & Resources
  • Trading Psychology
  • Trading Strategies
  • Trading Tips
  • Travel & Lifestyle

Free Trading Guides

Free Trading Guides

Contact Us

Synapse Trading Pte Ltd
Registration No. 201316168H

Whatsapp: +65-8897-1204
Telegram: @iamrecneps
Email: info@synapsetrading.com

Links

Disclaimer
Privacy policy
Terms & Conditions
Contact us
Partnerships

© 2012-2026 Synapse Trading | All rights reserved | - powered by Enfold WordPress Theme
  • Link to Facebook
  • Link to X
  • Link to Instagram
  • Link to Youtube
  • Link to LinkedIn
  • Link to Mail
Scroll to top Scroll to top Scroll to top