• Link to Facebook
  • Link to X
  • Link to Instagram
  • Link to Youtube
  • Link to LinkedIn
  • Link to Mail
Synapse Trading
  • Home
  • About
    • My Background
    • My Trading Journey
    • My Travel Log
    • Media & Interviews
  • Mentoring
    • Trading Mastery Program
    • Results & Testimonials
  • Signals
    • Telegram (Free to join!)
    • Daily Trading Signals
    • Daily Trading Signals (Results)
  • Resources
    • Free Trading Guides
    • Tools & Resources
    • Blog & Infographics
  • Contact
    • Contact Us
    • Partnership Opportunities
  • Click to open the search input field Click to open the search input field Search
  • Menu Menu
Spencer Li

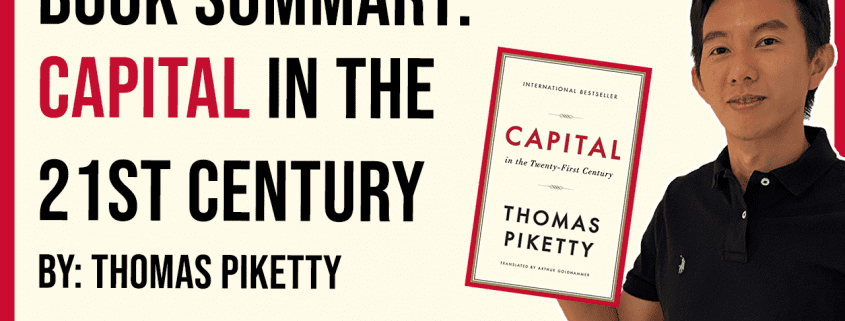
Book Summary: Capital in the Twenty-First Century by Thomas Piketty

Book Summaries
thumbnail Book Summary Capital in the Twenty First Century by Thomas Piketty

Capital in the Twenty-First Century (Piketty): Summary, Key Ideas, and What It Means for Investors

Last updated: 3 July 2026 · By Spencer Li, CFTe


“Capital in the Twenty-First Century” by Thomas Piketty argues that wealth grows faster than wages, so without deliberate intervention, capital piles up in fewer and fewer hands over time. His central finding, drawn from over two centuries of tax and income data across many countries, is captured in one short inequality: r is greater than g. Here r is the return on capital (what money makes when it is invested, roughly 4 to 5 percent historically) and g is the growth rate of the economy (how fast wages and output rise, often closer to 1 to 2 percent). When the return on owning things outpaces the growth of earning a living, the people who already own capital pull steadily ahead of the people who work for a paycheck. Piketty’s policy fix is a global tax on wealth. His warning is that left alone, this gap widens until it threatens social and political stability. For an investor, the uncomfortable practical reading is simpler still: if capital compounds faster than labour, you want to be an owner of capital, not only a seller of your time.

I read this as a trader, not as an economist, and the book is worth your attention even if you disagree with every policy in it. Here is what is actually in it, the one equation that carries the whole argument, the criticisms worth knowing, and the way I think an investor should take it.

Who is Thomas Piketty?

Thomas Piketty is a French economist and a professor at the École des Hautes Études en Sciences Sociales in Paris. He built his reputation on the patient, unglamorous work of assembling long-run data on income and wealth, going back through tax records spanning more than two hundred years and many countries. “Capital in the Twenty-First Century,” published in 2013, is his best-known work, and it turned a dense academic project into a global bestseller and a genuine public argument about inequality.

What makes him worth reading is the data, not the slogans. Whatever you think of his conclusions, the historical record he assembled is the real contribution. Hence even his critics tend to argue with his interpretation rather than dismiss the evidence outright.

What is the book actually about?

The book makes one big claim and defends it with history: wealth inequality is not a passing accident of capitalism but a built-in tendency, and it has waxed and waned for specific historical and political reasons, not natural ones.

Piketty’s reasoning runs like this. Over the long sweep of history, the return on capital has usually been higher than the growth rate of the overall economy. Money already invested grows faster than the economy that working people earn their living from. So the share of total wealth held by those who already own capital tends to rise, decade after decade, unless something interrupts it. The twentieth century did interrupt it, through two world wars, the Great Depression, and high post-war taxes, which destroyed or redistributed a lot of capital. Piketty’s worry is that the second half of the twentieth century was the exception, and that without deliberate action, the old pattern of high concentration returns.

He argues this matters for two reasons. It is a moral problem, because extreme concentration is hard to square with a fair society. And it is an economic and political one, because too much concentration can breed instability and, he argues, even drag on growth. His proposed remedy is a coordinated global tax on wealth, which he concedes is politically difficult. His view is that ordinary tools, like progressive income tax alone, are not enough to offset the r-minus-g engine.

The one equation: r is greater than g

If you remember one thing from this book, make it this. The whole argument compresses into a single comparison between two rates.

  • r is the rate of return on capital: what wealth earns when it is invested, across stocks, bonds, real estate, and business ownership. Piketty puts the long-run figure at roughly 4 to 5 percent.
  • g is the growth rate of the economy: how fast total output and, broadly, wages grow. Historically this is often lower, closer to 1 to 2 percent over long stretches.

When r is greater than g, capital grows faster than the economy that wages come from. The gap between the two, r minus g, is what Piketty says sets the speed of wealth concentration. The bigger that gap, the faster wealth pools at the top. This is also why inherited wealth matters so much in his account: when old money compounds faster than the economy grows, fortunes built generations ago can outpace fortunes earned through work today.

Do note that r is greater than g is a description of a historical tendency, not an iron law of physics. It can be, and has been, overridden, by war, by depression, by tax policy, and by faster economic growth. That nuance gets lost in the slogan, and it matters for the criticisms below.

The key ideas, without the repetition

The original summary lists ten points that mostly restate one another. Stripped down, Piketty is really making five arguments:

  1. Wealth inequality is persistent, not random. Concentration of wealth has recurred across countries and centuries. It is a feature of the system, not a glitch.
  2. It is political and historical, not natural. The level of inequality is shaped by wars, crises, and policy choices, so it can be changed by different choices.
  3. r greater than g is the engine. When the return on capital outpaces economic growth, wealth concentrates, and the size of that gap sets the pace.
  4. Inherited wealth compounds the effect. Old capital growing faster than new earnings entrenches advantage across generations.
  5. Ordinary fixes are not enough, in his view. Progressive income tax alone does not offset the engine; Piketty’s headline proposal is a coordinated global wealth tax.

Capital income vs labour income

Here is the tension at the heart of the book, laid out plainly. It is the difference between making money by owning things and making money by working.

Capital income (owning)Labour income (working)
SourceReturns on stocks, bonds, property, businessesWages and salary for your time
Long-run growth rater, historically about 4 to 5 percentTied to g, often about 1 to 2 percent
Scales withCapital already owned (and it compounds)Hours in the day (it does not compound)
Who benefits mostThose who already hold wealth, including heirsThose still building from a paycheck
Piketty’s worryPulls steadily ahead over timeFalls behind unless growth is fast

The table is not investment advice, and it is not a promise that capital always beats labour every year (in any single decade it may not). It is the long-horizon picture Piketty draws from the data, and it is the reason an investor cannot ignore the book even while disagreeing with its politics.

The criticisms worth knowing

Piketty’s work has drawn both heavy praise and serious pushback, and a fair summary has to include both.

Some economists have questioned the accuracy and comprehensiveness of his data, or how he stitched different historical sources together. Others accept the data but reject the conclusions, arguing that the proposed remedies, a global wealth tax above all, are politically unrealistic or could do more harm than good by discouraging investment. There are also technical debates about whether r reliably stays above g in the future, or whether faster growth and changing returns could close the gap on their own.

Personally, I take the historical record more seriously than the policy prescription. You can think the diagnosis is largely right and the prescribed cure is unworkable, and many reasonable people land exactly there. The honest move is to read the data with a critical eye, hold both the evidence and the objections in mind, and not treat the book as either gospel or propaganda. It offers a framework for thinking about the problem, not a one-size-fits-all solution.

How should an investor read this book?

This is where most trading-blog summaries go wrong. They turn Piketty into a political to-do list, vote this way, donate here, advocate for that. That is the author’s call to action, and you are free to take it or leave it. It is not the part that changes how you handle your own money.

The part that should change your behaviour is the engine itself. If, over a lifetime, capital tends to compound faster than wages grow, then the single most important financial decision most people make is whether they ever cross from being only a seller of their time to also being an owner of capital. You do not need to agree with the global wealth tax to take that lesson. Hence the practical, unglamorous reading of a 700-page book about inequality is this: get on the ownership side of the line, start early, and let compounding do the slow work that r is greater than g describes.

That is also where it connects to everything else on this site. Buying assets is owning capital. Trading is one active way to grow it, and long-term investing is another. The book is a reminder of why building and holding capital matters in the first place, underneath any particular strategy. Read it alongside the case for low-cost long-term ownership in The Little Book of Common Sense Investing and the local picture of how wealth actually stacks up in the report on the net worth of the average Singaporean.

Where the human edge comes in

A model can tell you r is greater than g. It can even tell you, on average, that owning capital beats selling your time. What it cannot do is decide your split, how much of your life energy you convert into owned assets versus how much you spend, when to start, and whether you have the discipline to keep compounding through the decade when the gap closes and ownership feels like a bad idea. Piketty supplies the macro fact. The judgment about what you personally do with it is yours, and that is the first of the Five Edges no equation can supply for you.

FAQ

What is the main message of Capital in the Twenty-First Century?
The main message is that wealth tends to grow faster than the economy, summed up as r is greater than g, so capital concentrates in fewer hands over time unless deliberate policy intervenes. Piketty argues this is a recurring historical pattern, not a natural inevitability, and proposes a global wealth tax to counter it.

What does r is greater than g mean?
It means the return on capital (r), historically about 4 to 5 percent, has usually been higher than the growth rate of the economy (g), often about 1 to 2 percent. When money already invested grows faster than wages and output, those who own capital pull ahead of those who earn a salary, and the gap, r minus g, sets how fast wealth concentrates.

Is Capital in the Twenty-First Century worth reading?
Yes, especially for the long-run historical data on income and wealth, which is the book’s real contribution. It is long and dense, and many readers disagree with its policy proposals, but the underlying picture of how capital compounds relative to wages is valuable for anyone thinking about building wealth.

What are the main criticisms of Piketty’s book?
Critics have questioned the accuracy and stitching of his historical data, argued that his proposed global wealth tax is politically unrealistic or economically harmful, and debated whether r will reliably stay above g in the future. A common position is to accept much of the diagnosis while rejecting the prescribed cure.

What is the practical takeaway for an investor?
If capital compounds faster than wages over the long run, the key decision is whether you ever become an owner of capital rather than only a seller of your time. The investor-side reading of the book is to get on the ownership side early and let compounding work, regardless of where you land on its politics.


Now that you have Piketty’s core argument and the one equation behind it, the real question is what you do with it: are you building capital, or only earning wages? Have you read this one? Let me know your key takeaway in the comments.

For more, browse the full shelf: Best Investing and Trading Books of All Time.

Want a system for the active side of building capital? Grab the free 15-Minute Swing Trading Starter Kit, the exact routine I use to scan once a day and trade any market in 15 minutes.


About the author. Spencer Li is the founder of Synapse Trading and a Certified Financial Technician (CFTe) with 15 years of trading across stocks, forex, crypto, commodities, and bonds. His trade log is public, 404 trades, losses left in. He teaches low-risk swing trading in 15 minutes a day, one system for any market.

Education, not financial advice. Synapse Trading is not licensed by MAS to advise on investment products. Trading carries risk of loss; past performance is not indicative of future results.


Related

Best Investing and Trading Books of All Time (pillar) · The Little Book of Common Sense Investing (Bogle) · Net worth of the average Singaporean · The Intelligent Investor summary

0 Comments/by Spencer Li
https://synapsetrading.com/wp-content/uploads/2023/01/thumbnail-Book-Summary-Capital-in-the-Twenty-First-Century-by-Thomas-Piketty.png 720 1280 Spencer Li https://synapsetrading.com/wp-content/uploads/2019/10/logo.jpg Spencer Li2023-01-05 17:44:032026-07-06 01:03:16Book Summary: Capital in the Twenty-First Century by Thomas Piketty
Spencer Li

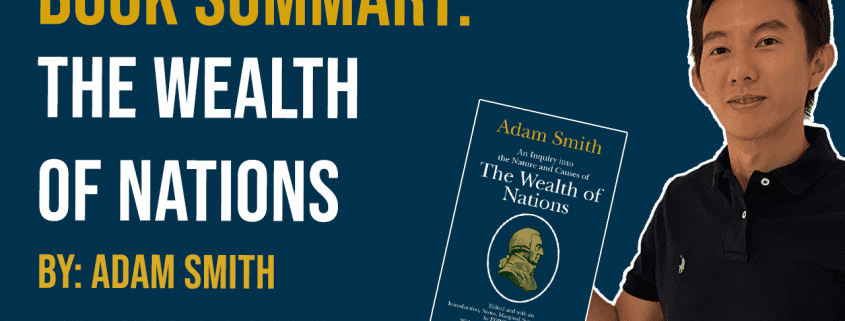
Book Summary: The Wealth of Nations by Adam Smith

Book Summaries
thumbnail Book Summary The Wealth of Nations by Adam Smith

The Wealth of Nations by Adam Smith: Summary, Key Ideas, and What It Teaches Traders

Last updated: 3 July 2026 · By Spencer Li, CFTe


The Wealth of Nations, written by Adam Smith in 1776, is the book that laid the foundation for modern free-market economics, and its core idea is the “invisible hand”: individuals acting in their own self-interest, inside a competitive market, tend to produce outcomes that benefit society as a whole. Smith’s argument is that a free market, where prices are set by supply and demand rather than by government, is the most efficient way to allocate resources. The book’s most quoted ideas are the division of labour (specialisation raises productivity), the price system as a coordination tool, and the case for free trade and competition. For a trader or investor, the practical takeaway is simple: markets are run by self-interested participants reacting to supply, demand, and price, so your edge comes from reading that behaviour, not from arguing with it.

Here is the author, the central ideas, and how I actually apply the book to trading.

Who was Adam Smith?

Adam Smith was a Scottish economist and philosopher, born in 1723, widely regarded as one of the founders of modern economics. Besides The Wealth of Nations, he wrote The Theory of Moral Sentiments, which deals with human sympathy and morality. People forget that Smith was a moral philosopher first and an economist second. That matters, because the “invisible hand” was never an excuse for greed. It was an observation that, under the right conditions, private interest and public good can line up.

What is The Wealth of Nations about?

The book is a broad analysis of how an economy works and what role it plays in society. The central message is the invisible hand (the idea that self-interested individuals, transacting freely, can collectively benefit society without anyone planning it). From there, Smith builds the case for a free-market economy where supply and demand set prices, and where the government’s job is limited rather than central.

Do note that, this is an 18th-century book. The world it describes is simpler than ours. But the mechanics it identifies, specialisation, price signals, competition, capital accumulation, still drive every market you trade today.

The 10 key ideas, and how they apply

Smith’s argument is usually compressed into ten ideas. Here they are next to the practical move each one suggests, so you can see the theory and the application side by side.

#Key idea from the bookWhat it meansHow to apply it
1Division of labourSpecialising on one task raises efficiency and outputSpecialise. Get good at one market or one setup before spreading thin.
2Role of self-interestPeople acting in their own interest can benefit the wholeMake decisions that serve your real goals, not what looks impressive.
3The price systemPrices set by supply and demand allocate resourcesRead price as information. It is the market telling you where demand is.
4Benefits of free tradeFree exchange across borders raises prosperityStay open to opportunities outside your home market.
5Limited role of governmentThe state should supply public goods, not run the marketRecognise that intervention distorts prices. Factor policy risk in, do not assume it.
6Capital drives growthAccumulated capital powers economic growthBuild and reinvest capital. Compounding is the long game.
7Importance of competitionCompetition lowers prices and raises qualityCompete to improve. Assume the other side of your trade is sharp.
8Role of wagesWages are set by the supply and demand for labourUnderstand that your pay, and your edge, is priced by the market too.
9Education and skillsSkills drive individual and collective prosperityInvest in your own learning. It is the highest-return capital you own.
10Market sets pricesPrices come from the market, not an authorityRespect the market’s price. Do not fight the tape because you “know better”.

The thread running through all ten, for a trader, is the price system. Smith’s whole framework says prices are not random and they are not handed down. They are the running output of millions of self-interested decisions. That is exactly what a chart is. Price action is the invisible hand drawn on a screen.

A few more points worth keeping

Beyond the headline ten, Smith makes four observations that still hold up:

  • Entrepreneurship drives growth. Starting and running a business is one of the main engines of an economy.
  • Technological progress raises efficiency and productivity. New tools let the same effort produce more.
  • The financial system (banks and other institutions) matters, because it moves capital to where it is useful.
  • Taxes can drag on the economy by distorting prices and discouraging activity.

Hence, when you read a market, you are not just reading a chart. You are reading the combined effect of entrepreneurs, technology, credit, and policy, all of it expressed back to you as price.

Where the human edge comes in

Smith’s market is a crowd of self-interested participants competing on price. That is also a fair description of every market you trade. An AI can summarise this book in a second, and it can scan a thousand charts for you. What it cannot do is sit in that competitive crowd and supply the judgment, the discipline, and the emotional control to act well when your own self-interest is screaming the wrong thing at you. Smith described the game. Playing it well is still your job, and that is the first of the Five Edges that AI cannot trade for you.

My view: read it for the mental model, not the tactics

Personally, I would not read The Wealth of Nations for a trading edge. It will not give you a setup. What it gives you is a mental model: a clear picture of why prices move, why competition matters, and why specialisation pays. That model is worth more over a career than any single pattern.

I would recommend it to anyone who wants to understand how markets actually work underneath the candles. Just go in knowing it is a foundation, not a playbook.

FAQ

What is the main idea of The Wealth of Nations?
The main idea is the “invisible hand”: individuals acting in their own self-interest, within a free and competitive market, tend to benefit society as a whole. Smith argued that prices set by supply and demand allocate resources more efficiently than government planning.

When was The Wealth of Nations written, and by whom?
It was written by Adam Smith, a Scottish economist and philosopher, and published in 1776. It is widely considered one of the founding works of modern economics and capitalism.

What is the “invisible hand”?
The invisible hand is Smith’s term for the way self-interested individuals, transacting freely in a market, can collectively produce outcomes that benefit society without anyone directing them to. It is the book’s most famous concept.

Is The Wealth of Nations useful for traders and investors?
Indirectly, yes. It will not give you a strategy, but it explains why prices move and why markets are efficient at allocating resources. That mental model helps you read price action as information rather than noise.

What is the difference between The Wealth of Nations and The Theory of Moral Sentiments?
The Wealth of Nations is Smith’s work on economics and markets. The Theory of Moral Sentiments, his earlier book, deals with human sympathy and morality. Together they show Smith saw self-interest and moral behaviour as connected, not opposed.


Now that you have the key learning points, would you add The Wealth of Nations to your reading list? And if you have already read it, what stuck with you? Let me know in the comments.

For more summaries like this, read the roundup: Best Investing and Trading Books of All Time.

Want a system to put the theory to work? Grab the free 15-Minute Swing Trading Starter Kit. It is the exact routine I use to scan once a day and trade any market in 15 minutes.


About the author. Spencer Li is the founder of Synapse Trading and a Certified Financial Technician (CFTe) with 15 years of trading across stocks, forex, crypto, commodities, and bonds. His trade log is public, 404 trades, losses left in. He teaches low-risk swing trading in 15 minutes a day, one system for any market.

Education, not financial advice. Synapse Trading is not licensed by MAS to advise on investment products. Trading carries risk of loss; past performance is not indicative of future results.


Related

Best Investing and Trading Books of All Time (pillar) · The Intelligent Investor summary · Reminiscences of a Stock Operator summary

0 Comments/by Spencer Li
https://synapsetrading.com/wp-content/uploads/2023/01/thumbnail-Book-Summary-The-Wealth-of-Nations-by-Adam-Smith.png 720 1280 Spencer Li https://synapsetrading.com/wp-content/uploads/2019/10/logo.jpg Spencer Li2023-01-05 02:52:232026-07-06 03:23:43Book Summary: The Wealth of Nations by Adam Smith
Spencer Li

Book Summary: Bollinger on Bollinger Bands by John Bollinger

Book Summaries
Thumbnail Bollinger on Bollinger Bands by John Bollinger

Thumbnail Bollinger on Bollinger Bands by John Bollinger

Bollinger on Bollinger Bands is a comprehensive guide to using Bollinger Bands, a popular technical analysis indicator, in trading.

Written by John Bollinger himself, the creator of Bollinger Bands, the book is a must-read for traders of all levels looking to improve their trading skills and increase their profits.

In this blog post, I will share all about this book and the author, key ideas from the book, and how you can apply it to your own trading & investing journey.


About the Author

John Bollinger is a well-known figure in the trading world and the creator of Bollinger Bands, a technical analysis tool used by traders to measure market volatility and identify trends.

Bollinger has over 30 years of experience in the financial markets and has written several books on trading and technical analysis.

He is also the president of Bollinger Capital Management, an investment management firm that provides technical analysis and portfolio management services to institutional and individual clients.

What is the Book About?

The main message of the book is that Bollinger Bands are a powerful tool that can help traders make informed decisions about when to enter and exit trades.

The book covers a wide range of topics related to Bollinger Bands, including how to use them to identify trends, spot potential reversals, and gauge market volatility.

Bollinger also provides guidance on how to effectively combine Bollinger Bands with other technical indicators and fundamental analysis to form a complete trading strategy.

10 Key Ideas from the Book

Here are 10 key ideas from the book:

  1. Bollinger Bands are a technical analysis tool used to measure market volatility and identify trends. They consist of three lines plotted on a chart: a moving average, an upper band, and a lower band. The upper and lower bands are plotted at a standard deviation above and below the moving average, respectively.
  2. Bollinger Bands are useful for identifying overbought and oversold conditions in the market. When the price is trading near the upper band, it may be overbought, and when it is trading near the lower band, it may be oversold.
  3. Bollinger Bands can be used in conjunction with other indicators and techniques to confirm trends and help with decision-making. For example, if the price breaks through the upper or lower band, it may be a sign of a trend reversal, and if it bounces off the band, it may be a sign of a trend continuation.
  4. Bollinger Bands can be customized to fit the specific needs and preferences of the trader. The moving average, standard deviation, and time period can be adjusted to fit the trader’s trading style and market conditions.
  5. Bollinger Bands can be used in all market conditions and time frames, from short-term to long-term, and can be applied to any asset class, including stocks, forex, and commodities.
  6. Bollinger Bands can be used as a standalone tool or as part of a larger trading system. It is important to have a clear trading plan and risk management strategy in place to ensure consistent profits.
  7. Bollinger Bands can be used to identify potential entry and exit points in a trade. By using Bollinger Bands in combination with other technical analysis tools, traders can look for opportunities to enter a trade when the price is near the lower band or exit a trade when the price is near the upper band. For example, if the price is trending upwards and bounces off the lower band, a trader may look for a buying opportunity, and if the price is trending downwards and breaks through the upper band, a trader may look for a selling opportunity.
  8. Bollinger Bands can be used to identify trends and trend reversals in the market. When the price is trending upwards, the bands will often expand, and when the price is trending downwards, the bands will often contract. If the price breaks through the upper or lower band, it may be a sign of a trend reversal, and if it bounces off the band, it may be a sign of a trend continuation.
  9. Bollinger Bands can be used to help traders manage their risk. By setting stop loss orders at the upper or lower band, traders can limit their potential losses in the event of a sudden market move.
  10. Bollinger Bands can be used to help traders identify potential areas of support and resistance in the market. When the price is trending upwards and hits the upper band, it may act as a resistance level, and when the price is trending downwards and hits the lower band, it may act as a support level.

10 Ways to Apply the Teachings

Actionable Ways to Apply What is Taught in the Book:

  1. Use Bollinger Bands as a key tool in your trading strategy to help identify overbought and oversold conditions in the market.
  2. Customize Bollinger Bands to fit your specific needs and preferences by adjusting the moving average, standard deviation, and time period.
  3. Use Bollinger Bands to identify potential entry and exit points in a trade by looking for opportunities to enter when the price is near the lower band or exit when the price is near the upper band.
  4. Use Bollinger Bands to help identify trends and trend reversals in the market by looking for expansions and contractions in the bands and breaks or bounces off the upper or lower band.
  5. Use Bollinger Bands to help manage risk by setting stop loss orders at the upper or lower band.
  6. Use Bollinger Bands to help identify potential areas of support and resistance in the market by looking for the price to hit the upper or lower band.
  7. Use Bollinger Bands to help improve your trading discipline by following a clear trading plan and risk management strategy.
  8. Use Bollinger Bands to help improve your market analysis skills by studying how the bands react to different market conditions and events.
  9. Use Bollinger Bands to help improve your decision-making skills by using them in conjunction with other technical analysis tools and techniques.
  10. Use Bollinger Bands to help improve your trading performance by consistently applying what you have learned from the book and regularly reviewing and adjusting your trading strategy.

Other Important Points from the Book

Other Points to Consider:

  • Bollinger Bands are a technical analysis tool and should not be used as a standalone indicator. It is important to use them in conjunction with other technical analysis tools and techniques to confirm trends and help with decision-making.
  • Bollinger Bands are based on historical data and do not predict future market movements. It is important to use them as a guide and not a guarantee of future performance.
  • Bollinger Bands are affected by market volatility, and the bands may expand or contract depending on the level of volatility. It is important to consider this when using Bollinger Bands to identify trends and potential entry and exit points in a trade.
  • It is important to regularly review and adjust your trading strategy and Bollinger Bands settings to fit changing market conditions and your own trading style.
  • It is important to have a clear trading plan and risk management strategy in place to ensure consistent profits and protect against potential losses.

Practical Application & Tips

I have found Bollinger on Bollinger Bands to be an extremely useful and valuable resource in my personal trading.

As a full-time trader, I am always looking for ways to improve my trading skills and increase my profits.

Bollinger on Bollinger Bands has helped me do this by providing a clear and simple approach to using Bollinger Bands as a key tool in my trading strategy.

By following the book’s guidance on customizing the bands to fit my specific needs and preferences, as well as using them in conjunction with other technical analysis tools and techniques, I have been able to consistently identify overbought and oversold conditions in the market and enter and exit trades at favorable times.

In addition, the book’s emphasis on treating trading as a business and having a clear trading plan and risk management strategy in place has been invaluable in helping me approach trading in a professional and disciplined manner.

By following these principles, I have been able to consistently generate profits and protect against potential losses.

One practical example of how Bollinger on Bollinger Bands has helped me in my personal trading is a trade I made in the EUR/USD currency pair.

I was looking for a buying opportunity and noticed that the price was trending upwards and had bounced off the lower band, indicating a potential trend continuation.

I also used other technical analysis tools to confirm the trend and set a stop loss order at the upper band to limit my potential losses.

The trade ended up being a success, and I was able to generate a profit thanks to the application of its principles.

Concluding Thoughts

In conclusion, Bollinger on Bollinger Bands is a comprehensive and valuable resource for traders of all levels looking to improve their trading skills and increase their profits.

The book’s clear and simple approach to using Bollinger Bands as a key tool in a trading strategy, as well as its emphasis on market psychology and a multi-faceted approach to trading, make it a must-read for anyone looking to take their trading to the next level.

I would highly recommend this book to both beginner and experienced traders who are looking to improve their trading skills and results.

Now that I have covered all the key learning points of this book, would you consider adding it to your reading list?

For those who have already read it, what are some of your key learning points?

Let me know in the comments below.


best books on trading and investing

If you would like to find more book summaries and recommendations, also check out: “Best Investing & Trading Books of All Time”
0 Comments/by Spencer Li
https://synapsetrading.com/wp-content/uploads/2023/01/Thumbnail-Bollinger-on-Bollinger-Bands-by-John-Bollinger.png 720 1280 Spencer Li https://synapsetrading.com/wp-content/uploads/2019/10/logo.jpg Spencer Li2023-01-03 02:52:482023-01-09 01:29:52Book Summary: Bollinger on Bollinger Bands by John Bollinger
Spencer Li

Inverted Hammer Candlestick Pattern Trading Strategy Guide

Technical Analysis & Price Action
Thumbnail Inverted Hammer Candlestick Pattern Trading Strategy Guide

Thumbnail Inverted Hammer Candlestick Pattern Trading Strategy Guide

The Inverted Hammer Candlestick Pattern is a powerful tool for traders looking to identify trend reversals and potential buying opportunities.

But what is the Inverted Hammer Candlestick Pattern, and how can it be used to make profitable trades?

In this blog post, I’m going to teach you all about this candlestick pattern, how to identify it, the strategies to trade it, and some practical applications of this pattern.


How to Identify the Inverted Hammer

First, let’s take a look at how to identify the Inverted Hammer Candlestick Pattern.

This pattern is formed when the following conditions are met:

  • The market is in a downtrend
  • The candlestick has a small body, typically white in color
  • The candlestick has a long upper shadow
  • The lower shadow is small or absent

In other words, the Inverted Hammer Candlestick Pattern looks like a small white candle with a long tail pointing upwards.

This pattern indicates that, while the market was initially moving downwards, buyers were able to push prices up towards the end of the trading period.

Psychology of the Pattern

The psychology behind the Inverted Hammer Candlestick Pattern is one of potential bullish reversal.

While the market was previously moving downwards, the presence of buyers able to push prices upwards suggests that the downtrend may be coming to an end.

This can be a good opportunity for traders to enter the market and potentially profit from a potential uptrend.

How to Use it to Trade

So, how can the Inverted Hammer Candlestick Pattern be used to trade?

One strategy is to look for this pattern at key support levels.

If the market is approaching a key support level and an Inverted Hammer Candlestick Pattern appears, this may be a good opportunity to enter the market and buy.

Stop loss orders can be placed below the low of the Inverted Hammer Candlestick, while profit can be taken at resistance levels or using a trailing stop.

Where to Enter a Trade

When using the Inverted Hammer Candlestick Pattern as a potential bullish reversal signal, traders can enter the market by placing a buy order at the open of the next candlestick.

This allows traders to take a position in the market as soon as possible after the pattern appears.

Where to Place the Stoploss

Stop loss orders can be placed below the low of the Inverted Hammer Candlestick.

This allows traders to limit their potential losses in case the market does not move in their favor.

Where to Take Profit on the Trade

Profit can be taken at resistance levels or using a trailing stop.

By taking profit at a resistance level, traders can capitalize on the potential uptrend.

Alternatively, a trailing stop can be used to lock in profits as the market moves in the trader’s favor.

How to Combine with Trendlines

The Inverted Hammer Candlestick Pattern can also be combined with trendlines to identify potential trend reversals.

By drawing a trendline through the lows of the candlesticks, traders can identify a potential uptrend if the Inverted Hammer Candlestick appears near the trendline.

This can be a good opportunity to enter the market and potentially profit from an uptrend.

How to Combine with Support and Resistance Levels

Support and resistance levels can also be useful in conjunction with the Inverted Hammer Candlestick Pattern.

If the market is approaching a key support level and an Inverted Hammer Candlestick appears, this may be a good opportunity to enter the market and buy.

Stop loss orders can be placed below the low of the Inverted Hammer Candlestick, while profit can be taken at resistance levels or using a trailing stop.

How to Combine with Price Patterns

The Inverted Hammer Candlestick Pattern can also be combined with other price patterns to increase the reliability of trade signals.

For example, if the Inverted Hammer Candlestick appears in conjunction with a Double Bottom pattern, this may be a particularly strong signal for a potential trend reversal.

How to Combine it with Price Action

Price action analysis is the study of the movement of a security’s price over a given period of time.

When combined with the Inverted Hammer Candlestick Pattern, price action analysis can help traders identify potential bullish reversal signals and make informed trading decisions.

To combine the Inverted Hammer Candlestick Pattern with price action analysis, traders can look for other bullish reversal patterns in conjunction with the Inverted Hammer.

For example, if the market is in a downtrend and an Inverted Hammer Candlestick appears, traders can look for other bullish reversal patterns, such as Bullish Engulfing Patterns or Hammer Patterns, to confirm the potential trend reversal.

How to Combine it with Trend-following Indicators

Trend-following technical indicators such as moving averages, MACD, and ADX can also be useful in combination with the Inverted Hammer Candlestick Pattern.

By using these indicators to confirm a potential trend reversal, traders can increase the reliability of their trade signals.

How to Combine with Oscillators

When the RSI is combined with the Inverted Hammer Candlestick Pattern, traders can look for bullish reversal signals in oversold markets.

For example, if the market is in an downtrend and the RSI is below 30, the appearance of an Inverted Hammer Candlestick Pattern may be a good opportunity to buy.

Similarly, the Stochastics indicator is a momentum oscillator that measures the location of a security’s price relative to its price range over a set period of time.

Like the RSI, the Stochastics indicator can be useful in identifying overbought and oversold conditions.

When combined with the Inverted Hammer Candlestick Pattern, traders can look for bullish reversal signals in oversold markets.

Limitations of Inverted Hammer Pattern

It’s important to keep in mind that the Inverted Hammer Candlestick Pattern is not a perfect trading tool and should not be relied upon exclusively.

It’s always important to use a range of indicators and techniques to increase the reliability of trade signals and to minimize risk.

The pattern may also be less reliable in volatile or low volume markets, as these conditions may create false signals.

Practical Applications & Tips

As a professional trader, I have a strong understanding of how to trade effectively and consistently.

This knowledge has helped me to level the playing field against other retail traders, and has given me an edge in the market.

My former experience in fund trading has also given me valuable insights into how professionals trade differently, and I have been able to apply this knowledge to my personal trading.

Finally, I make use of the principle of confluence in my trading, looking for alignment between different approaches and techniques.

I use a multi-faceted approach that combines different indicators and techniques, such as trendlines, support and resistance levels, and oscillator indicators.

This approach helps me to make the most informed trades possible, and has helped me to consistently grow my trading account.

Concluding Thoughts

In conclusion, the Inverted Hammer Candlestick Pattern is a valuable tool for traders looking to identify trend reversals and potential buying opportunities.

By combining this pattern with other techniques and indicators, traders can increase the reliability of their trade signals and maximize their chances of making profitable trades.

While the Inverted Hammer Candlestick Pattern is not a perfect trading tool, it can be a valuable addition to any trader’s toolkit.

Now that I have covered all about this candlestick pattern, is it something that you will add to your trading toolbox?

Let me know in the comments below.


ed seykota

If you would like to learn more about all the different candlestick patterns, also check out: “The Definitive Guide to Candlestick Patterns”

0 Comments/by Spencer Li
https://synapsetrading.com/wp-content/uploads/2023/01/Thumbnail-Inverted-Hammer-Candlestick-Pattern-Trading-Strategy-Guide.png 720 1280 Spencer Li https://synapsetrading.com/wp-content/uploads/2019/10/logo.jpg Spencer Li2023-01-01 16:02:412023-01-10 01:42:51Inverted Hammer Candlestick Pattern Trading Strategy Guide
Spencer Li

Weekly Market Wrap: Review of 2022 & Outlook for 2023

Market Analysis
Kolsay Lakes National Park Kazakhstan

Looking back, 2022 has been challenging for the stock market and many analysts do not have high expectations for 2023.

There is a growing consensus among analysts that there will be a selloff in the first half of next year due to negative estimates for future performance.

However, some believe that the next year could present a good opportunity to buy before the Federal Reserve (Fed) potentially needs to lower interest rates in 2024 in order to support the economy during a recession.

To protect from downside risk, the more prudent approach is to hedge by investing in inflation-related themes, or by using fixed income products such as T-bonds or T-bills.

When the yields start turning down, it would be an early indicator to rotate back into the stock market, in time for the next major bull market.

To kickstart your 2023 trading & investing journey, join our “Daily Trading Signals” Telegram channel!


Kolsay Lakes National Park Kazakhstan

[Photo: Kolsay Lakes National Park, Kazakhstan – See my full travel photo log!]

For our weekly market wrap, we go through some of the trade calls and analysis from last week, which gives us valuable insights for the week ahead.

We cover 3 main markets with a total of 200+ counters, so we will never run out of trading opportunities:

  • Forex, CFDs, commodities, bonds
  • US stocks, ETFs, global stock indices
  • Cryptocurrencies, crypto indices

By covering a broad range of markets, we can focus our attention (and capital) on whichever market currently gives the best returns.

Click here to receive all these signals in real-time for only $67 a month! You will get several signals a day, and even taking just 1 trade the whole month can easily cover the fee, so what are you waiting for?


Special Report: Review of 2022 & Outlook for 2023

The global stock market has seen a significant decrease due to high levels of inflation and aggressive actions taken by central banks, particularly the U.S. Federal Reserve, to increase interest rates.

While the energy sector has performed well, some companies that benefited from the pandemic, like DocuSign, Roku, and Peloton, have struggled. The NASDAQ Composite index, which is heavily focused on technology, has dropped by about 33% this year.

The Fed has raised interest rates by 4.25% this year and Chair Jerome Powell has indicated that more work needs to be done to reduce inflation.

Goldman Sachs analysts predict that the Fed will further increase the benchmark interest rate to between 5.0-5.2%. Goldman strategists have also stated that they do not expect the Fed to lower the interest rate until the economy is at risk of entering a recession, which they do not expect to occur next year.

Even well-known companies like Meta Platforms, Tesla, and Amazon have seen significant declines in their stock prices this year, with declines of 65%, 65%, and 50% respectively.

While the decrease in the S&P 500 index this year has primarily been due to inflation and actions taken by central banks, analysts believe that negative estimates for future performance will contribute to further declines.

Currently, the consensus among analysts is that the S&P 500 will earn around $216 in 2023, but some more optimistic analysts predict earnings of around $220, representing only slight growth compared to 2022.

On the other hand, a group of bearish analysts believe that earnings per share (EPS) will decrease by about 10% to $200. Morgan Stanley and Bank of America have been particularly bearish, stating that the bear market in stocks will not end until the S&P 500 reaches a range of 3000-3400 later this year.

The current average price target for the S&P 500 for 2023, based on forecasts from 23 analysts, is 4,080.


Weekly Market Outlook Video

Trading Signals Weekly market outlook 251222

Weekly Market Outlook (25 December 2022)

Market is likely to be quiet this week due to Christmas and New Year holidays.

Watch out for any Santa Rally (last 5 days of the year and first 2 days of the new year), which might give a good shorting opportunity in the stock market.


Portfolio Highlights

Trading Signals Weekly portfolio updates 251222

Weekly Portfolio Updates (25 December 2022)

Added more short positions for stocks and REITs, and will continue adding more on any pullbacks.


Forex & Commodities Market Highlights

Trading Signals EURAUD 281222

EURAUD – Watch to see if some consolidation zone forms here, followed by bullish price action.


Trading Signals USDCNY 301222

USDCNY – With China opening up, the Yuan is strengthening, and this pair looks like it will be heading lower after breaking out from the bear flag/pennant pattern.


Trading Signals USDSGD 301222

USDSGD – Looks like this is going to continue heading down to test the major support level, which is the bottom of the wide range.


Trading Signals CADJPY 301222 1

CADJPY – And the downtrend continues, congrats to those who are also holding short positions! 💰🔥💪🏻


Stock & Bond Market Highlights

Trading Signals US100 301222

US100 (NASDAQ 100) – After dropping about 12% from the recent swing highs, it is now testing major support.

Currently, there is a good chance it will test previous lows and even break new lows.

If it manages to make a U-turn and break above the previous swing high of aounrd 12400, then there is a good chance of a market reversal.


Trading Signals inflation news 271222

https://www.wsj.com/articles/wall-street-and-fed-flopped-in-trying-to-predict-2022-11672050603


Click here to receive all these signals in real-time for only $67 a month! You will get several signals a day, and even taking just 1 trade the whole month can easily cover the fee, so what are you waiting for?

Good luck, and may next week bring more excellent profits!

0 Comments/by Spencer Li
https://synapsetrading.com/wp-content/uploads/2022/12/Kolsay-Lakes-National-Park-Kazakhstan.jpg 1536 2048 Spencer Li https://synapsetrading.com/wp-content/uploads/2019/10/logo.jpg Spencer Li2022-12-30 02:12:452023-01-01 03:40:49Weekly Market Wrap: Review of 2022 & Outlook for 2023
Page 51 of 184«‹4950515253›»

Free Trading Guides

Free Trading Guides

Blog Categories

  • Beginner's Guide
  • Blockchain & Crypto
  • Book Summaries
  • Economics & News Trading
  • Investing & Portfolio Management
  • Living Your Best Life
  • Market Analysis
  • Markets & Products
  • News & Events
  • Promotions
  • Risk & Money Management
  • Stock Trading
  • Technical Analysis & Price Action
  • Testimonials
  • Tools & Resources
  • Trading Psychology
  • Trading Strategies
  • Trading Tips
  • Travel & Lifestyle

Free Trading Guides

Free Trading Guides

Contact Us

Synapse Trading Pte Ltd
Registration No. 201316168H

Whatsapp: +65-8897-1204
Telegram: @iamrecneps
Email: info@synapsetrading.com

Links

Disclaimer
Privacy policy
Terms & Conditions
Contact us
Partnerships

© 2012-2024 Synapse Trading | All rights reserved | - powered by Enfold WordPress Theme
  • Link to Facebook
  • Link to X
  • Link to Instagram
  • Link to Youtube
  • Link to LinkedIn
  • Link to Mail
Scroll to top Scroll to top Scroll to top