

The Intelligent Asset Allocator Summary: William Bernstein on Knowing Your Risk Before You Buy
Want the daily routine? Get the free 15-Minute Swing Trader’s Checklist. Get it free →
By Spencer Li, CFTe · Last updated: 26 October 2026
The Intelligent Asset Allocator is William Bernstein’s guide to building a portfolio in the right order. Learn how risk and return are linked, see why a mix of assets behaves differently from any one of them, decide how much risk you can actually stand, and only then buy something. The big ideas fit on a postcard. You are paid for bearing risk, the average return flatters while the annualized return is the one you live on, and the risk that matters most is running out of money.
Every figure below is Bernstein’s own and carries its date, because the book’s data stops in 1998.
What is the road map Bernstein hands you first?
Bernstein opens with a traveller dropped into a strange country and handed the keys to a good car. Some drive off and hope. Others trust one of the sleazy locals offering expert help. His advice is to buy a road map first, and he says most investors are in exactly that traveller’s shoes.
His map has six steps. Do nothing for weeks or months while you learn. Learn how risk and reward are linked, then the risk and reward of each type of investment. Accept that a diversified portfolio behaves differently from its parts, “in much the same way that a cake tastes different from shortening, flour, butter, and sugar.” Estimate how much risk you can tolerate and build for it. Only then buy, which he calls “by far the easiest step.”
“This is not a Grisham novel,” he warns, and he asks for about an hour a day, in order. His site still hosts the foreword and first two chapters, marked copyright 1999, and they are the source for every quote here.
What is Uncle Fred’s coin toss?
Imagine your rich and eccentric Uncle Fred puts $5,000 a year into a pension for you for 35 years, and you must pick one investment for the whole stretch. Option one is a deposit paying a fixed 3% a year. Option two is a yearly coin toss: heads, your money earns 30%, and tails, it loses 10%.
The deposit is certain. It grows to $302,310, which sounds fine until you allow for 3% inflation and find it buys about $107,436 of today’s goods. The coin toss feels reckless, yet one head and one tail turn every dollar into 1.3 times 0.9, or $1.17, which is 8.17% a year. You would need 12 heads against 23 tails before it did worse than the deposit, and Bernstein puts the odds of that at under 5%. If every toss came up heads, he notes, you would bankrupt poor Uncle Fred with a bill for $162,000,000.
He built the game to behave like stocks, which returned 11.22% a year from 1926 to 1998 with swings almost exactly the size of the coin’s. From that he draws “one of the fundamental laws of investing: in the long run you are compensated for bearing risk.” Seek safety and your returns will be low. And a promise of big returns with little risk is, he says, one of the most reliable signs of fraud.
Why does a 10% average only grow your money at 8.17%?
A stock that doubles in year one and halves in year two has an average return of 25%, and you have made exactly nothing. Bernstein uses it to split two numbers that fund brochures blur together. The average return is the plain average of each year’s result, and the annualized return is the steady yearly rate that leaves you with the same money at the end.
The coin toss averages 10%, yet your account grows at 8.17%. Bernstein’s line for this is the most useful sentence in Chapter 1: “You pay your bills with annualized return, not average return.”
Statistics explains the size of the gap. A handy rule of thumb says compound growth is roughly the average return minus half the square of the standard deviation. The coin toss averages 10% with a standard deviation of 20%, so the rule gives 10% minus 2%, close to the true 8.17%. Because the drag grows with the square of the swings, doubling the volatility roughly quadruples its cost, which is the hidden price of an exciting fund.
If you trade as well as invest, my free 15-minute swing trader checklist is the daily routine I run.
How does Bernstein measure risk?
What should you ask anyone who tries to sell you an investment? Bernstein’s answer is one number, the standard deviation of annual returns, which measures how widely the yearly results scatter. About two thirds of years land within one standard deviation of the average.
His typical ranges run from 2% to 3% for cash, through 10% to 14% for conservative domestic stocks, up to 25% to 35% for emerging markets. A Latin American stock fund expected to return 15% with a standard deviation of 35% should lose 20% or worse about once every 6 years, and lose more than 55% about once every 44 years.
His advice on the salesman is blunt: “If he or she doesn’t know, don’t even think about buying it.” He admits the measure counts upside surprises as risk too, and still prefers it, noting that plain monthly volatility would have flagged Long Term Capital Management “years before the ottoman hit the fan.” For why big swings and real losses differ, see my guide to risk vs volatility.
What did 73 years of US markets pay for risk?
T-bills are, in Bernstein’s words, “the safest investment on earth,” and from 1926 to 1998 they returned 3.77% a year against inflation of 3.08%. Safety barely kept your money’s value. His Chapter 2 table sets the five main US assets side by side.
| Asset, 1926–98 | Annualized return | Standard deviation | Worst single year | 1929–32 |
|---|---|---|---|---|
| 1-month T-bills | 3.77% | 3.22% | 0.00% | +9.5% |
| 5-year Treasury notes | 5.31% | 5.71% | −2.65% | +20.2% |
| 20-year Treasury bonds | 5.34% | 9.21% | −9.8% | +19.8% |
| Large company stocks | 11.22% | 20.26% | −43.3% | −64.2% |
| Small company stocks | 12.18% | 38.09% | −58.0% | −85.7% |
Higher returns came with bigger swings, almost in a straight line. The odd one out is the 20-year bond, which paid about the same as the 5-year note while swinging much harder.
Bernstein adds a lovely story from the summer of 1929. A General Motors financier, John J. Raskob, told Ladies’ Home Journal that $15 a month in good stocks would become $80,000 in 20 years, and that anyone “ought to be rich.” That needs over 25% a year, and the crash made him a byword for bubble talk. Yet Bernstein works out that $15 a month in stocks from 1926 to the end of 1994 would have reached $2,462,295, before taxes and costs. Raskob was wrong about the speed and right about the direction.
Do stocks get safer the longer you hold them?
The odds improve, at least. Assuming stocks return 10% with a standard deviation of 20% and T-bills pay 3%, Bernstein finds stocks trail T-bills in 36% of single years, 13% of ten-year spans and only 1% of forty-year spans.
Then he warns against the easy conclusion that “stocks grow less risky with time,” which he calls “not quite true.” The best and worst 30-year periods since 1926 differ by almost 5% a year, which compounds into an almost four-fold gap in end wealth. The odds of trailing T-bills shrink while the range of outcomes widens. His conclusion is the line I would underline in the whole book: “Probably the most relevant definition of risk is the likelihood of running out of money.”
For the trading side of your money, the free 15-minute swing trader checklist is the short routine I follow each day.
Why does a portfolio behave differently from its parts?
Gold and silver mining stocks look like a terrible deal in Bernstein’s data. He puts their real long-term return at a few percent a year, with yearly swings of about 30%. So why would anyone sensible own them?
His answer is the heart of the book. Part of an asset’s risk, the “nonsystematic” part, disappears inside a properly built portfolio, and the same idea explains the long bond. Then comes a line that sounds backwards until you see the maths: “there are often times when the addition of a small amount of a very risky asset to your portfolio will actually lessen its volatility.” The asset’s own swings matter less than how they line up with everything else you hold.
The posted chapters stop there, and the full method for picking a mix is in Chapters 3 to 5.
How does this show up in my own accounts?
I keep a long-term portfolio and a trading account, and they run on different rules. The trading account takes swing trades with stops, and the long-term portfolio is where Bernstein’s way of thinking lives.
Gold shows the two side by side. In my weekly outlook on 30 October 2025, I had gold trades on with a worst case of getting stopped out, “but for my long term portfolio I’m just gonna continue buying … as it goes further down.” On 5 February 2026, I had “only bought some for my long term portfolio” and would “slowly accumulate it back … if it continues to go lower,” while for trading the bounce “was kind of too fast.” Same metal, two different jobs.
The portfolio idea reaches the trading side too. On 5 November 2025, with the market falling, I told viewers I had “tried to diversify by buying the counters which are not so tech,” so one sector’s fall would not hit every position. That is Bernstein’s point in miniature.
For the long-term side, my guide to splitting money between stocks and bonds is a good next step, and portfolio rebalancing covers keeping the mix on target.
What did Bernstein expect from stocks in 1999?
How do you forecast stock returns without just copying the past? Bernstein adds dividend yield, growth and any change in valuation. From 1926 that gave about 4.5% plus 5% plus 1.5%, or 11%, close to the actual 11.22%.
Writing in 1999, he ran the sum again with a 1.3% yield, 5% growth and no further rise in valuations. That gave stocks about 6.3% a year against a 6.0% coupon on long Treasury bonds, and he concluded that “the current optimism surrounding stock investing does not appear to be well founded.”
His worked example for planning is half stocks, split between large and small, and half short bonds. By his 1999 estimates it should lose about 25% in a once-in-a-lifetime bear market and grow about 4% a year after inflation, doubling its real value in about 18 years.
A trader on Reddit’s r/Bogleheads, writing on 15 October 2025 after reading the book, noted that valuation models “are fairly similar to what they were in 1999/2000.” The obvious objection is that a book written near the top of the 1990s boom is a museum piece. On the dates, the critic is right: every number here ends in 1998 or 1999, and none of it belongs in your plan without fresh data. The method is what lasts.
If part of your money trades rather than sits, the free 15-minute swing trader checklist is the daily routine I use.
Who should read The Intelligent Asset Allocator?
Bernstein writes that newcomers drawn in by a bull market “invariably lack a proper appreciation of the risks,” and after the losses they sell, “usually when prices are the lowest.” He offers John Maynard Keynes as the remedy: “I do not feel that selling at very low prices is a remedy for having failed to sell at high ones.”
So the book suits an investor who wants to understand why a portfolio works before choosing what goes in it. A feel for numbers helps but is not essential, he says, and the heavier maths sits in small print you can skip. It belongs beside the other titles on my list of the best investing and trading books.
FAQ
What is the main idea of The Intelligent Asset Allocator?
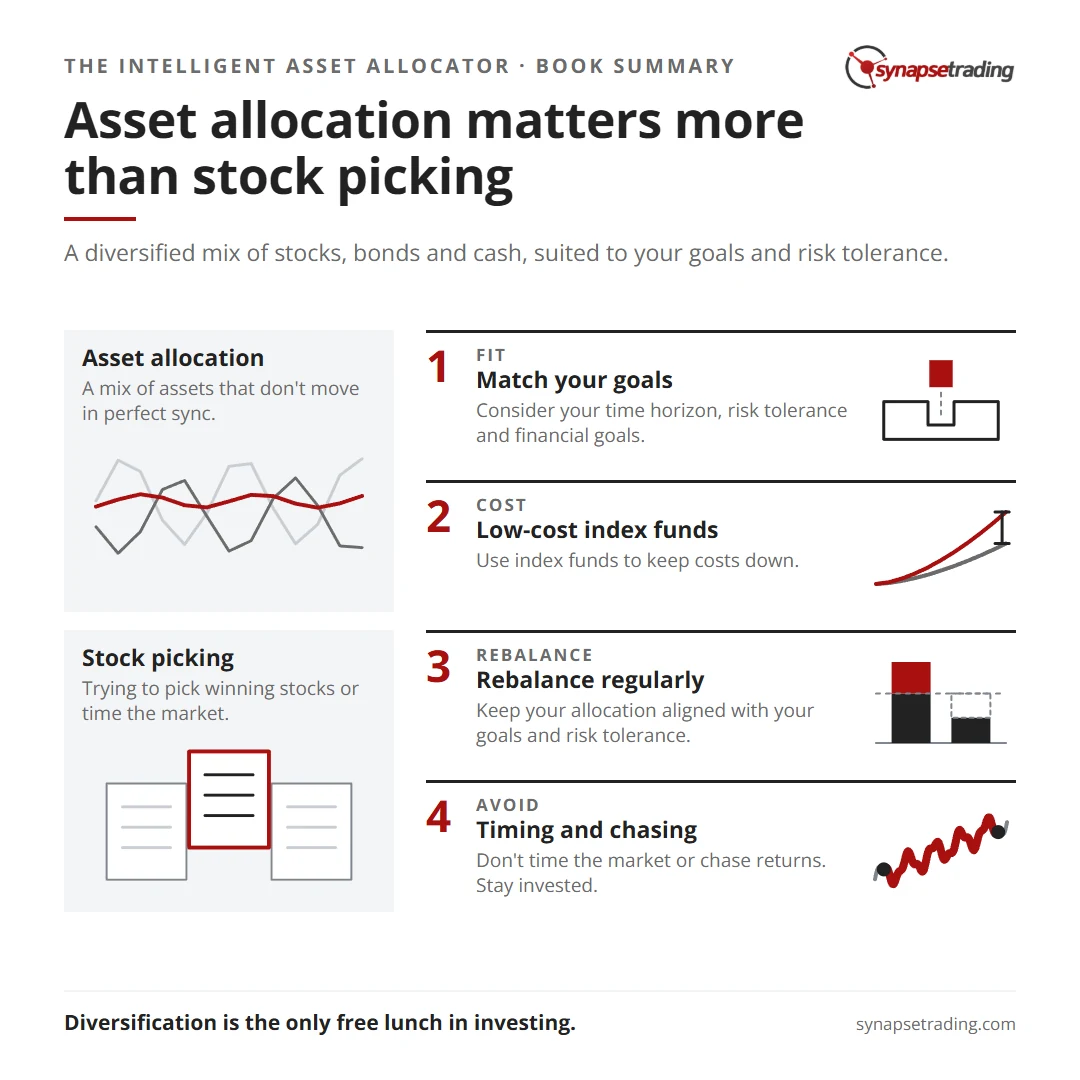
In the long run you are paid for bearing risk, and a portfolio behaves differently from the assets in it. Bernstein asks you to measure risk, decide how much you can stand and only then buy.
What is Uncle Fred’s coin toss?
Bernstein’s thought experiment from Chapter 1. Each year a coin decides whether your money gains 30% or loses 10%. It averages 10% but compounds at 8.17% a year, and over 35 years it trails a fixed 3% deposit in under 5% of cases.
Why is the annualized return lower than the average return?
A 50% fall needs a 100% gain to recover, so losses cost more than equal gains repay. When returns swing, the steady yearly rate always sits below the simple average.
How does Bernstein define risk?
He measures it with the standard deviation of annual returns. He also argues that the most relevant definition is the chance of running out of money.
Are the book’s numbers still current?
No. The return tables cover 1926 to 1998 and 1970 to 1998, and his stock forecast dates from 1999. Use the method with today’s data.
Is it a good book for beginners?
It suits a patient beginner who reads it in order, about an hour a day, as Bernstein asks.
What is the biggest loss you could sit through in your long-term portfolio without selling, and have you ever tested that number for real? Tell me in the comments.
For more on markets and money, browse my free trading guides.
And if you want a simple daily routine for the trading side of your money, grab the free 15-minute swing trader checklist.
About the author. Spencer Li is The 15-Minute Trader and the founder of Synapse Trading. He is a Certified Financial Technician (CFTe) with 15+ years of trading, run from 70+ countries. He holds a B.Acc and B.BM from SMU. Every trade he takes is public, dated, losses left in. He teaches rules-based swing trading in 15 minutes a day, one system for any market.
Education, not financial advice. Synapse Trading is not licensed by MAS to advise on investment products. Trading carries risk of loss, and past performance is not indicative of future results.
Want the daily routine? Enter your email for the free 15-Minute Swing Trader's Checklist.
Free 5-page PDF, then occasional trading emails. Education only, not financial advice. Unsubscribe anytime. Kit stores your email in the US: see our privacy policy.
Want to learn the full method? The Trading Mastery Program teaches the 4 strategies I have traded since 2011. It suits beginners and experienced traders.
Rather follow the trades as they happen? Daily Trading Signals is our Telegram channel: my trade ideas with entry, stop and exit, and every trade is public.
Questions about this post? Ask in the free Telegram channel →
Educational content only, not personalised financial advice. Trading carries risk, including loss of capital. Past performance is not indicative of future results. Synapse Trading is not licensed or regulated by MAS.

