thumbnail Book Summary The Wealth of Nations by Adam Smith

thumbnail Book Summary The Wealth of Nations by Adam Smith

The Wealth of Nations is a landmark work in economics that has had a lasting impact on the field and on society as a whole.

Written by Adam Smith, this book is considered to be one of the foundations of modern capitalism and free market economics.

In this blog post, I will share all about this book and the author, key ideas from the book, and how you can apply it to your own trading & investing journey.


About the Author

Adam Smith was a Scottish economist, philosopher, and author who is best known for his contributions to the field of economics.

He was born in 1723 and is considered to be one of the pioneers of the discipline. In addition to The Wealth of Nations, Smith also wrote several other influential works such as The Theory of Moral Sentiments.

What is the Book About?

The Wealth of Nations is a comprehensive analysis of the economic system and its role in society.

The main message of the book is the idea of the “invisible hand,” which refers to the idea that individuals acting in their own self-interest can lead to the overall benefit of society.

Smith argued that a free market economy, in which prices are determined by supply and demand rather than government intervention, is the most efficient and fair system.

10 Key Ideas from the Book

Here are 10 key ideas from The Wealth of Nations:

  1. The division of labor leads to increased productivity: Smith argued that the specialization of labor, in which individuals focus on a specific task, leads to increased efficiency and productivity.
  2. The role of self-interest in the economy: Smith believed that individuals acting in their own self-interest, rather than being guided by the common good, can lead to the overall benefit of society.
  3. The importance of the price system: Smith argued that prices, determined by supply and demand, are an effective way to allocate resources and coordinate economic activity.
  4. The benefits of free trade: Smith believed that free trade, in which goods and services are exchanged freely across borders, leads to increased efficiency and prosperity.
  5. The role of the government in the economy: Smith argued that the government’s role in the economy should be limited to providing certain public goods, such as defense and the rule of law, and not interfering in the market.
  6. The role of capital in economic growth: Smith believed that the accumulation of capital, or wealth, is a key driver of economic growth.
  7. The importance of competition: Smith argued that competition, in which firms compete for customers, leads to lower prices and improved quality.
  8. The role of wages in the economy: Smith believed that wages, or the compensation received by workers, are determined by the market and are influenced by the supply and demand for labor.
  9. The importance of education and skills: Smith argued that education and skills are important for individual success and for the overall prosperity of society.
  10. The role of the market in determining prices: Smith believed that prices are determined by the market, rather than being set by the government or any other authority.

10 Ways to Apply the Teachings

Here are 10 actionable ways to apply what is taught in The Wealth of Nations:

  1. Specialize in a specific area: Focus on a specific task or industry to increase efficiency and productivity.
  2. Act in your own self-interest: Consider your own goals and objectives when making decisions, as it can lead to the overall benefit of society.
  3. Use the price system to make decisions: Consider supply and demand when making economic decisions, such as purchasing goods or selling services.
  4. Support free trade: Consider the benefits of exchanging goods and services freely with other countries.
  5. Limit the government’s role in the economy: Support a system in which the government’s role is limited to providing certain public goods, rather than interfering in the market.
  6. Invest in capital: Consider ways to accumulate wealth and drive economic growth, such as investing in businesses or saving for the future.
  7. Encourage competition: Support a system in which firms compete for customers, which can lead to lower prices and improved quality.
  8. Invest in education and skills: Consider the importance of education and skills for individual success and the overall prosperity of society.
  9. Understand the role of wages in the economy: Recognize that wages are determined by the market and consider the supply and demand for labor when making decisions about compensation.
  10. Use the market to determine prices: Consider the market when setting prices for goods and services, rather than relying on the government or any other authority.

Other Important Points from the Book

Other points to consider from The Wealth of Nations include:

  1. The role of entrepreneurship: Smith believed that entrepreneurship, or the act of starting and running a business, is an important driver of economic growth.
  2. The impact of technological progress: Smith argued that technological progress, or the development of new technologies, leads to increased efficiency and productivity.
  3. The importance of the financial system: Smith believed that the financial system, including banks and other financial institutions, plays a key role in the economy by facilitating the flow of capital.
  4. The impact of taxes on the economy: Smith argued that taxes can have a negative impact on the economy by distorting prices and hindering economic activity.

Concluding Thoughts

In conclusion, The Wealth of Nations is a groundbreaking work that has had a lasting impact on economics and society.

Its ideas about the role of the free market, self-interest, and the division of labor are still relevant today and have shaped the economic systems of many countries.

I would recommend this book to anyone interested in economics and the role of the economy in society, as it provides valuable insights and a foundation for understanding modern capitalism.

Now that I have covered all the key learning points of this book, would you consider adding it to your reading list?

For those who have already read it, what are some of your key learning points?

Let me know in the comments below!


best books on trading and investing

If you would like to find more book summaries and recommendations, also check out: “Best Investing & Trading Books of All Time”

Thumbnail Bollinger on Bollinger Bands by John Bollinger

Thumbnail Bollinger on Bollinger Bands by John Bollinger

Bollinger on Bollinger Bands is a comprehensive guide to using Bollinger Bands, a popular technical analysis indicator, in trading.

Written by John Bollinger himself, the creator of Bollinger Bands, the book is a must-read for traders of all levels looking to improve their trading skills and increase their profits.

In this blog post, I will share all about this book and the author, key ideas from the book, and how you can apply it to your own trading & investing journey.


About the Author

John Bollinger is a well-known figure in the trading world and the creator of Bollinger Bands, a technical analysis tool used by traders to measure market volatility and identify trends.

Bollinger has over 30 years of experience in the financial markets and has written several books on trading and technical analysis.

He is also the president of Bollinger Capital Management, an investment management firm that provides technical analysis and portfolio management services to institutional and individual clients.

What is the Book About?

The main message of the book is that Bollinger Bands are a powerful tool that can help traders make informed decisions about when to enter and exit trades.

The book covers a wide range of topics related to Bollinger Bands, including how to use them to identify trends, spot potential reversals, and gauge market volatility.

Bollinger also provides guidance on how to effectively combine Bollinger Bands with other technical indicators and fundamental analysis to form a complete trading strategy.

10 Key Ideas from the Book

Here are 10 key ideas from the book:

  1. Bollinger Bands are a technical analysis tool used to measure market volatility and identify trends. They consist of three lines plotted on a chart: a moving average, an upper band, and a lower band. The upper and lower bands are plotted at a standard deviation above and below the moving average, respectively.
  2. Bollinger Bands are useful for identifying overbought and oversold conditions in the market. When the price is trading near the upper band, it may be overbought, and when it is trading near the lower band, it may be oversold.
  3. Bollinger Bands can be used in conjunction with other indicators and techniques to confirm trends and help with decision-making. For example, if the price breaks through the upper or lower band, it may be a sign of a trend reversal, and if it bounces off the band, it may be a sign of a trend continuation.
  4. Bollinger Bands can be customized to fit the specific needs and preferences of the trader. The moving average, standard deviation, and time period can be adjusted to fit the trader’s trading style and market conditions.
  5. Bollinger Bands can be used in all market conditions and time frames, from short-term to long-term, and can be applied to any asset class, including stocks, forex, and commodities.
  6. Bollinger Bands can be used as a standalone tool or as part of a larger trading system. It is important to have a clear trading plan and risk management strategy in place to ensure consistent profits.
  7. Bollinger Bands can be used to identify potential entry and exit points in a trade. By using Bollinger Bands in combination with other technical analysis tools, traders can look for opportunities to enter a trade when the price is near the lower band or exit a trade when the price is near the upper band. For example, if the price is trending upwards and bounces off the lower band, a trader may look for a buying opportunity, and if the price is trending downwards and breaks through the upper band, a trader may look for a selling opportunity.
  8. Bollinger Bands can be used to identify trends and trend reversals in the market. When the price is trending upwards, the bands will often expand, and when the price is trending downwards, the bands will often contract. If the price breaks through the upper or lower band, it may be a sign of a trend reversal, and if it bounces off the band, it may be a sign of a trend continuation.
  9. Bollinger Bands can be used to help traders manage their risk. By setting stop loss orders at the upper or lower band, traders can limit their potential losses in the event of a sudden market move.
  10. Bollinger Bands can be used to help traders identify potential areas of support and resistance in the market. When the price is trending upwards and hits the upper band, it may act as a resistance level, and when the price is trending downwards and hits the lower band, it may act as a support level.

10 Ways to Apply the Teachings

Actionable Ways to Apply What is Taught in the Book:

  1. Use Bollinger Bands as a key tool in your trading strategy to help identify overbought and oversold conditions in the market.
  2. Customize Bollinger Bands to fit your specific needs and preferences by adjusting the moving average, standard deviation, and time period.
  3. Use Bollinger Bands to identify potential entry and exit points in a trade by looking for opportunities to enter when the price is near the lower band or exit when the price is near the upper band.
  4. Use Bollinger Bands to help identify trends and trend reversals in the market by looking for expansions and contractions in the bands and breaks or bounces off the upper or lower band.
  5. Use Bollinger Bands to help manage risk by setting stop loss orders at the upper or lower band.
  6. Use Bollinger Bands to help identify potential areas of support and resistance in the market by looking for the price to hit the upper or lower band.
  7. Use Bollinger Bands to help improve your trading discipline by following a clear trading plan and risk management strategy.
  8. Use Bollinger Bands to help improve your market analysis skills by studying how the bands react to different market conditions and events.
  9. Use Bollinger Bands to help improve your decision-making skills by using them in conjunction with other technical analysis tools and techniques.
  10. Use Bollinger Bands to help improve your trading performance by consistently applying what you have learned from the book and regularly reviewing and adjusting your trading strategy.

Other Important Points from the Book

Other Points to Consider:

  • Bollinger Bands are a technical analysis tool and should not be used as a standalone indicator. It is important to use them in conjunction with other technical analysis tools and techniques to confirm trends and help with decision-making.
  • Bollinger Bands are based on historical data and do not predict future market movements. It is important to use them as a guide and not a guarantee of future performance.
  • Bollinger Bands are affected by market volatility, and the bands may expand or contract depending on the level of volatility. It is important to consider this when using Bollinger Bands to identify trends and potential entry and exit points in a trade.
  • It is important to regularly review and adjust your trading strategy and Bollinger Bands settings to fit changing market conditions and your own trading style.
  • It is important to have a clear trading plan and risk management strategy in place to ensure consistent profits and protect against potential losses.

Practical Application & Tips

I have found Bollinger on Bollinger Bands to be an extremely useful and valuable resource in my personal trading.

As a full-time trader, I am always looking for ways to improve my trading skills and increase my profits.

Bollinger on Bollinger Bands has helped me do this by providing a clear and simple approach to using Bollinger Bands as a key tool in my trading strategy.

By following the book’s guidance on customizing the bands to fit my specific needs and preferences, as well as using them in conjunction with other technical analysis tools and techniques, I have been able to consistently identify overbought and oversold conditions in the market and enter and exit trades at favorable times.

In addition, the book’s emphasis on treating trading as a business and having a clear trading plan and risk management strategy in place has been invaluable in helping me approach trading in a professional and disciplined manner.

By following these principles, I have been able to consistently generate profits and protect against potential losses.

One practical example of how Bollinger on Bollinger Bands has helped me in my personal trading is a trade I made in the EUR/USD currency pair.

I was looking for a buying opportunity and noticed that the price was trending upwards and had bounced off the lower band, indicating a potential trend continuation.

I also used other technical analysis tools to confirm the trend and set a stop loss order at the upper band to limit my potential losses.

The trade ended up being a success, and I was able to generate a profit thanks to the application of its principles.

Concluding Thoughts

In conclusion, Bollinger on Bollinger Bands is a comprehensive and valuable resource for traders of all levels looking to improve their trading skills and increase their profits.

The book’s clear and simple approach to using Bollinger Bands as a key tool in a trading strategy, as well as its emphasis on market psychology and a multi-faceted approach to trading, make it a must-read for anyone looking to take their trading to the next level.

I would highly recommend this book to both beginner and experienced traders who are looking to improve their trading skills and results.

Now that I have covered all the key learning points of this book, would you consider adding it to your reading list?

For those who have already read it, what are some of your key learning points?

Let me know in the comments below.


best books on trading and investing

If you would like to find more book summaries and recommendations, also check out: “Best Investing & Trading Books of All Time”

Thumbnail Inverted Hammer Candlestick Pattern Trading Strategy Guide

Thumbnail Inverted Hammer Candlestick Pattern Trading Strategy Guide

The Inverted Hammer Candlestick Pattern is a powerful tool for traders looking to identify trend reversals and potential buying opportunities.

But what is the Inverted Hammer Candlestick Pattern, and how can it be used to make profitable trades?

In this blog post, I’m going to teach you all about this candlestick pattern, how to identify it, the strategies to trade it, and some practical applications of this pattern.


How to Identify the Inverted Hammer

First, let’s take a look at how to identify the Inverted Hammer Candlestick Pattern.

This pattern is formed when the following conditions are met:

  • The market is in a downtrend
  • The candlestick has a small body, typically white in color
  • The candlestick has a long upper shadow
  • The lower shadow is small or absent

In other words, the Inverted Hammer Candlestick Pattern looks like a small white candle with a long tail pointing upwards.

This pattern indicates that, while the market was initially moving downwards, buyers were able to push prices up towards the end of the trading period.

Psychology of the Pattern

The psychology behind the Inverted Hammer Candlestick Pattern is one of potential bullish reversal.

While the market was previously moving downwards, the presence of buyers able to push prices upwards suggests that the downtrend may be coming to an end.

This can be a good opportunity for traders to enter the market and potentially profit from a potential uptrend.

How to Use it to Trade

So, how can the Inverted Hammer Candlestick Pattern be used to trade?

One strategy is to look for this pattern at key support levels.

If the market is approaching a key support level and an Inverted Hammer Candlestick Pattern appears, this may be a good opportunity to enter the market and buy.

Stop loss orders can be placed below the low of the Inverted Hammer Candlestick, while profit can be taken at resistance levels or using a trailing stop.

Where to Enter a Trade

When using the Inverted Hammer Candlestick Pattern as a potential bullish reversal signal, traders can enter the market by placing a buy order at the open of the next candlestick.

This allows traders to take a position in the market as soon as possible after the pattern appears.

Where to Place the Stoploss

Stop loss orders can be placed below the low of the Inverted Hammer Candlestick.

This allows traders to limit their potential losses in case the market does not move in their favor.

Where to Take Profit on the Trade

Profit can be taken at resistance levels or using a trailing stop.

By taking profit at a resistance level, traders can capitalize on the potential uptrend.

Alternatively, a trailing stop can be used to lock in profits as the market moves in the trader’s favor.

How to Combine with Trendlines

The Inverted Hammer Candlestick Pattern can also be combined with trendlines to identify potential trend reversals.

By drawing a trendline through the lows of the candlesticks, traders can identify a potential uptrend if the Inverted Hammer Candlestick appears near the trendline.

This can be a good opportunity to enter the market and potentially profit from an uptrend.

How to Combine with Support and Resistance Levels

Support and resistance levels can also be useful in conjunction with the Inverted Hammer Candlestick Pattern.

If the market is approaching a key support level and an Inverted Hammer Candlestick appears, this may be a good opportunity to enter the market and buy.

Stop loss orders can be placed below the low of the Inverted Hammer Candlestick, while profit can be taken at resistance levels or using a trailing stop.

How to Combine with Price Patterns

The Inverted Hammer Candlestick Pattern can also be combined with other price patterns to increase the reliability of trade signals.

For example, if the Inverted Hammer Candlestick appears in conjunction with a Double Bottom pattern, this may be a particularly strong signal for a potential trend reversal.

How to Combine it with Price Action

Price action analysis is the study of the movement of a security’s price over a given period of time.

When combined with the Inverted Hammer Candlestick Pattern, price action analysis can help traders identify potential bullish reversal signals and make informed trading decisions.

To combine the Inverted Hammer Candlestick Pattern with price action analysis, traders can look for other bullish reversal patterns in conjunction with the Inverted Hammer.

For example, if the market is in a downtrend and an Inverted Hammer Candlestick appears, traders can look for other bullish reversal patterns, such as Bullish Engulfing Patterns or Hammer Patterns, to confirm the potential trend reversal.

How to Combine it with Trend-following Indicators

Trend-following technical indicators such as moving averages, MACD, and ADX can also be useful in combination with the Inverted Hammer Candlestick Pattern.

By using these indicators to confirm a potential trend reversal, traders can increase the reliability of their trade signals.

How to Combine with Oscillators

When the RSI is combined with the Inverted Hammer Candlestick Pattern, traders can look for bullish reversal signals in oversold markets.

For example, if the market is in an downtrend and the RSI is below 30, the appearance of an Inverted Hammer Candlestick Pattern may be a good opportunity to buy.

Similarly, the Stochastics indicator is a momentum oscillator that measures the location of a security’s price relative to its price range over a set period of time.

Like the RSI, the Stochastics indicator can be useful in identifying overbought and oversold conditions.

When combined with the Inverted Hammer Candlestick Pattern, traders can look for bullish reversal signals in oversold markets.

Limitations of Inverted Hammer Pattern

It’s important to keep in mind that the Inverted Hammer Candlestick Pattern is not a perfect trading tool and should not be relied upon exclusively.

It’s always important to use a range of indicators and techniques to increase the reliability of trade signals and to minimize risk.

The pattern may also be less reliable in volatile or low volume markets, as these conditions may create false signals.

Practical Applications & Tips

As a professional trader, I have a strong understanding of how to trade effectively and consistently.

This knowledge has helped me to level the playing field against other retail traders, and has given me an edge in the market.

My former experience in fund trading has also given me valuable insights into how professionals trade differently, and I have been able to apply this knowledge to my personal trading.

Finally, I make use of the principle of confluence in my trading, looking for alignment between different approaches and techniques.

I use a multi-faceted approach that combines different indicators and techniques, such as trendlines, support and resistance levels, and oscillator indicators.

This approach helps me to make the most informed trades possible, and has helped me to consistently grow my trading account.

Concluding Thoughts

In conclusion, the Inverted Hammer Candlestick Pattern is a valuable tool for traders looking to identify trend reversals and potential buying opportunities.

By combining this pattern with other techniques and indicators, traders can increase the reliability of their trade signals and maximize their chances of making profitable trades.

While the Inverted Hammer Candlestick Pattern is not a perfect trading tool, it can be a valuable addition to any trader’s toolkit.

Now that I have covered all about this candlestick pattern, is it something that you will add to your trading toolbox?

Let me know in the comments below.


ed seykota

If you would like to learn more about all the different candlestick patterns, also check out: “The Definitive Guide to Candlestick Patterns”

Kolsay Lakes National Park Kazakhstan

Looking back, 2022 has been challenging for the stock market and many analysts do not have high expectations for 2023.

There is a growing consensus among analysts that there will be a selloff in the first half of next year due to negative estimates for future performance.

However, some believe that the next year could present a good opportunity to buy before the Federal Reserve (Fed) potentially needs to lower interest rates in 2024 in order to support the economy during a recession.

To protect from downside risk, the more prudent approach is to hedge by investing in inflation-related themes, or by using fixed income products such as T-bonds or T-bills.

When the yields start turning down, it would be an early indicator to rotate back into the stock market, in time for the next major bull market.

To kickstart your 2023 trading & investing journey, join our “Daily Trading Signals” Telegram channel!


Kolsay Lakes National Park Kazakhstan

[Photo: Kolsay Lakes National Park, Kazakhstan – See my full travel photo log!]

For our weekly market wrap, we go through some of the trade calls and analysis from last week, which gives us valuable insights for the week ahead.

We cover 3 main markets with a total of 200+ counters, so we will never run out of trading opportunities:

By covering a broad range of markets, we can focus our attention (and capital) on whichever market currently gives the best returns.

Click here to receive all these signals in real-time for only $67 a month! You will get several signals a day, and even taking just 1 trade the whole month can easily cover the fee, so what are you waiting for?


Special Report: Review of 2022 & Outlook for 2023

The global stock market has seen a significant decrease due to high levels of inflation and aggressive actions taken by central banks, particularly the U.S. Federal Reserve, to increase interest rates.

While the energy sector has performed well, some companies that benefited from the pandemic, like DocuSign, Roku, and Peloton, have struggled. The NASDAQ Composite index, which is heavily focused on technology, has dropped by about 33% this year.

The Fed has raised interest rates by 4.25% this year and Chair Jerome Powell has indicated that more work needs to be done to reduce inflation.

Goldman Sachs analysts predict that the Fed will further increase the benchmark interest rate to between 5.0-5.2%. Goldman strategists have also stated that they do not expect the Fed to lower the interest rate until the economy is at risk of entering a recession, which they do not expect to occur next year.

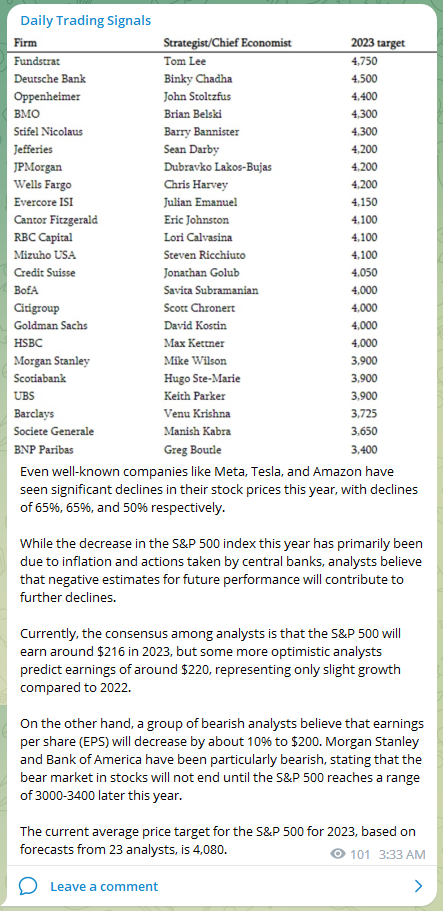
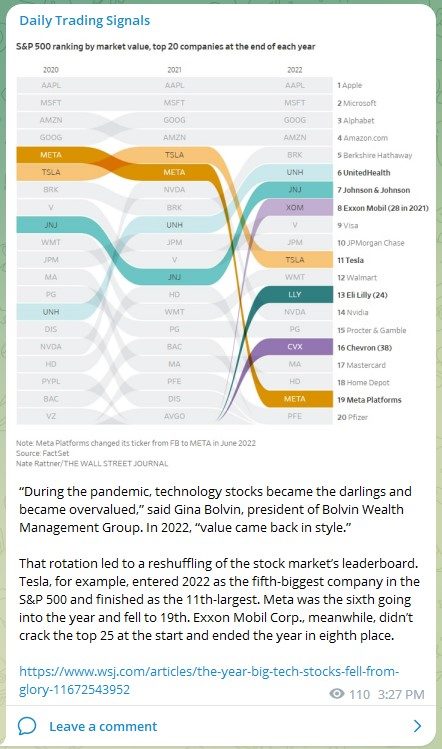
Even well-known companies like Meta Platforms, Tesla, and Amazon have seen significant declines in their stock prices this year, with declines of 65%, 65%, and 50% respectively.

While the decrease in the S&P 500 index this year has primarily been due to inflation and actions taken by central banks, analysts believe that negative estimates for future performance will contribute to further declines.

Currently, the consensus among analysts is that the S&P 500 will earn around $216 in 2023, but some more optimistic analysts predict earnings of around $220, representing only slight growth compared to 2022.

On the other hand, a group of bearish analysts believe that earnings per share (EPS) will decrease by about 10% to $200. Morgan Stanley and Bank of America have been particularly bearish, stating that the bear market in stocks will not end until the S&P 500 reaches a range of 3000-3400 later this year.

The current average price target for the S&P 500 for 2023, based on forecasts from 23 analysts, is 4,080.


Weekly Market Outlook Video

Trading Signals Weekly market outlook 251222

Weekly Market Outlook (25 December 2022)

Market is likely to be quiet this week due to Christmas and New Year holidays.

Watch out for any Santa Rally (last 5 days of the year and first 2 days of the new year), which might give a good shorting opportunity in the stock market.


Portfolio Highlights

Trading Signals Weekly portfolio updates 251222

Weekly Portfolio Updates (25 December 2022)

Added more short positions for stocks and REITs, and will continue adding more on any pullbacks.


Forex & Commodities Market Highlights

Trading Signals EURAUD 281222

EURAUD – Watch to see if some consolidation zone forms here, followed by bullish price action.


Trading Signals USDCNY 301222

USDCNY – With China opening up, the Yuan is strengthening, and this pair looks like it will be heading lower after breaking out from the bear flag/pennant pattern.


Trading Signals USDSGD 301222

USDSGD – Looks like this is going to continue heading down to test the major support level, which is the bottom of the wide range.


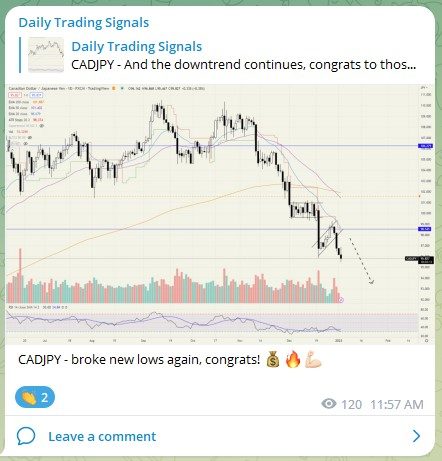
Trading Signals CADJPY 301222 1

CADJPY – And the downtrend continues, congrats to those who are also holding short positions! 💰🔥💪🏻


Stock & Bond Market Highlights

Trading Signals US100 301222

US100 (NASDAQ 100) – After dropping about 12% from the recent swing highs, it is now testing major support.

Currently, there is a good chance it will test previous lows and even break new lows.

If it manages to make a U-turn and break above the previous swing high of aounrd 12400, then there is a good chance of a market reversal.


Trading Signals inflation news 271222

https://www.wsj.com/articles/wall-street-and-fed-flopped-in-trying-to-predict-2022-11672050603


Click here to receive all these signals in real-time for only $67 a month! You will get several signals a day, and even taking just 1 trade the whole month can easily cover the fee, so what are you waiting for?

Good luck, and may next week bring more excellent profits!

Thumbnail Hanging Man Candlestick Pattern Trading Strategy Guide

Thumbnail Hanging Man Candlestick Pattern Trading Strategy Guide


The Hanging Man Candlestick Pattern is a technical analysis tool used in trading to identify potential reversals in the market.

This pattern is formed when the price of an asset opens at a high and then closes lower, creating a candle with a long downward wick and a small body.

The pattern gets its name from the shape of the candle, which looks like a person hanging by their feet.

While it is not as well-known as other candlestick patterns, such as the Bullish Engulfing Pattern or the Bearish Engulfing Pattern, the Hanging Man Pattern can be a valuable tool for traders looking to enter or exit a position.

In this blog post, I’m going to teach you all about this candlestick pattern, how to identify it, the strategies to trade it, and some practical applications of this pattern.


How to Identify the Hanging Man

  • The Hanging Man Pattern is characterized by a small body and a long downward wick.
  • The small body can be either bullish or bearish, but the long downward wick is always bearish.
  • The body of the candle is typically located at the top of the candle, near the open price, and the downward wick extends below the body.

Psychology of the Pattern

  • The Hanging Man Pattern is often seen as a bearish reversal pattern, indicating that the price may be about to fall after a uptrend.
  • This pattern suggests that the bears are starting to gain control of the market, as they push the price down from the high open.
  • However, it is important to note that the Hanging Man Pattern is not always a strong reversal signal and should be used in conjunction with other technical analysis tools.

How to Use it to Trade

  • One way to use the Hanging Man Pattern is to trade the reversal by selling a long position or buying a short position.
  • Another way to trade the pattern is to wait for confirmation of the reversal, such as with a bearish candle following the Hanging Man Pattern.
  • It is also important to consider the overall trend and the strength of the pattern when making a trade decision.

Trading Strategies for the Hanging Man Pattern

  • One strategy for trading the Hanging Man Pattern is to enter a short position after the pattern has formed and wait for the price to fall.
  • Another strategy is to enter a long position on a breakout above the high of the Hanging Man Pattern, as this may indicate a continuation of the uptrend.
  • It is also possible to use the Hanging Man Pattern as a stop loss strategy, by placing a stop loss order below the low of the pattern.

Where to Enter a Trade

  • One option for entering a trade based on the Hanging Man Pattern is to place a market order at the open of the next candle following the pattern.
  • Another option is to use a limit order, setting the entry price at a level above or below the pattern, depending on the direction of the trade.

Where to Place the Stoploss

  • One option for placing a stop loss when trading the Hanging Man Pattern is to use a percentage of the asset’s trading range, such as 2-3%.
  • Another option is to place the stop loss at a level below the low of the Hanging Man Pattern, as this may provide a clear level for the stop loss to be triggered if the price moves against the trade.

Where to Take Profit on the Trade

  • One way to take profit when trading the Hanging Man Pattern is to use a target price based on the size of the pattern and the expected move.
  • Another option is to use a trailing stop loss, which allows the trade to remain open as long as the price continues to move in the desired direction.

How to Combine with Trendlines

  • Trendlines can be a useful tool for identifying the trend  and potential reversal points in the market. When combined with the Hanging Man Pattern, trendlines can help traders confirm the reversal signal and make more informed trade decisions.
  • For example, if the Hanging Man Pattern forms after an uptrend and is accompanied by a trendline break, this may provide further confirmation of a potential trend reversal.
  • Similarly, if the Hanging Man Pattern forms after a downtrend and is accompanied by a trendline bounce, this may indicate a potential trend continuation.

How to Combine with Support and Resistance Levels

  • Support and resistance levels can also be useful for identifying potential reversal points in the market. When combined with the Hanging Man Pattern, these levels can help traders confirm the reversal signal and make more informed trade decisions.
  • For example, if the Hanging Man Pattern forms near a strong support level, this may indicate that the price is likely to bounce off the support and continue the uptrend.
  • On the other hand, if the Hanging Man Pattern forms near a strong resistance level, this may indicate that the price is likely to break through the resistance and continue the downtrend.

How to Combine with Price Patterns

  • Combining the Hanging Man Pattern with other price patterns, such as head and shoulders or double tops, can also provide further confirmation of a potential trend reversal.
  • For example, if the Hanging Man Pattern forms at the top of a head and shoulders pattern, this may indicate that the price is about to reverse and move lower.
  • Similarly, if the Hanging Man Pattern forms at the top of a double top pattern, this may also indicate a potential trend reversal to the downside.

How to Combine it with Price Action

  • Price action trading involves analyzing the movement of the price itself, rather than relying on indicators or other technical analysis tools. Combining the Hanging Man Pattern with price action analysis can provide a more complete picture of the market and help traders make more informed trade decisions.
  • For example, traders can look for other price action signals, such as bearish engulfing patterns or bearish harami patterns, to confirm the reversal signal provided by the Hanging Man Pattern.

How to Combine it with Trend-following Indicators

  • Trend-following technical indicators, such as moving averages and MACD, can be useful for identifying the overall trend and potential reversal points in the market. When combined with the Hanging Man Pattern, these indicators can help traders confirm the reversal signal and make more informed trade decisions.
  • For example, if the Hanging Man Pattern forms after an uptrend and is accompanied by a bearish crossover in the moving averages or a bearish divergence in the MACD, this may provide further confirmation of a potential trend reversal.

How to Combine with Oscillators

  • Oscillator indicators, such as RSI and Stochastics, can be useful for identifying overbought and oversold conditions in the market. When combined with the Hanging Man Pattern, these indicators can help traders confirm the reversal signal and make more informed trade decisions.
  • For example, if the Hanging Man Pattern forms after an uptrend and is accompanied by an overbought reading in the RSI or a bearish crossover in the Stochastics, this may provide further confirmation of a potential trend reversal.

Limitations of Hanging Man Pattern

  • It is important to note that the Hanging Man Pattern is not a reliable reversal signal on its own and should be used in conjunction with other technical analysis tools.
  • The pattern may also be less reliable in volatile or low volume markets, as these conditions may create false signals.
  • Additionally, the Hanging Man Pattern may not always indicate a trend reversal, as it can also occur during a consolidation or sideways movement in the market.

Practical Applications

The Hanging Man Pattern has helped me in my personal trading by providing potential reversal signals that I can use to enter or exit positions.

For example, when trading for a living as a full-time trader, it is important to be able to identify potential reversals in order to maximize profits and minimize losses.

By using the Hanging Man Pattern as one of my technical analysis tools, I have been able to improve my trade timing and make more informed decisions about when to enter or exit a position.

As a professional trader, I have found that the Hanging Man Pattern can be a valuable tool for identifying potential reversals in the market.

By using this pattern in combination with other technical analysis tools, such as trendlines and oscillator indicators, I have been able to improve my trade accuracy and increase my profits.

For example, when the Hanging Man Pattern forms at a key resistance level and is accompanied by a bearish divergence in the RSI, I have often found this to be a strong signal to sell.

Concluding Thoughts

In conclusion, the Hanging Man Candlestick Pattern is a technical analysis tool that can be used to identify potential reversals in the market.

While it is not a reliable signal on its own, it can be a useful tool when combined with other technical analysis techniques, such as trendlines, support and resistance levels, and oscillator indicators.

By using the Hanging Man Pattern in my personal trading, I have been able to improve my trade timing and make more informed decisions about when to enter or exit a position.

However, it is important to remember that no single technical analysis tool is foolproof and that it is always important to consider the overall market conditions when making trade decisions.

Now that I have covered all about this candlestick pattern, is it something that you will add to your trading toolbox?

Let me know in the comments below.


ed seykota

If you would like to learn more about all the different candlestick patterns, also check out: “The Definitive Guide to Candlestick Patterns”