

Bollinger on Bollinger Bands Summary: John Bollinger’s Rules, and Why a Band Tag Is Not a Signal
Want the daily routine? Get the free 15-Minute Swing Trader’s Checklist. Get it free →
By Spencer Li, CFTe · Last updated: 26 October 2026
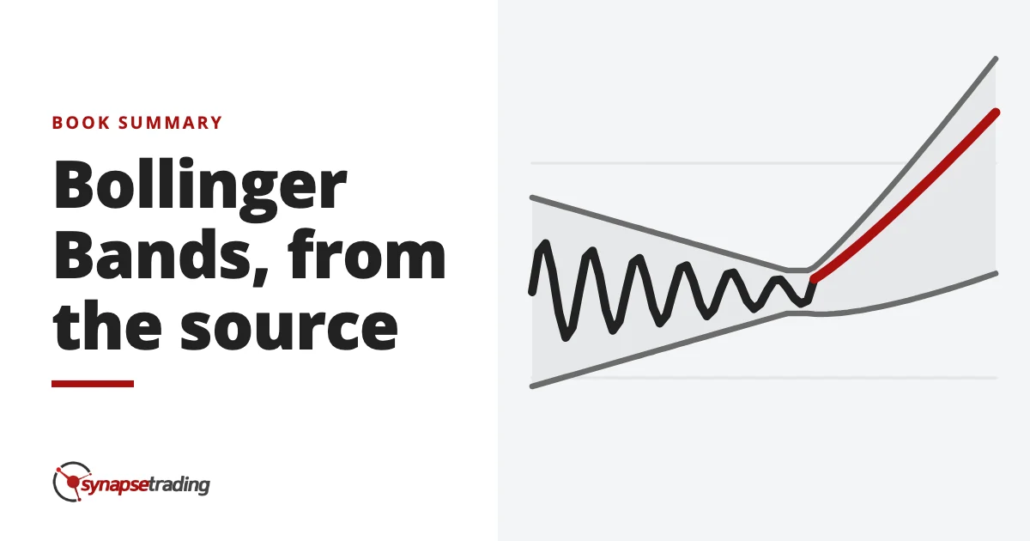
Bollinger on Bollinger Bands is John Bollinger’s own guide to the indicator he created in the early 1980s, published by McGraw Hill in 2001. Its main message is that the bands give you a relative definition of high and low. Price near the upper band is high, price near the lower band is low, and a touch of either band is a tag rather than an order to buy or sell. Around that one idea Bollinger builds 2 indicators of his own, %b and BandWidth, a setup called the Squeeze, and 3 trading methods.
My own copy is heavily marked up, mostly in the chapters on how the bands are built and on the 3 methods, which may sound odd, since my standard chart has no Bollinger Bands on it at all. Just 3 moving averages, volume and RSI. But the book turns out to be less about one indicator and more about a question every trader faces, which is how you decide that a price is high.
What is Bollinger on Bollinger Bands about?
Bollinger opens a book about a chart indicator with Albert Einstein, Bertrand Russell and the American judge Oliver Wendell Holmes Jr., which is quite an unusual start for a trading manual. His argument is that as a system grows more complex, absolute rules stop working. In his words, “the only tools that serve to help understand complex systems are relative tools.”
Markets are one of those systems. So the bands never call a stock expensive at a fixed price. They call it high compared with its own recent range.
One warning runs through all 6 parts of the book. No system gives continuous advice. Bollinger compares the trader to a forty-niner in the California gold rush, who pans where the gold is rather than panning all day and hoping.
How did John Bollinger invent the bands?
Imagine drawing your own trading bands by hand, and noticing that they always seem to agree with whatever you already believe. That was the problem Bollinger ran into.
He went full time in the markets in 1980, mainly in options and technical analysis, and the popular tool then was percentage bands, a moving average shifted up and down by a fixed percentage. Those had to be redrawn every so often, and he noticed that emotion crept in during the redrawing. If you were bullish, you tended to draw bands that looked bullish.
The fix came from his options work. He had built volatility models in an early spreadsheet program called SuperCalc, and one day he copied a volatility formula down a column of data and noticed that volatility changed over time. Most people then treated volatility as fixed, so using it to set the width of the bands was, as he says, “a leap of faith.”
The name came later, on live television. Bollinger was chief market analyst at the Financial News Network from 1983 to 1990. During one segment the host, Bill Griffeth, asked him what he called the lines around the price, and with no answer ready he “blurted out the alliteratively obvious choice.” It stuck.
Today he is the president and founder of Bollinger Capital Management and holds both the CFA and CMT designations. Among his awards is IFTA’s 2015 Lifetime Achievement Award.
How are Bollinger Bands built?
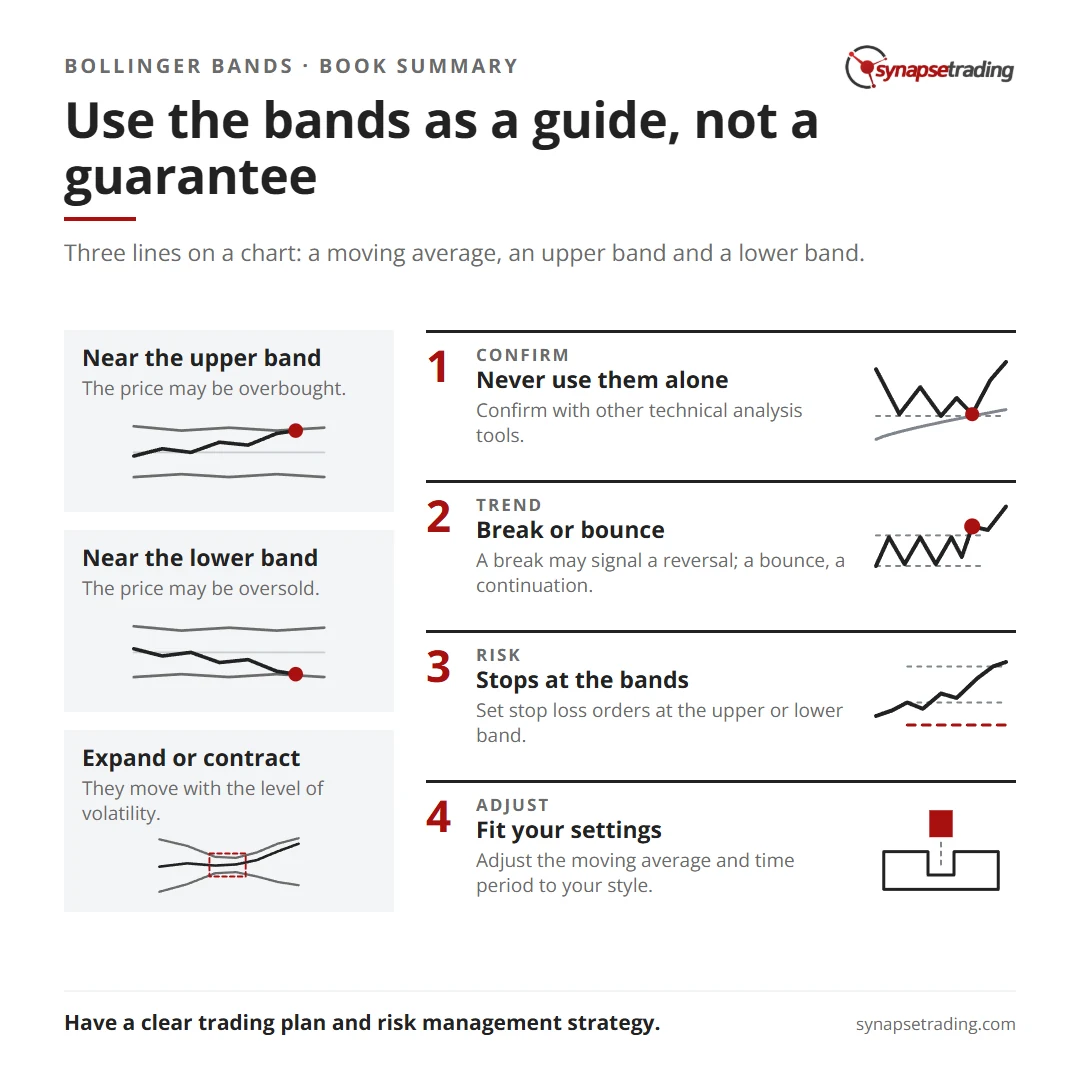
The middle band is a 20-period simple moving average. The upper band sits 2 standard deviations above it and the lower band 2 standard deviations below, using the same 20 periods. Standard deviation measures how spread out prices have been around their average, so the bands widen when swings get bigger and pull in when the market goes quiet. Bollinger says the bands almost seem to “chase after price,” and he calls that the key to their power.
Every choice has a reason. The average is a simple one because the standard deviation calculation uses a simple average, and “we wish to be logically consistent.” The middle band should also describe the intermediate-term trend, rather than be tuned for crossover signals.
The settings are only defaults. If you change the length, Bollinger adjusts the width so the bands hold about the same share of prices. That gives 1.9 standard deviations at 10 periods, 2 at 20 and 2.1 at 50.
If you trade around a full-time job, the free 15-minute swing trader checklist is the daily routine I use myself.
Why do the bands hold less than the textbook says?
If prices followed the bell curve from a statistics textbook, about 95% of them would sit within 2 standard deviations of the average. Bollinger measured the real figure and found less. In the book it comes out at about 88% to 89% in most markets, and his website rounds it to about 90%.
The gap is a lesson from statistics that reaches well beyond trading, because market returns have fat tails, which means big moves turn up far more often than a bell curve allows, and 20 bars is a tiny sample anyway. So Bollinger’s rule is blunt: “Make no statistical assumptions based on the use of the standard deviation calculation in the construction of the bands.”
Suppose you ignore it and treat every close outside the band as a 1-in-20 event that must snap back. You will be surprised far more often than you planned, and the surprises will be the big moves, which is exactly where accounts get wiped out. It is the same reason risk models built on the bell curve tend to underestimate rare events.
Is touching the upper band a sell signal?
On 16 June 2026, a trader on Reddit’s r/technicalanalysis posted an oil stock that had closed under its lower band 2 days in a row. They called it “something pretty rare that the price usually bounce back up from.” That is how most people read the bands, and it is the reading Bollinger spends the most pages taking apart.
“The greatest myth about Bollinger Bands is that you are supposed to sell at the upper band and buy at the lower band,” he writes. His published rules go further. Tags are “tags not signals,” and in a trend, price “can, and does, walk up the upper Bollinger Band and down the lower Bollinger Band.” Closes outside the bands, like the 2 in that post, “are initially continuation signals, not reversal signals.”
Still, the trader was onto something, and Bollinger concedes it in the same breath. “It can work that way, but it doesn’t have to.” Before the bands had a name, an upper-band tag that his volume oscillator failed to confirm was a sell setup in his own work. His favourite method in the 2001 book still trades tags of that kind. What changes is the second piece of evidence, because a tag that an independent indicator disagrees with is worth a closer look, and a tag on its own is just a tag.
What are %b and BandWidth?
Once you accept that high and low are relative, the next question is how to put a number on it, and Bollinger’s answer is 2 indicators built from the bands.
%b tells you where price sits inside the bands. It is the last price minus the lower band, divided by the distance between the 2 bands. A reading of 1 is the upper band, 0.5 the middle and 0 the lower band, and it goes beyond those when price closes outside.
BandWidth tells you how wide the bands are. It is the distance between the 2 outer bands, divided by the middle band, so a quiet stock and a wild one can be compared. A sharp jump in BandWidth out of a quiet range often marks the start of a trend.
Bollinger also uses %b on indicators. Put bands on RSI, take its %b, and the fixed 70 and 30 lines give way to levels that move with the market. That fixes a problem I know well. On my own chart RSI is a caution flag rather than an entry, because “in a strong trend RSI just stays overbought, it’s not much use.”
If you want a routine that keeps chart reading short, the free 15-minute swing trader checklist is the one I run every day.
What is the Bollinger Squeeze?
“Low volatility begets high volatility. High volatility begets low volatility.” That line is the whole idea behind the Squeeze. When the bands get unusually narrow, the quiet itself is the warning.
Bollinger’s simplest definition is BandWidth falling to its lowest level in 6 months. Direction is another matter. For that he looks at evidence such as volume on up days, and he notes that news is often what sets the move off.
Then comes the head fake. Near the end of a Squeeze, price often makes a short move the wrong way, then turns and runs the other way. Bollinger borrows the picture from ice hockey, where a player feints before shooting, and his first answer is to wait for the real move to develop. My guide to false breakouts covers the same trap on ordinary support and resistance.
What are Bollinger’s three methods?
The last third of the book turns the tools into 3 complete methods.
| Method | What it looks for | The trap Bollinger names |
|---|---|---|
| I: Volatility breakout | A Squeeze, then price breaking out as volatility expands | The head fake |
| II: Trend following | Strength in price that a volume indicator confirms | Getting in late |
| III: Reversals | A band tag that a volume indicator refuses to confirm | Hunting for an indicator that agrees with you |
Method III is his favourite, the one he describes as “where I got on the bus.” The book prints exact trigger levels for each method. I have left them out on purpose, because Bollinger insists you test and tune them on the markets you actually trade.
All 3 lean on volume indicators such as Intraday Intensity, Money Flow Index and volume-weighted MACD, since volatility and trend are already built into the bands. And he warns against doubling up, because “two momentum indicators aren’t better than one.”
Is Bollinger on Bollinger Bands worth reading?
It depends on what you want. The book is a toolkit and a way of thinking, rather than a system you switch on. Bollinger notes that if you teach 100 people one system, a month later hardly any are still running it as taught. So he asks every reader to tune the tools to their own risk.
There are honest limits too, since the worked charts date from around 1999 to 2001 and many of the websites he points to have gone. Reading patterns against the bands also takes judgment, so two traders can label the same swing quite differently.
At Synapse Trading I teach price action, support and resistance and trend, rather than indicator-heavy systems. The idea from this book that carries over to any chart is the one from the percentage-band days. Decide what counts as high or low with a rule before the trade, because once you draw the lines by feel, fear and greed end up drawing them for you.
If you are new to the indicator itself, start with my guide to the Bollinger Bands indicator. For a close cousin built on average true range, read my guide to the Keltner Channel.
FAQ
What is the main idea of Bollinger on Bollinger Bands?
The bands give a relative definition of high and low, and a tag of a band is not a signal by itself. Bollinger confirms tags with volume indicators and builds 3 methods on %b and BandWidth.
What are the default Bollinger Band settings?
A 20-period simple moving average, with bands 2 standard deviations above and below. Bollinger suggests 1.9 standard deviations at 10 periods and 2.1 at 50.
Is touching the upper Bollinger Band a sell signal?
No. Bollinger calls that the greatest myth about the bands. In a trend, price can walk along a band, and closes outside the bands are at first continuation signals.
What is the Bollinger Squeeze?
A period when BandWidth falls to its lowest level in 6 months. Low volatility tends to be followed by high volatility, so a Squeeze often comes before a bigger move, in a direction it does not reveal.
What does %b mean?
It shows where price sits inside the bands. A reading of 1 is the upper band, 0.5 the middle band and 0 the lower band.
Have you ever sold a tag of the upper band and watched price keep walking up without you? Let me know in the comments.
My full reading list is in Best Investing and Trading Books of All Time, and the rest is in my free trading guides.
And if you want a trading routine that fits into 15 minutes a day, grab the free 15-minute swing trader checklist.
About the author. Spencer Li is The 15-Minute Trader and the founder of Synapse Trading. He is a Certified Financial Technician (CFTe) with 15+ years of trading, run from 70+ countries. He holds a B.Acc and B.BM from SMU. Every trade he takes is public, dated, losses left in. He teaches rules-based swing trading in 15 minutes a day, one system for any market.
Education, not financial advice. Synapse Trading is not licensed by MAS to advise on investment products. Trading carries risk of loss, and past performance is not indicative of future results.
Want the daily routine? Enter your email for the free 15-Minute Swing Trader's Checklist.
Free 5-page PDF, then occasional trading emails. Education only, not financial advice. Unsubscribe anytime. Kit stores your email in the US: see our privacy policy.
Want to learn the full method? The Trading Mastery Program teaches the 4 strategies I have traded since 2011. It suits beginners and experienced traders.
Rather follow the trades as they happen? Daily Trading Signals is our Telegram channel: my trade ideas with entry, stop and exit, and every trade is public.
Questions about this post? Ask in the free Telegram channel →
Educational content only, not personalised financial advice. Trading carries risk, including loss of capital. Past performance is not indicative of future results. Synapse Trading is not licensed or regulated by MAS.

