Hagia Sophia Turkey

Now that the bears are back in action, the market has switched from “potential reversal” mode back to “risk off” mode, and the stock market has resumed its decline.

In last week’s market outlook video, we mentioned that the best trading opportunities will be shorting the stock/REITs market.

Over the past 2 weeks, we have seen some stock indices drop by more than 10%.

Will we see new lows before the year is over?

We will be adding more shorts on any pullbacks, but doing it in a way to maximise returns and minimise risk.

Want to join us in our big short of the year?

Check out out “Daily Trading Signals” private Telegram group for real-time entry signals!


Hagia Sophia Turkey

[Photo: Hagia Sophia, Turkey – See my full travel photo log!]

For our weekly market wrap, we go through some of the trade calls and analysis from last week, which gives us valuable insights for the week ahead.

We cover 3 main markets with a total of 200+ counters, so we will never run out of trading opportunities:

By covering a broad range of markets, we can focus our attention (and capital) on whichever market currently gives the best returns.

Click here to receive all these signals in real-time for only $67 a month! You will get several signals a day, and even taking just 1 trade the whole month can easily cover the fee, so what are you waiting for?


Weekly Market Outlook Video

Trading Signals Weekly market outlook 181222

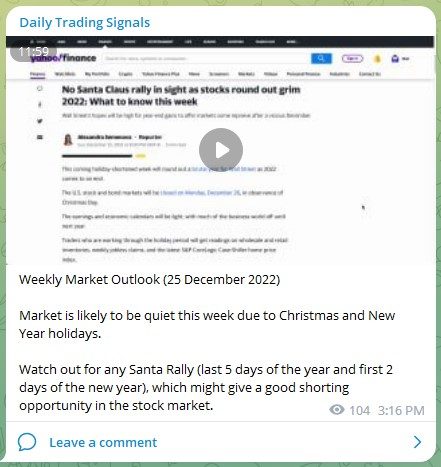
Weekly Market Outlook (18 December 2022)

After the false breakout for stocks on the bullish CPI data, prices made a U-turn back down.

During the FOMC, the Fed hinted that a pivot is not so soon, which added to the bearishness.

There is a good chance of seeing new lows in the stock market.


Portfolio Highlights

Trading Signals portfolio 181222

Weekly Portfolio Updates (18 December 2022)

Added more short positions for stocks, and will continue adding more next week on any pullbacks.


Forex & Commodities Market Highlights

Trading Signals AUDCHF 201222

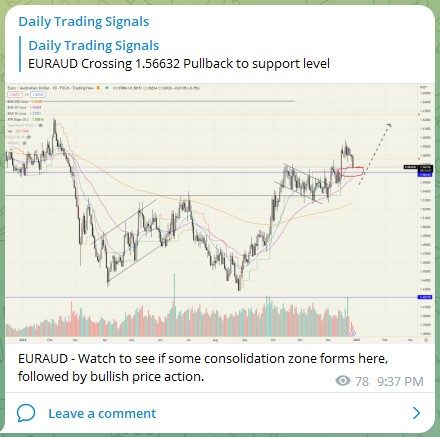
AUDCHF – Price is moving in our favour, can continue to hold for more downside! 💰🔥💪🏻


Trading Signals AUDJPY 201222

AUDJPY – Wow we did not expect it to hit our target in one day with 300+ pips profit! Congrats! 💰🔥💪🏻


Trading Signals CADJPY 201222

CADJPY – Strong downside breakout!

Headlines: “Nikkei 225 falls more than 2% after Bank of Japan widens yield target range, yen strengthens”


Trading Signals NZDCHF 181222

Can consider going long on NZDCHF during a tight stop below the 2-bar reversal.


Trading Signals WTIUSD 181222

Crude Oil (WTIUSD) on a long-term downtrend, and now has a pullback shorting opportunity.


Stock & Bond Market Highlights

Trading Signals REET 171222

The long-awaited breakdown for Global REITs (REET) finally came as well, after running into the top of the trend channel.

It also formed a rising wedge just before the breakdown, which added to the bear conviction.

Congrats to those who joined in the shorts! 💰🔥💪🏻

I will be continuing to add more shorts, hopefully prices break new lows by the end of the year.


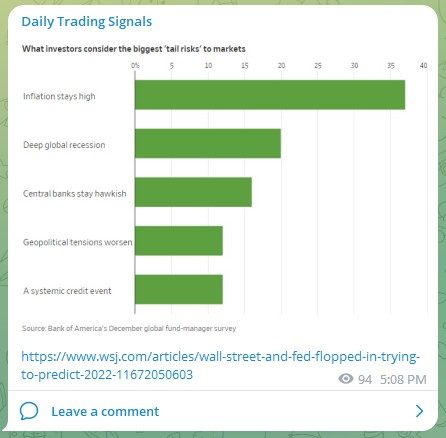
Trading Signals Inflation 211222

Biggest inflation movers of 2022.


Click here to receive all these signals in real-time for only $67 a month! You will get several signals a day, and even taking just 1 trade the whole month can easily cover the fee, so what are you waiting for?

Good luck, and may next week bring more excellent profits!

Thumbnail Dark Cloud Cover Candlestick Trading Strategy Guide

Thumbnail Dark Cloud Cover Candlestick Trading Strategy Guide

The Dark Cloud Cover Candlestick Pattern is a bearish candlestick pattern that is typically formed after an uptrend and indicates a potential trend reversal.

It is characterized by the following:

  • A long white candlestick
  • A short black candlestick that opens above the close of the previous day’s white candlestick and closes below the midpoint of the white candlestick

To identify the Dark Cloud Cover Candlestick Pattern, traders can look for the following:

  • An uptrend: The pattern is typically formed after an uptrend, as it indicates a potential trend reversal.
  • A long white candlestick: This indicates that the bulls are in control and are driving the price higher.
  • A short black candlestick: This indicates that the bears have taken control and are pushing the price lower. The black candlestick should open above the close of the previous day’s white candlestick and close below the midpoint of the white candlestick.

The psychology behind the Dark Cloud Cover Candlestick Pattern is that it represents a shift in sentiment from bullish to bearish.

During an uptrend, the bulls are in control and are driving the price higher.

However, when the Dark Cloud Cover Candlestick Pattern forms, it indicates that the bears have taken control and are pushing the price lower.

This can be seen as a sign of weakness and a potential reversal in the trend.

To use the Dark Cloud Cover Candlestick Pattern for trading, it is important to confirm the pattern with other technical analysis techniques and indicators.

One way to do this is to look for a break below the support level, which can be identified using trendlines.

To confirm the trend reversal with trendlines, traders can draw an uptrend line and wait for the price to break below it.

This indicates that the bulls have lost control and the bears are now in control.

Another way to confirm the Dark Cloud Cover Candlestick Pattern is to use support and resistance levels.

The pattern is typically formed at a key resistance level, and a break below the support level can indicate a potential trend reversal.

Traders can use previous highs and lows, or moving averages, to identify key support and resistance levels.

In addition to trendlines and support and resistance levels, traders can also combine the Dark Cloud Cover Candlestick Pattern with price patterns and price action.

For example, traders can look for other bearish patterns such as the Bearish Engulfing Pattern or the Evening Star Pattern to confirm the trend reversal.

They can also look for bearish price action such as a long black candlestick or a series of lower lows and lower highs to further confirm the trend reversal.

Traders can also use trend-following technical indicators such as moving averages and the moving average convergence divergence (MACD) to confirm the trend reversal.

These indicators can help identify the direction of the trend and confirm that the bears are in control.

Oscillator indicators such as the relative strength index (RSI) and stochastics can also be used to confirm the trend reversal.

These indicators can help identify overbought or oversold conditions and confirm the strength of the trend reversal.

When trading the Dark Cloud Cover Candlestick Pattern, it is important to consider where to enter the trade, where to place the stop loss, and where to take profit.

To enter the trade, it is recommended to wait for the black candlestick to close and then enter on a break below the low of the black candlestick.

The stop loss can be placed above the high of the black candlestick, while the take profit can be set at a key support level or based on the trader’s risk-reward ratio.

There are some limitations to the Dark Cloud Cover Candlestick Pattern that traders should be aware of.

One limitation is that the pattern is not always reliable and may not always signal a trend reversal.

In addition, the pattern can be easily faked out by false breaks or by the bulls regaining control and pushing the price higher. Therefore, it is important for traders to confirm the pattern with multiple techniques and indicators before entering a trade.

In conclusion, the Dark Cloud Cover Candlestick Pattern is a bearish candlestick pattern that is formed after an uptrend and indicates a potential trend reversal.

To identify the pattern, traders should look for an uptrend, a long white candlestick, and a short black candlestick that opens above the close of the previous day’s white candlestick and closes below the midpoint of the white candlestick.

The psychology behind the pattern is that it represents a shift in sentiment from bullish to bearish.


ed seykota

If you would like to learn more about all the different candlestick patterns, also check out: “The Definitive Guide to Candlestick Patterns”

Thumbnail Piercing Pattern Candlestick Trading Strategy Guide

Thumbnail Piercing Pattern Candlestick Trading Strategy Guide

The Piercing Pattern is a bullish candlestick pattern that is typically formed after a downtrend and indicates a potential trend reversal.

It is characterized by the following:

  • A long black candlestick
  • A short white candlestick that opens below the close of the previous day’s black candlestick

To identify the Piercing Pattern, traders can look for the following:

  • A downtrend: The pattern is typically formed after a downtrend, as it indicates a potential trend reversal.
  • A long black candlestick: This indicates that the bears are in control and are driving the price lower.
  • A short white candlestick: This indicates that the bulls have taken control and are pushing the price higher.

The psychology behind the Piercing Pattern is that it represents a shift in sentiment from bearish to bullish.

During a downtrend, the bears are in control and are driving the price lower. However, when the Piercing Pattern forms, it indicates that the bulls have taken control and are pushing the price higher.

This can be seen as a sign of strength and a potential reversal in the trend.

To use the Piercing Pattern for trading, it is important to confirm the pattern with other technical analysis techniques and indicators.

One way to do this is to look for a break above the resistance level, which can be identified using trendlines.

To confirm the trend reversal with trendlines, traders can draw a downtrend line and wait for the price to break above it.

This indicates that the bears have lost control and the bulls are now in control.

Another way to confirm the Piercing Pattern is to use support and resistance levels.

The pattern is typically formed at a key support level, and a break above the resistance level can indicate a potential trend reversal.

Traders can use previous highs and lows, or moving averages, to identify key support and resistance levels.

In addition to trendlines and support and resistance levels, traders can also combine the Piercing Pattern with price patterns and price action.

For example, traders can look for other bullish patterns such as the Bullish Engulfing Pattern or the Morning Star Pattern to confirm the trend reversal.

They can also look for bullish price action such as a long white candlestick or a series of higher highs and higher lows to further confirm the trend reversal.

Traders can also use trend-following technical indicators such as moving averages and the moving average convergence divergence (MACD) to confirm the trend reversal.

These indicators can help identify the direction of the trend and confirm that the bulls are in control.

Oscillator indicators such as the relative strength index (RSI) and stochastics can also be used to confirm the trend reversal.

These indicators can help identify overbought or oversold conditions and confirm the strength of the trend reversal.

When trading the Piercing Pattern, it is important to consider where to enter the trade, where to place the stop loss, and where to take profit.

To enter the trade, it is recommended to wait for the white candlestick to close and then enter on a break above the high of the white candlestick.

The stop loss can be placed below the low of the white candlestick, while the take profit can be set at a key resistance level or based on the trader’s risk-reward ratio.

There are some limitations to the Piercing Pattern that traders should be aware of.

One limitation is that the pattern is not always reliable and may not always signal a trend reversal.

In addition, the pattern can be easily faked out by false breaks or by the bears regaining control and pushing the price lower.

In conclusion, the Piercing Pattern is a bullish candlestick pattern that is formed after a downtrend and indicates a potential trend reversal.

It is important to confirm the pattern with other technical analysis techniques and indicators, such as trendlines, support and resistance levels, price patterns, price action, and technical indicators.

When trading this pattern, traders should consider where to enter, where to place the stop loss, and where to take profit.

While the pattern has some limitations, it can be a useful tool for traders looking to identify potential trend reversals.


ed seykota

If you would like to learn more about all the different candlestick patterns, also check out: “The Definitive Guide to Candlestick Patterns”
Thumbnail Evening Star Candlestick Pattern Trading Strategy Guide

Thumbnail Evening Star Candlestick Pattern Trading Strategy Guide

The evening star candlestick pattern is a bearish reversal pattern that appears after an uptrend in a financial security’s price.

It is characterized by a long upper shadow, which indicates that buyers tried to push the price higher but failed, and a small real body, which suggests that there was little trading activity during the period.

The pattern gets its name from the fact that it looks like a star setting in the evening sky.

The psychology behind the evening star pattern is that it shows a shift in sentiment from bullish to bearish.

During an uptrend, buyers are in control and are pushing the price higher.

However, when the evening star pattern appears, it indicates that the buyers are losing strength and that sellers are starting to take control.

This shift in sentiment can be caused by a variety of factors, such as a change in market conditions, the release of negative news, or the appearance of bearish technical indicators.

To use the evening star pattern for trading, it is important to confirm that it is indeed a valid pattern.

This means looking for the following characteristics:

  1. The evening star must appear after an uptrend.
  2. The upper shadow must be at least twice as long as the real body.
  3. The real body should be at the lower end of the trading range.

If these criteria are met, then the evening star pattern is considered valid and can be used as a signal to sell or short the security.

There are several trading strategies that can be used with the evening star pattern.

One strategy is to sell or short the security when the pattern appears and place a stop loss order just above the high of the evening star.

This will protect against any potential upside movement in the security’s price.

Another strategy is to wait for another bearish candlestick pattern to confirm the reversal, such as a bearish engulfing pattern or a dark cloud cover.

When it comes to placing a take profit order, traders can use a variety of techniques.

One approach is to use a fixed take profit level, such as a specific price level or a percentage of the entry price.

Another approach is to use a trailing stop loss order, which allows the trader to lock in profits as the security’s price moves in the desired direction.

There are also some limitations to the evening star pattern that traders should be aware of.

The evening star pattern has several limitations that traders should be aware of when using it to trade financial securities.

One limitation is that the pattern is not always reliable, as the security’s price may continue to rise despite its appearance.

It can also produce false signals, particularly in choppy or sideways markets.

To improve its accuracy, traders can combine the evening star pattern with other technical analysis techniques and indicators, such as bearish divergence on the relative strength index (RSI) or the appearance of the pattern at key resistance levels.

In conclusion, the evening star candlestick pattern is a bearish reversal indicator that can be used in financial market trading.

To maximize its effectiveness, traders should verify its validity and utilize suitable stop loss and take profit orders.

It is advisable for traders to be cognizant of the pattern’s limitations and consider integrating it with other technical analysis techniques and indicators to improve its reliability.


ed seykota

If you would like to learn more about all the different candlestick patterns, also check out: “The Definitive Guide to Candlestick Patterns”

Thumbnail Morning Star Candlestick Pattern Trading Strategy Guide

Thumbnail Morning Star Candlestick Pattern Trading Strategy Guide


The morning star candlestick pattern is a bullish reversal pattern that appears after a downtrend in a financial security’s price.

It is characterized by a small real body, which suggests that there was little trading activity during the period, and a long lower shadow, which indicates that sellers tried to push the price lower but failed.

The pattern gets its name from the fact that it looks like a star rising in the morning sky.

The psychology behind the morning star pattern is that it shows a shift in sentiment from bearish to bullish.

During a downtrend, sellers are in control and are pushing the price lower.

However, when the morning star pattern appears, it indicates that the sellers are losing strength and that buyers are starting to take control.

This shift in sentiment can be caused by a variety of factors, such as a change in market conditions, the release of positive news, or the appearance of bullish technical indicators.

To use the morning star pattern for trading, it is important to confirm that it is indeed a valid pattern.

This means looking for the following characteristics:

  1. The morning star must appear after a downtrend.
  2. The lower shadow must be at least twice as long as the real body.
  3. The real body should be at the upper end of the trading range.

If these criteria are met, then the morning star pattern is considered valid and can be used as a signal to buy the security.

There are several trading strategies that can be used with the morning star pattern.

One strategy is to buy the security when the pattern appears and place a stop loss order just below the low of the morning star.

This will protect against any potential downside movement in the security’s price.

Another strategy is to wait for another bullish candlestick pattern to confirm the reversal, such as a bullish engulfing pattern or a piercing line.

When it comes to placing a take profit order, traders can use a variety of techniques.

One approach is to use a fixed take profit level, such as a specific price level or a percentage of the entry price.

Another approach is to use a trailing stop loss order, which allows the trader to lock in profits as the security’s price moves in the desired direction.

There are also some limitations to the morning star pattern that traders should be aware of.

One limitation is that the pattern is not always reliable, as there are times when the security’s price may continue to fall despite the appearance of a morning star.

Another limitation is that the pattern can be prone to false signals, especially in choppy or sideways markets.

To increase the reliability of the morning star pattern, traders can combine it with other technical analysis techniques and indicators.

For example, traders can look for the pattern to appear in conjunction with bullish divergence on a technical indicator such as the relative strength index (RSI).

They can also look for the pattern to appear at key support levels, such as a previous low or a trendline.

In conclusion, the morning star candlestick pattern is a bullish reversal pattern that can be used to trade the financial markets.

To use the pattern effectively, traders should confirm its validity and use appropriate stop loss and take profit orders.

However, traders should also be aware of the limitations of the pattern and consider combining it with other technical analysis techniques and indicators to increase its reliability.


ed seykota

If you would like to learn more about all the different candlestick patterns, also check out: “The Definitive Guide to Candlestick Patterns”