• Link to Facebook
  • Link to X
  • Link to Instagram
  • Link to Youtube
  • Link to LinkedIn
  • Link to Mail
Synapse Trading
  • Home
  • About
    • My Background
    • My Trading Journey
    • My Travel Log
    • Media & Interviews
  • Mentoring
    • Trading Mastery Program
    • Results & Testimonials
  • Signals
    • Telegram (Free to join!)
    • Daily Trading Signals
    • Daily Trading Signals (Results)
  • Resources
    • Free Trading Guides
    • Tools & Resources
    • Blog & Infographics
  • Contact
    • Contact Us
    • Partnership Opportunities
  • Click to open the search input field Click to open the search input field Search
  • Menu Menu
Spencer Li

Simple chart-reading can tell you all you need to know

Market Analysis

Leonardo Da Vinci once said that simplicity is the ultimate sophistication. Let’s take a moment to ponder that. This applies to research analysis as well. When you hear people talking about some sophisticated trading system or some flashy indicators or some complex wave projections, think again. It is more likely to be smoke and mirrors. All these tell you nothing new if you know how to read the bare charts. It’s as simple as that. Simple, and yet sophisticated. Looking back at my last few stock picks, I found that it is possible to read and understand what is happening on the charts. This makes it possible to pinpoint the low risk entry points, as seen in some of my previous posts.

https://synapsetrading.com/dbs-are-the-banks-leading-the-decline/
https://synapsetrading.com/noble-group-evening-star-signals-turn-to-the-downside/

Compare that with indicators. If you see a green arrow, do you know why it is a buy? Maybe it worked the past 3 times, but will it work this time? Maybe. Or maybe not. You won’t know. In fact, you won’t have any idea why there is a green arrow. You won’t know what is happening in the market. You won’t know what the smart money is doing. That is why chart-reading is an important skill everyone should master. Banks, funds and proprietary trading firms use it as their main tool. Maybe you should consider it too.

0 Comments/by Spencer Li
https://synapsetrading.com/wp-content/uploads/2019/10/logo.jpg 0 0 Spencer Li https://synapsetrading.com/wp-content/uploads/2019/10/logo.jpg Spencer Li2011-09-05 23:10:582021-08-20 10:44:23Simple chart-reading can tell you all you need to know
Spencer Li

Representativeness Bias – The Dangers of a Small Sample Size

Trading Psychology

In order to derive meaning from life experiences, people have developed an innate propensity for classifying objects and thoughts. When they confront a new phenomenon that is inconsistent with any of their preconstructed classifications, they subject it to those classifications anyway, relying on a rough best-fit approximation.


Representativeness Bias


There are two main types of representativeness bias, namely (i) base-rate neglect and (ii) sample-size neglect. We will focus on the latter, since it occurs more frequently in trading.

In sample-size neglect, traders, when judging the likelihood of a particular trade outcome, often fail to accurately consider the sample size of the data from which they base their judgments. They incorrectly assume that small sample sizes are representative of populations. This is also known as “the law of small numbers”.

This problem is observed when traders try to backtest systems by using small sample sizes of data, and extrapolate their favourable results. However, these results are most likely not representative of the effectiveness of the system. This is a common tactic applied in marketing gimmicks.

Another common phenomenon has to do with hot tips. For example, you might hear someone say “my broker gave me three great stock picks over the past month, and each stock is up by over 10%”. While this is enough to sway most people, thinking that the broker is a genius, this assessment is based on a very small sample size.

What is the best solution for this?

If you want to evaluate the effectiveness of system or the stock-picking skills of a person, make sure you do it over a large sample size, and count both the hits and misses. This will give you a more complete representation of reality.

0 Comments/by Spencer Li
https://synapsetrading.com/wp-content/uploads/2019/10/logo.jpg 0 0 Spencer Li https://synapsetrading.com/wp-content/uploads/2019/10/logo.jpg Spencer Li2011-07-14 02:59:192022-07-24 21:05:51Representativeness Bias – The Dangers of a Small Sample Size
Spencer Li

Cognitive Dissonance Bias – This Can’t Be True!

Trading Psychology

Cognitive Dissonance in Trading: Why You Refuse to Cut a Losing Trade

Last updated: 3 July 2026 · By Spencer Li, CFTe


Cognitive dissonance is the mental discomfort you feel when new information contradicts a position you already hold, and in trading it is the bias that keeps you in a losing trade long after you should have cut it. You buy a stock because you think the trend is up. The chart then prints evidence that the trend is down. Instead of acting on the new evidence, your mind goes to work defending the old decision, because admitting the trade was wrong feels worse than holding the loss. That is cognitive dissonance. It shows up in two forms: you start noticing only the data that supports your trade (selective perception), and you keep making choices that justify staying in it (selective decision making). The fix is not complicated, but it is uncomfortable: the moment you sense the discomfort, name it, look at the trade honestly, and if it is broken, close it. The discomfort is the signal, not the enemy.

Here is what the bias is, why it makes you hold losers, and the exact habit that beats it.

What is cognitive dissonance?

In psychology, a cognition is an attitude, an emotion, a belief, or a value. Cognitive dissonance is the state of imbalance that happens when two cognitions collide. When newly acquired information conflicts with what you already believe, you feel mental discomfort, and the term covers the whole scramble that follows as you try to harmonize the two and make the discomfort go away.

People go to great lengths to convince themselves the decision they already made was the right one, precisely to avoid the discomfort of having been wrong. Psychologists conclude that people perform far-reaching rationalizations to synchronize their cognitions and keep their psychological stability. In plain terms: it is easier to bend the story than to admit the mistake, so that is what the mind does by default.

How cognitive dissonance shows up in a trade

Take a simple example. You go long a stock because you read the trend as up. That is your cognition. Then a new signal appears that favours a downtrend. Now you have two cognitions that cannot both be true, and that imbalance is uncomfortable. Cognitive dissonance kicks in to relieve the discomfort, usually by whispering that maybe the new signal does not really count, or maybe the trend is just pausing, or maybe you were right all along.

You did not change your mind because the chart changed. You changed your reading of the chart to protect the position you already had. That is the trap.

The two kinds of cognitive dissonance bias

The bias splits into two sub-types, and it helps to be able to name which one is running on you in the moment.

Sub-typeWhat it doesWhat it sounds like in your headThe damage
Selective perceptionYou only register information that affirms the course you already chose“See, this one indicator still agrees with me.”You stop reading the market objectively and miss the signals that disagree
Selective decision makingYou rationalize new actions to justify sticking with the original course“I’ll just give it a bit more room, the stop was too tight anyway.”You resist cutting losses and invent excuses rather than admit the entry was wrong

Selective perception filters what you see. Selective decision making bends what you do. Most blown trades use both at once: you stop noticing the evidence against you, and you keep making little decisions that keep you in.

Why this is dangerous for traders

The danger is not subtle. A trader who is not bias-free cannot read the market objectively and cannot adapt fast enough when conditions change. The market does not care which side you took, but cognitive dissonance makes you care, and caring about being right is how you stop seeing what is actually happening.

The most expensive symptom is the resistance to cutting losses. Selective decision making is the machine that manufactures the excuses: the stop was unfair, the news was a one-off, it will come back tomorrow. Each excuse is the mind protecting itself from the discomfort of admitting the initial entry was wrong. The position keeps bleeding while the story keeps improving.

What is the best way to overcome cognitive dissonance in trading?

The key is to immediately admit that a faulty cognition has occurred, address the feeling of unease directly, and take rational action. If you think you have made a bad trading decision, analyse the decision. If the fears prove correct, confront the problem head-on and fix it. Do not negotiate with the discomfort. Use it.

Personally, I treat the unease as a tap on the shoulder rather than something to suppress. The moment a trade starts to feel uncomfortable, that feeling is usually a new cognition arriving before my conscious mind has caught up. The discipline is to stop, look, and ask one question: if I were flat right now, would I put this trade on at this price? If the answer is no, the only reason I am still in it is to avoid admitting I was wrong. That is not a reason to hold.

A few habits make this easier in practice:

  • Decide your exit before you enter, in writing. A pre-committed stop is a decision your unbiased self made for your biased self.
  • Treat being wrong as data, not as a verdict on you. A wrong trade is information about the market, nothing more. The faster you accept it, the faster you adapt.
  • When you catch yourself building an excuse, name it out loud as selective decision making. Naming the bias breaks its grip.

Where the human edge comes in

A screener will flag a broken setup the instant the chart turns against you. It will not feel the discomfort of being wrong, which means it will also not rationalize, hold, and hope. That part is yours. The edge is not in seeing the signal that contradicts your trade, software can do that. The edge is in acting on it before your mind has talked you out of it. That is psychology, the third of the Five Edges, and it is the one no tool can trade for you.

There is a 400-year-old version of this same advice. Shakespeare put it in the mouth of Polonius, advising his son Laertes in Hamlet:

This above all: to thine own self be true,
And it must follow, as the night the day,
Thou canst not then be false to any man.

In trading, being true to yourself means refusing to lie to yourself about a position. The market will tell you the truth. Your job is to listen before the bias edits it.

FAQ

What is cognitive dissonance in trading?
Cognitive dissonance in trading is the mental discomfort that arises when new market information contradicts a position you already hold, and the rationalizing you do to relieve that discomfort. It most often shows up as refusing to cut a losing trade because admitting the entry was wrong feels worse than holding the loss.

What are the two types of cognitive dissonance bias?
The two types are selective perception, where you only register information that confirms the course you already chose, and selective decision making, where you rationalize new actions to justify sticking with your original decision.

Why does cognitive dissonance make traders hold losing trades?
Because cutting the trade means admitting the original decision was wrong, which triggers discomfort. Selective decision making relieves that discomfort by generating excuses (the stop was too tight, the news was a fluke, it will recover), so the trader holds instead of acting on the evidence.

How do I overcome cognitive dissonance when trading?
Admit the faulty cognition the moment you notice the discomfort, analyse the trade honestly, and act on the conclusion. A practical test: if you were flat right now, would you take this trade at this price? If not, the only reason you are still in it is to avoid being wrong, and that is not a reason to hold.

Is cognitive dissonance the same as confirmation bias?
They are closely related but not identical. Confirmation bias is the tendency to seek out information that supports your view. Cognitive dissonance is the discomfort that drives that behaviour once contradictory information shows up, and selective perception is the part of it that overlaps most with confirmation bias.


So here is the honest question to sit with. The next time a trade turns against you and your mind starts building the case for holding, will you notice that you are doing it?

If you want the full set of biases and the routine that keeps them from running your account, read the pillar: The Trader’s Guide to Trading Psychology and Behavioral Finance.

Want the system that takes the emotion out of the exit? Grab the free 15-Minute Swing Trading Starter Kit. It’s the exact once-a-day routine I use to trade any market in 15 minutes, with the rules decided before the market can make me feel anything.


About the author. Spencer Li is the founder of Synapse Trading and a Certified Financial Technician (CFTe) with 15 years of trading across stocks, forex, crypto, commodities, and bonds. His trade log is public, 404 trades, losses left in. He teaches low-risk swing trading in 15 minutes a day, one system for any market.

Education, not financial advice. Synapse Trading is not licensed by MAS to advise on investment products. Trading carries risk of loss; past performance is not indicative of future results.


Related

The Trader’s Guide to Trading Psychology (pillar) · Confirmation bias in trading · Loss aversion and the disposition effect · How to cut losses and let winners run

2 Comments/by Spencer Li
https://synapsetrading.com/wp-content/uploads/2019/10/logo.jpg 0 0 Spencer Li https://synapsetrading.com/wp-content/uploads/2019/10/logo.jpg Spencer Li2011-06-18 16:02:472026-07-06 01:03:15Cognitive Dissonance Bias – This Can’t Be True!
Spencer Li

Market Seasonality and Patterns – When is the Best Month to Buy?

Market Analysis

One aspect of market analysis is statistical analysis, which is using statistics to find correlations and patterns, where opportunities of skewed probabilities may lurk, giving you an edge over the market in the long run. For investors, this lets you know the best month to start building your portfolio, or to rebalance/adjust your portfolio allocation.

Market Seasonality and Patterns - When is the Best Month to Buy?

Market Seasonality and Patterns – When is the Best Month to Buy?

Seasonality is a characteristic of a time series in which the data experiences regular and predictable changes which recur every calendar year. Any predictable change or pattern in a time series that recurs or repeats over a one-year period can be said to be seasonal.

This is different from cyclical effects, as seasonal cycles are contained within one calendar year, while cyclical effects (such as boosted sales due to low unemployment rates) can span time periods shorter or longer than one calendar year.

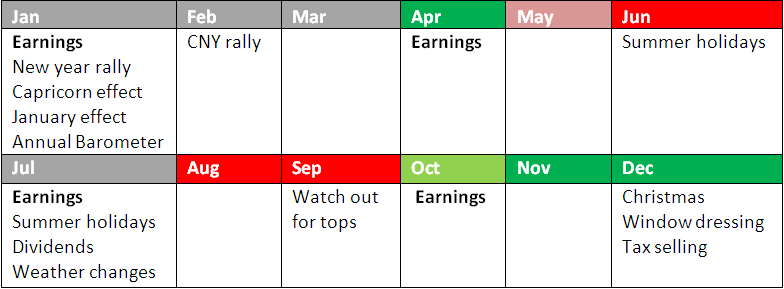
For the Singapore stock market, I have done a seasonality study, showing which months are more bullish and bearish. Contrary to popular belief, October is actually a rather bullish month. Every month has its unique characteristics, which skews the probability. As a trader,anything that tilts the probability in our favour is considered an edge.

Here are the results of my research:

Singapore stock market

Some key points to note: the best months for being LONG are April, November and December, while the best months for being SHORT are June, August and September.

There are many other patterns (some less obvious) which could have a significant impact on the stock market. Although your trading decisions should not be based solely on these, they can act as a powerful confirming indicator, or help you adjust your position-aggressiveness.

4 Comments/by Spencer Li
https://synapsetrading.com/wp-content/uploads/2019/10/logo.jpg 0 0 Spencer Li https://synapsetrading.com/wp-content/uploads/2019/10/logo.jpg Spencer Li2011-06-01 02:01:412020-02-10 12:01:37Market Seasonality and Patterns – When is the Best Month to Buy?
Spencer Li

Superior Long-term Investing: How to Catch the BIG Swings

Trading Tips

There is a general misconception that chart-reading and technical analysis are only for short-term traders, but this is not true. Investors who learn to read charts and adopt long-term trend-following techniques can achieve superior returns to a pure buy-and-hold investor with the added benefit of taking on less risk.


Superior Long-term Investing: How to Catch the BIG Swings

Superior Long-term Investing: How to Catch the BIG Swings


Why the traditional buy-and-hold strategy fails

A buy-and-hold strategy only works in a prolonged bull market, or if you are fortunate enough to buy in at the start of a short bull market. As long as people keep buying a particular stock, the stock price will continue to rise, thus buy-and-hold enthusiasts will sit through minor corrections or occasional bad news, because these small events do not affect the strong fundamentals of the company.

However, when the economy turns bad, and the stock market plunges, all stock prices will plunge together. A stock with stronger fundamentals may plunge to a lesser degree, but losing less money is not the same as making money.  In a prolonged bear market, the stock beomes cheaper and more under-valued as prices fall. Many investors go on a buying spree until they run out of capital, and become locked-in, waiting for prices to “revert to true value” while the market continues to fall. It could take years for them to breakeven, let alone profit.

In such scenarios, does it make sense to hold onto long-term investments for the next few years as losses accumulate, or to add more positions since stocks are now “cheaper”? Is there a better way to avoid this pain? This brings us to the new idea of trend-following investing.

Case Study of Buy-and-hold vs. Trend-following Investing

Let us examine the chart below. This is a weekly chart of the Straits Times Index, showing the period from 2003 to 2008. This is a hypothetical case study showing 2 investors – investor A and investor B.


Case Study of "Buy-and-hold" vs. "Trend-following"

Case Study of “Buy-and-hold” vs. “Trend-following”


Both investors managed to buy near the start of the bull market, near 2003. Investor A is die-hard Warren Buffett fan, adopting a pure buy-and-hold mentality, believing that “a good company is one that can be held forever.” Note that the Straits Times Index is made up of the 30 strongest blue-chips. Investor B is an investor who uses charts to time the big market trends, willing to take profits based on charts and turn short when the charts give a clear signal.

After 5 years, investor A finds that he has made a measly 10% return, having given back most of his profits while holding on though the decline. I did not include dividends here,because investor B would also have got those dividends, for the sake of fair comparison. Investor B, having locked in a 200% return (this is not picking the top, notice that he did not sell at the exact top), goes short and makes another 50% on the decline,raking in a grand total of 200%.

Since our goal in the market is to make money, it makes sense to adopt the approach that gives us the maximum returns within our time horizon and within our risk appetite. This means acquiring skills that give us an edge over the markets.

“I believe there are no good stocks or bad stocks; there are only money-making stocks.” – Jesse Livermore. Do you agree that for any stock, regardless of its fundamentals or value, if you buy and sell at the right time, you can make money from it?

1 Comment/by Spencer Li
https://synapsetrading.com/wp-content/uploads/2019/10/logo.jpg 0 0 Spencer Li https://synapsetrading.com/wp-content/uploads/2019/10/logo.jpg Spencer Li2011-05-25 16:10:202021-01-10 23:47:28Superior Long-term Investing: How to Catch the BIG Swings
Page 181 of 184«‹179180181182183›»

Free Trading Guides

Free Trading Guides

Blog Categories

  • Beginner's Guide
  • Blockchain & Crypto
  • Book Summaries
  • Candlestick Patterns
  • Economics & News Trading
  • Investing & Portfolio Management
  • Living Your Best Life
  • Market Analysis
  • News & Events
  • Price Chart Patterns
  • Promotions
  • Risk & Money Management
  • Stock Trading
  • Testimonials
  • Tools & Resources
  • Trading Psychology
  • Trading Strategies
  • Trading Tips
  • Travel & Lifestyle

Free Trading Guides

Free Trading Guides

Contact Us

Synapse Trading Pte Ltd
Registration No. 201316168H

Whatsapp: +65-8897-1204
Telegram: @iamrecneps
Email: info@synapsetrading.com

Links

Disclaimer
Privacy policy
Terms & Conditions
Contact us
Partnerships

© 2012-2024 Synapse Trading | All rights reserved | - powered by Enfold WordPress Theme
  • Link to Facebook
  • Link to X
  • Link to Instagram
  • Link to Youtube
  • Link to LinkedIn
  • Link to Mail
Scroll to top Scroll to top Scroll to top