

Long-Term Trend Following vs Buy-and-Hold: How Investors Can Catch the Big Swings
Want the daily routine? Get the free 15-Minute Swing Trader’s Checklist. Get it free →
By Spencer Li, CFTe · Last updated: 26 October 2026
Long-term trend following means using the chart to stay invested while a market is rising, and stepping aside when the trend clearly turns, instead of holding through every bear market. Chart reading is often treated as something only short-term traders do, but investors can use it too. The aim is to have a rule for getting out of the way of a long decline, which buy-and-hold does not give you. The price is a handful of false exits along the way, so the honest choice comes down to which kind of bad year you can live with.
Is chart reading only for short-term traders?
In my weekly outlook on 29 January 2026, I was talking about nuclear stocks, which I was starting to accumulate. They tend to move quite violently, so I gave viewers two ways to own them. If you want to hold them in your portfolio, I said, “you can just buy a small amount”, and “just buy and hold and don’t look at them” for the rest of the year. For trading, I would try to pinpoint the entry and exit points, and I admitted that “sometimes we end up round tripping”, which is trader slang for giving a whole gain back.
Long-Term Trend Following: How to Catch the Big Swings
So I run both. The interesting question is what an investor does when a whole market turns down for years, and that is where buy-and-hold starts to struggle.
Why does buy-and-hold break down in a long bear market?
Buy-and-hold works beautifully as long as people keep buying. Prices rise, and the holder sits calmly through small corrections and the odd bad headline, because none of that changes the strong fundamentals of the company.
The trouble starts when the economy turns and the whole market falls together. A stock with stronger fundamentals may fall less than the rest, but losing less money is a very different thing from making money.
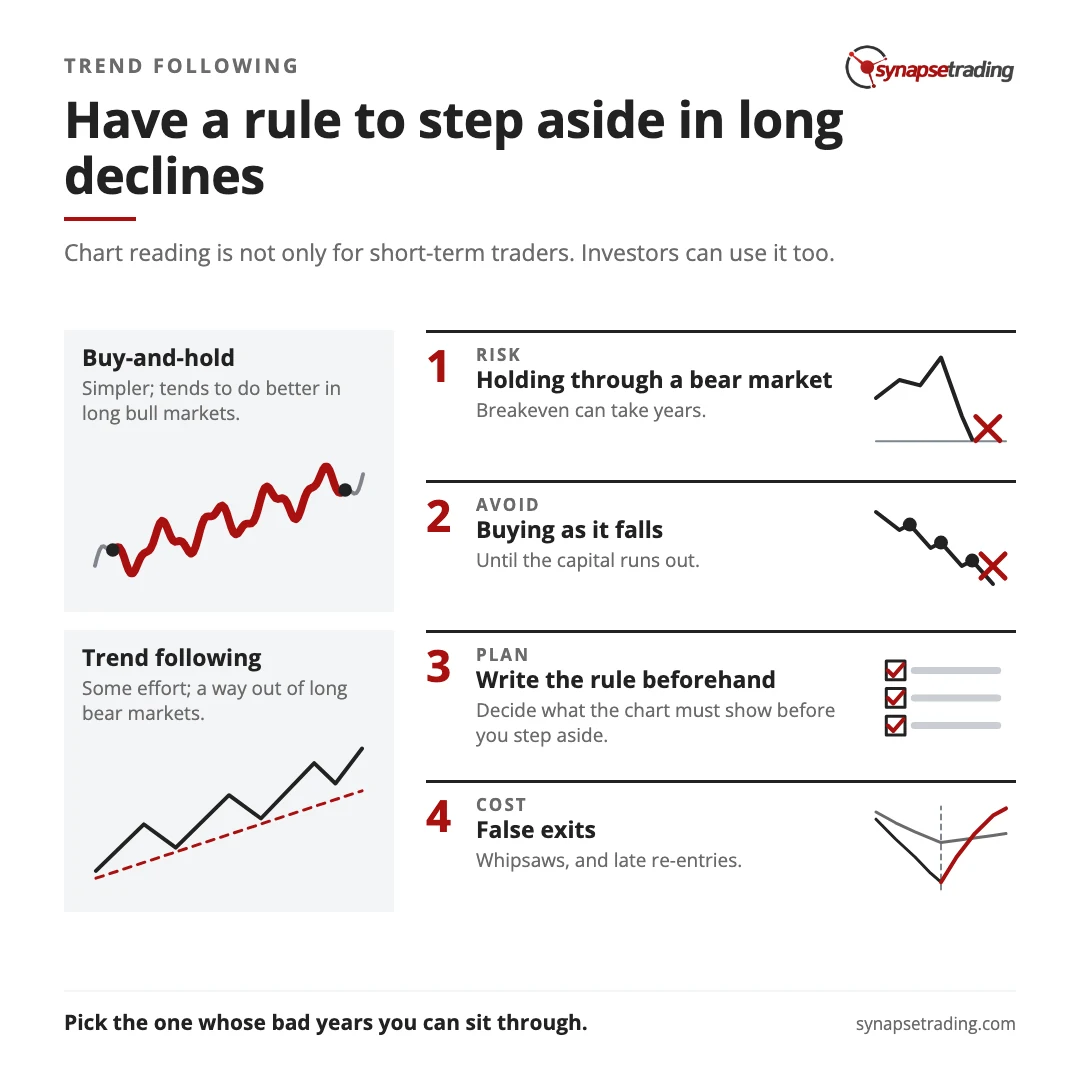
Then comes the trap. As prices fall, the stock looks cheaper and more “under-valued” the lower it goes. So many investors keep buying on the way down until they run out of capital, and then they are locked in, waiting for prices to “revert to true value” while the market keeps falling. It can take years to break even.
Psychology has a name for the feeling that keeps people there. Hersh Shefrin, in Beyond Greed and Fear, calls it “get-evenitis”. Investors keep score relative to the price they originally paid, so selling below that price feels like admitting defeat, and holding on feels like keeping hope alive. Behavioural finance calls the wider pattern the disposition effect, which is the habit of selling winners too soon and riding losers too long.
A trend-following investor tries to take that decision away from the moment of pain, by deciding in advance what the chart must show before they step aside. A rule like that is easier to keep inside a routine, and my free 15-minute swing trader checklist is the one I use myself.
What happened to two investors on the STI from 2003 to 2009?
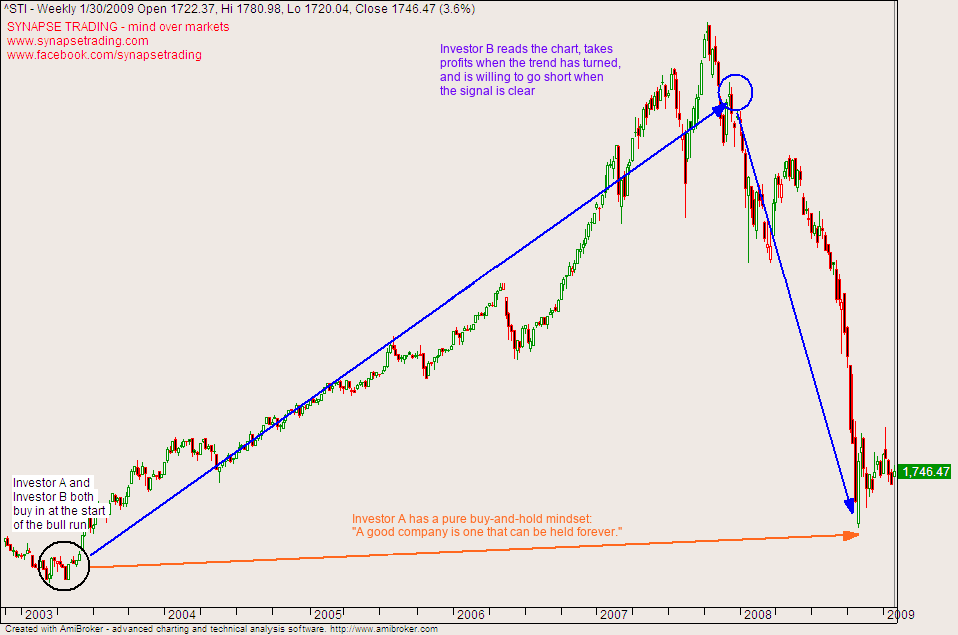
When I first wrote this post in 2011, I used a weekly chart of the Straits Times Index, Singapore’s benchmark index of its largest listed companies, to compare two investors. The case is hypothetical and drawn with hindsight, so treat it as an illustration rather than a result.
Case Study of “Buy-and-hold” vs. “Trend-following”
Both investors buy near the start of the 2003 bull market, at roughly the same price and with the same patience, and the only real difference between them is what they plan to do when the trend turns.
- Investor A is a die-hard Warren Buffett fan with a pure buy-and-hold mindset, who believes “a good company is one that can be held forever”.
- Investor B uses the chart to time the big trends, takes profits when the chart shows the trend has turned, and is willing to go short when the signal is clear.
I re-checked the index figures on 27 October 2026. Suppose Investor A bought at the very best price of 2003, the STI’s close of 1,213.82 on 10 March. By its peak close of 3,875.77 on 11 October 2007, the index was up about 219%. Then came 2008.
On 30 January 2009, the last week on the chart, the STI closed at 1,746.47.
In round numbers, S$10,000 put in at the March 2003 close had grown to about S$31,900 at the 2007 peak, and was back to about S$14,400 by the end of January 2009, before dividends. That is still a gain of about 44%. It is also roughly 80% of the paper profit handed back, after almost six years of patience. And the index had further to fall, closing at 1,456.95 on 9 March 2009, about 62% below its peak.
Investor B, as the circle on the chart shows, steps aside well below the top, and well above where the decline ended. I will not put a return on that, because any number would depend on exactly where you draw the exit with hindsight. The point the chart makes is simpler. One investor had a plan for getting out, and the other was relying on the market to come back.
What does a trend-following investor actually do?
The idea is old. You stay long while the trend is up, you step aside when the chart shows that the trend has turned, and some investors go short if the signal is strong enough. You are not trying to pick the exact top. You are trying to keep the large middle of a move, and to be out of the way when a market falls apart.
| Buy-and-hold | Long-term trend following | |
|---|---|---|
| Core belief | Hold a good company forever | Be in when the trend is up, out when it turns |
| In a long bull market | Works well, with no effort | Works well, with some effort |
| In a long bear market | Rides the whole decline | Steps aside on its rule |
| Main cost | Years of waiting to break even | False exits, and rebounds it misses |
| What it asks of you | Patience through pain | Following the rule when the news still feels fine |
The hard part is rarely spotting the turn. It is acting on it, because the exit signal tends to arrive while the headlines still say “buy the dip”. A rule written down beforehand, and a position small enough that one false signal does no real damage, matter at least as much as the chart. My guide to money and risk management goes into the sizing side, and the free 15-minute swing trader checklist is the daily routine I use to keep my own rules.
What does trend following cost you?
On 27 March 2025, a trader on Reddit’s r/investing posted the classic objection in one line: “Missing a few days in market can cost you everything”.
They have a point. I will concede it with dates. The best days often sit right next to the worst ones. On 24 March 2020, in the middle of the COVID panic, the S&P 500 rose 9.38% in a single day. Anyone who had stepped aside during the crash was not there for it.
The STI tells the same story from the other side. From its close of 1,456.95 on 9 March 2009, it climbed to 2,879.76 by 30 December 2009, almost double. A trend follower waits for the chart to show a new uptrend before buying back in, so they would have missed the first stretch of that rebound, and they would have felt rather silly watching it.
So trend following loses some years. In a long, uninterrupted bull market, buy-and-hold usually does better, because it never pays for a false exit. What trend following buys you is a way out of a long bear market, and it pays for that with whipsaws and late re-entries.
That makes the useful question about you more than about the method. Pick the one whose bad years you can sit through without breaking your own rules.
Are there really no good stocks?
Jesse Livermore, the famous speculator of the early 1900s, rejected buy-and-hold outright. As his biographer Richard Smitten records it in Trade Like Jesse Livermore, Livermore’s view was that there are no good stocks, only stocks that make you money.
To Livermore, holding a stock blindly because it was a great company in a healthy economy was asking for trouble. The conditions that made you buy can change, and the market tends to price that change long before the news reaches you.
A long-term investor can push back, and many do. Some businesses really do compound for decades, and the cheapest way to own them is to buy and leave them alone. But even that investor has to decide what they will do if the whole market halves, and deciding it in advance is the part trend following gets right.
FAQ
What is long-term trend following?
It is using the chart to stay invested while a market trends up and to step aside when the trend clearly turns, rather than holding through every bear market.
Is trend following better than buy-and-hold?
Neither wins every time. Buy-and-hold is simpler and tends to do better in long bull markets. Trend following costs some false exits in exchange for a way out of long declines.
Is technical analysis only for short-term traders?
No. The same chart-reading skill works on a weekly chart for an investor, to judge whether the big trend is still intact.
Does trend following mean picking the top?
No. The aim is to keep most of a move and to be out before a major decline. Exits usually come well below the top.
Can trend following lose money?
Yes. False signals can take you out of a market that then recovers, and you may buy back in at a higher price. Position size and a written rule matter as much as the chart.
Which camp are you in, and has a bear market ever tested your patience more than you expected? Let me know in the comments.
If you want the price action skills behind reading a trend, start with why professional traders use price action. Trend following on a shorter clock is the Swing type in my 4 types of trading strategies, and my free trading guides collect the rest.
And if you want a daily routine that takes about 15 minutes, grab the free 15-minute swing trader checklist.
About the author. Spencer Li is The 15-Minute Trader and the founder of Synapse Trading. He is a Certified Financial Technician (CFTe) with 15+ years of trading, run from 70+ countries. He holds a B.Acc and B.BM from SMU. Every trade he takes is public, dated, losses left in. He teaches rules-based swing trading in 15 minutes a day, one system for any market.
Education, not financial advice. Synapse Trading is not licensed by MAS to advise on investment products. Trading carries risk of loss, and past performance is not indicative of future results.
Want the daily routine? Enter your email for the free 15-Minute Swing Trader's Checklist.
Free 5-page PDF, then occasional trading emails. Education only, not financial advice. Unsubscribe anytime. Kit stores your email in the US: see our privacy policy.
Want to learn the full method? The Trading Mastery Program teaches the 4 strategies I have traded since 2011. It suits beginners and experienced traders.
Rather follow the trades as they happen? Daily Trading Signals is our Telegram channel: my trade ideas with entry, stop and exit, and every trade is public.
Questions about this post? Ask in the free Telegram channel →
Educational content only, not personalised financial advice. Trading carries risk, including loss of capital. Past performance is not indicative of future results. Synapse Trading is not licensed or regulated by MAS.


Great article