Tag Archive for: stock market

crypto updates profits

In the most recent FOMC meeting, the Fed held rates unchanged, which was no surprise, and it meant that this liquidity-driven long-term bull market in stocks and crypto will continue running.

Stocks and crypto are actually pretty correlated, and the biggest danger to the uptrend is if yields start rising.

In this post, I’m going to do an overview of the stock and crypto market, as well as review some of our recent trades.


Covid updates

Before we go into the markets, let’s take a quick look at the Covid situation, with a focus on vaccination.

vaccinations

As you can see from this chart, vaccination rollout globally is progressing slowly, with less than 10% of the world population having at least one vaccine dose.

In addition, numerous variants have been detected globally, such as Britain’s B117 strain, Brazilian P1 variant, South Africa’s B1351 and India’s “double-mutant” variant called B1617.

This does not bode well, and we can see a large disparity between the richer and less affluent countries.

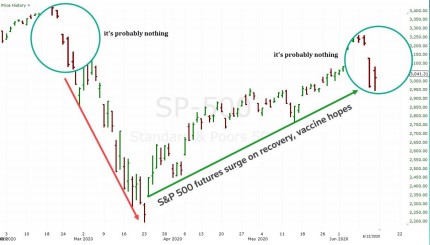
Nevertheless, the financial markets seem to disjointed from the real world, as asset prices continue to climb.


Earnings & Employment (NFP)

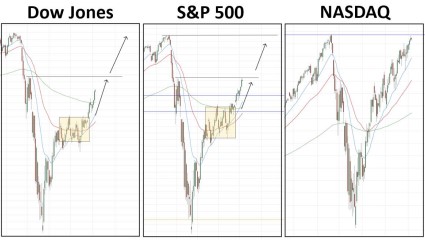
If we look at the daily trends, the crypto market, stock market, and even the oil market are all in a strong bull trend.

vaccinations


And with the recent earnings season, a record 87% of S&P 500 companies have beat earnings estimates, and earnings look to be growing by more than 46%, according to Refinitiv.

Credit Suisse’s chief U.S. equity strategist, Jonathan Golub, has raised his forecast for the S&P 500 based on strong earnings.

He wrote, “we are raising our 2021 S&P 500 price target to 4600 from 4300, representing 9.2% upside from current levels, and 22.5% for the year.”


market-news

This coming week, we will also see the data from the NFP (non-farm payrolls), which will tell us how good the job market is amidst the US recovery from Covid.


Stock Market Targets Hit

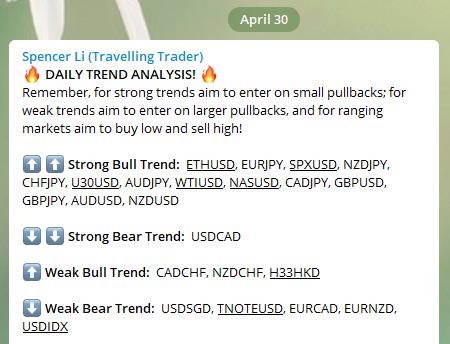
In my previous market analysis posts, I predicted the breakout of the S&P 500 with the first target of around 4120 and the second target of 4215.

market-news

On 13 April 2021, it hit the first target of 4120, and in the Telegram screenshot above, I said that it would continue to the next price target of 4215.


SP-500


Just a few days ago, we saw that exact target being hit. Congrats! ???


Bitcoin: 24% profit in 7 days!

Bitcoin was very exciting because we traded it downwards, and then upwards, and both trades were very proftable!

bitcoin-btcusd

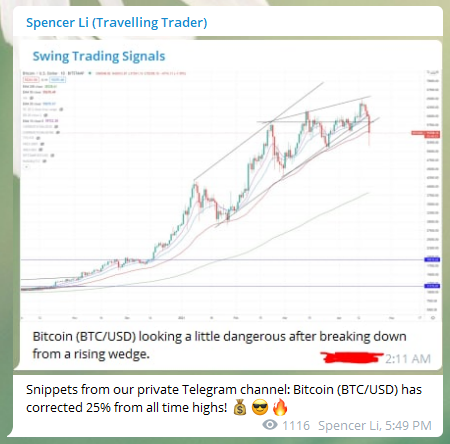
We spotted this rising wedge in Bitcoin, which was bearish, so we took a short position, and from here we saw a 25% correction from its all-time highs.


bitcoin-btcusd1

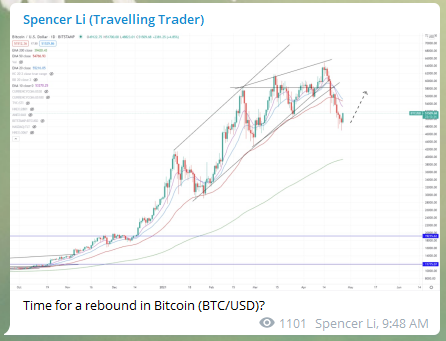
Following that, I pinpointed a rebound for Bitcoin, with uncanny precision.


bitcoin-btcusd3

Within just 2 days, we saw a sharp rebound of 17% from the lows, but we were still not done.


bitcoin-btcusd4

Finally, after 7 days, we took profit at the resistance level, netting a 24% profit in 7 days. Ka-ching! ???


Dogecoin: 38% profit in 5 days!

Dogecoin admittedly was a more volatile creature, so we had to be more careful in finding trading opportunities for this.


bitcoin-btcusd

Finally, we spotted a huge pin bar (bullish hammer candle), and this was the perfect opportunity for a long trade.


bitcoin-btcusd

From there, it went up 38% in the next 5 days, and it still looks like it can continue going up, so we are still holding on to this. ??


Ethereum: 50% Profit in 13 days!

I mentioned in my previous market analysis post that Ethereum is even more bullish than Bitcoin based on the chart, and now you can see why.


bitcoin-btcusd37

In just 13 days after hitting the support level (great place to buy), we netted a profit of 50%, and the price still looks to be heading higher.

At this point, I won’t be too greedy and will take most profits and wait for the next pullback to enter again.


bitcoin-btcusd121

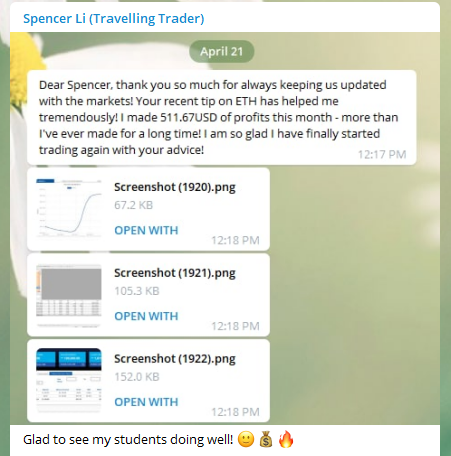
Here’s some feedback from one of my new students, and I’m glad to see they are profiting from the Crypto bull run as well.


I have come to the end of this market analysis.

Now that I have shared my views on the various markets, do you think the markets will continue going up, or will it be a case of “sell in May and go away”?

Let me know in the comments below!

draft 2 market analysis what to buy now e1618222224862


As countries around the world roll out their vaccine plans, we can see different industries and different countries recovering at different rates.

However, only a small percentage (about 5%) of the global population is vaccinated, so it might take a while before we start to see the results of the vaccines kick in to reduce new Covid cases.

Stock Market Surges As Predicted

Stock Market Surges As Predicted 2

If you look at the graph of new cases, it is still on the rise.

Given such a scenario, how does this affect the financial markets, and what are some of the investment opportunities we can look at?


Stock Market Surge

On 31 March 2021, I shared this important snippet in the public Telegram channel, because I felt that S&P 500 was going to have a breakout.


Stock Market Surge

“Following up on the S&P 500, it is still within the range, but now the odds are much higher that it will continue going higher.

If I had to guess, I would estimate 70% bullish and 30% bearish.

This means it’s a good low-risk opportunity to add long positions, with a SL just below the recent swing low (around 3840).

Shared this with my students a few days ago, will tonight be the night the S&P 500 makes a new high?”


That very night, stocks broke to a new high, and has been steadily heading up for the past 1-2 weeks.


Stock Market Surge 2

“Following up on our last post, the market is surging up as predicted. Congrats to those who followed! ???


As of Friday last night (9 April 2021), the S&P 500 has hit our first price target of 4125, giving us close to 4% gain so far.


Stock Market Surge 3


We have taken half profits, and there might be small pullback where we can add positions before gunning for the next price target.


Not Much Upside for Oil Markets

On 27 March 2021, I shared a chart on the long-term outlook of the Crude Oil market, and I felt that that most of the post-Covid recovery has been priced into oil, and since it won’t be going up much, I suggested taking a long-term short position on it.

Upside for Oil Markets

“Looking at the long-term chart of Crude Oil, we saw it bottom around April last year, before recovering all the way to previous highs in a 2-legged move.

Something interesting to note is that the 2 legs of the 2-legged move are exactly the same length.

Now that it has reached the pre-Covid highs, I do not see much more upside for Crude Oil.”


Upside for Oil Markets 2

“Following up on Crude Oil, it has started turning down as predicted. Possible short entry for the next leg down.”

Since then, prices have started to turn down a little, and I will continue to hold my short positions for another possible leg of price movement downwards.


Will USD Become Bullish?

On 27 March 2021, I noticed that the USD was picking up strength, which was surprising, considering how much money the US has been printing.

My guess is that currently, the US is recovering faster from Covid as compared to many of the less developed countries.


USD Become Bullish

“Looking at the US Dollar Index (DXY), it seems like after a multi-year downtrend, the USD is picking up strength.

It has broke the long-term bearish trendline, formed a small double bottom, and is now challenging the 200-EMA.”


USD Become Bullish 2

Looking at the larger chart of the US Dollar Index (DXY), you can see that price has formed a double bottom, however the size of this pattern is not that convincing since it is comparatively small.

Price is now fighting in the middle of the EMAs, and we will need to see if it can emerge victorious and stay above all the EMAs.


Relative Strength of Forex Pairs

Let’s take a look at the other currencies and their relative strength.

Strength of Forex Pairs 2This shows the current ranking of different currencies, from strongest to weakest.


Strength of Forex Pairs 2

“Stocks continue to surge as predicted, and because the JPY is weakening, all pairs of /JPY are very bullish too.”

This shows the trends of the different currency pairs, stocks indices, commodities and bonds.

From these 2 tables, we can see that JPY & GPY are bearish, while USD & CHF are bullish.


Crypto: Bitcoin & Ethereum

Cryptocurrencies are really heating up right now, and I’ll be focusing on the 2 major ones – Bitcoin (BTC/USD) and Ethereum (ETH/USD).


Bitcoin & Ethereum

Looking at the chart of Bitcoin (BTC/USD), it is still staying nicely within the uptrend channel, with a nice ascending triangle building up for more bullish pressure.

It is very likely that it will break new highs this weekend.


Bitcoin & Ethereum 2

Looking at the chart of Ethereum (ETH/USD), it is possibly even more bullish than Bitcoin, after a breakout of a ascending triangle, a pullback to test the breakout, which also formed a bull flag.

That is already a confluence of 3 bullish factors.

Needless to say, I will be holding on to this as well.


Market Summary

In this post, I have covered many markets, and the key things to note are:

  • Bullishness of the stock market
  • Long-term bearishness of Crude Oil
  • Potential bullish reversal of the USD
  • Bearishness of JPY & GPY
  • Bullishness of USD & CHF
  • Bullishness of cryptocurrencies

Now that I have shared my views on the various markets, what do you think is the best investment at this point of time?

Let me know in the comments below!

is the market heading for a correction thumbnail

After the sharp run-up in stocks from last year’s March lows, some people are starting to wonder if the market has got a bit too bubbly.

In this post, we will compare the different stock indices, as well as some other products, to see if there are any good opportunities.


The Meteoric Rise of Bitcoin

Meteoric Rise of Bitcoin

When placed on the same scale, the epic 700+% returns on Bitcoin (BTC/USD) dwarfs everything else, and has also provided some of the best returns for my portfolio last year.

Looking at its strong trend, it does look like there are a few more legs for it to go, so I will hold onto it for now.

To see the rest of the products, I will now remove Bitcoin from this comparison.


Overview of Various Markets


Overview of Various Markets


The top 3 you see are the 3 indices of the US stock market, and the one in candles is the S&P 500. The other 2 are the Dow Jones Index and the NASDAQ.

The Nasdaq had the sharpest recovery at the start, but the other 2 recently caught up, especially in the last few weeks where the NASDAQ corrected sharply.

So in terms of percentage recovery, all 3 indices are roughly at the same level.

Next if we look at the line in dark purple (2801), which is one of the China Stock ETFs which I invest in, it had a good run, and just earlier this year it was on par with the NASDAQ.

However, in recent weeks, it has corrected sharply and is now below the 3 US stock indices.

The STI Index (Singapore market) was pretty much lackluster last year, but has picked up in recent months, making it one of the top performing stock markets this year.

The last line on the chart is Gold (one of the Gold ETFs to be specific), and it seemed to have hit its recent peak in August last year.


Will Rising Rates Kill the Stock Market?


Kill the Stock Market


Historically, rising yields have led to recessions, but the lag time could be years, so it’s not like we won’t be able to see it coming as it happens.


Kill the Stock Market 2

Kill the Stock Market 3


Looking at the charts of bond prices (which are an inverse of interest rates), we can see that it peaked around the same time the stock market bottomed (March 2020), and in recent weeks has been dropping faster.

This in itself it not necessarily a bearish indication for stocks, because it is more of a sign of potential rising inflation, but as long as inflation remains low, then it may not necessarily be bad for stock prices.

Which means the best way is still to check out the charts of the stock indices.


Chart Analysis of S&P 500


Chart Analysis of S&P 500

Chart Analysis of S&P 500 2

In summary, the stock indices are currently trading within a sideways range after a long run-up, so it won’t be surprising if there is some medium-term correction before the trend continues.

Stay tuned for more real-time market updates in our Telegram channel:
?? https://t.me/synapsetrading

market analysis pic 1

As various countries open their economies, notably China and the US, will it lead to a surge in new cases, and will it lead to further shutdowns?

And will the stock market be able to break new highs, or has it hit a major roadblock?

Join our FREE Telegram channel for daily trading tips:
?? https://t.me/synapsetrading

Major Events

There were some major news last week, such as the negative Fed forecast, which caused a huge dip in the stock market.

Daily new coronavirus cases continue to climb globally, with new spikes in the US and fresh outbreak clusters in China.

Major EventsMajor Events 2

Major Events 3 Major Events 4 Major Events 5


Stock Markets

The stock market seems to have hit a roadblock, and is taking a pause while deciding which way to head next.

I highlighted the crucial levels to look for on the S&P 500.

Tech stocks are still going strong, and the big tech giants are breaking new highs.

Stock Markets

Stock Markets 2Stock Markets 3

Stock Markets 4

Stock Markets 5

Trade Highlights

Here are some snippets from the daily trades in our private Telegram chat group for graduates of the “Trading Mastery Program”.

Trade Highlights

Trade Highlights 2

Trade Highlights 3

If you are interested to join our closely-knit community and start profiting daily from the market, click here: https://synapsetrading.com/the-synapse-program/

To read feedback form all our past students, click here: https://synapsetrading.com/testimonials/

See you on the inside! ?

market analysis pic 2

By this time, most people are also starting to believe in the V-shape recovery, and the Nasdaq has already fully recovered from the crisis, surpassing its highs before the Covid crash.

Will the tech stocks be able to lift the rest of the market to new highs, or will the general market drag down the tech giants as the reality of the economy kicks in?

Join our FREE Telegram channel for daily trading tips:
?? https://t.me/synapsetrading

Market Overview

Is the V Shape Recovery for Real

Last month, the USD was very strong, while the AUD was one of the weakest, however this month we have started to see a twist of events, where the AUDCAD is in a strong bull, while the USD/CHF is in a strong bear.

Gold has declined slightly, putting it in weak bear territory.

Nasdaq (NASUSD) remains the strongest stock market, whereas Hang Seng (H33HKD) remains the weakest.

Major Events

The biggest news of the week is probably the awesome jobs data from the US, although there was some classification error.

Is the V Shape Recovery for Real 2

Is the V Shape Recovery for Real 3


Stock Markets

The stock markets continued to rise, and as I posted in the case study below, since the tech stocks have gone up so much relative to the rest of the market, I was expecting the rest of the market to play catch up, and on Friday we saw the Dow Jones & S&P 500 outperforming the Nasdaq as anticipated.

Is the V Shape Recovery for Real 4Is the V Shape Recovery for Real 5

Is the V Shape Recovery for Real 6

Is the V Shape Recovery for Real 7


Trade Highlights

Here are some highlights and case studies of trades done on forex, commodities and CFD products, also taken from our private forum.

See more case studies: https://synapsetrading.com/trading-guides/case-studies/


The first is a trade we did on the USD/CAD, as it broke down from a descending triangle.

Is the V Shape Recovery for Real 8

Is the V Shape Recovery for Real 9

Is the V Shape Recovery for Real 10


Next, we also had a good run on Crude Oil, riding on the surge in prices as economies reopened.

Is the V Shape Recovery for Real 11

Is the V Shape Recovery for Real 12


Trading Insights

Is the V Shape Recovery for Real 13

Is the V Shape Recovery for Real 14


Join our Last & Final Skillsfuture Workshop!

2 weekends ago, we conducted another full-house Skillsfuture workshop, with 40 pax of new traders & investors, as well as some of my past students who sat in to help out.

So far, every intake has been a full house, which is why we expanded to 3 workshops instead of 1 originally planned, because of the overflow. But our license expires on 18 June, so this is the last and final workshop which we can hold.

This fully subsidised Skillsfuture workshop will give you the skills and roadmap to build a second source of income to plan for early financial freedom, by building an all-weather portfolio that can perform well in any market conditions, and also market timing skills to create additional cashflow from short/medium-term trades.

Date: 13 & 14 June 2020 (6pm to 10pm)

Click here to check availability:
https://wp.me/P1riws-8OX

? First-come, first-serve!
? See you soon! ?

Is the V Shape Recovery for Real 15 Is the V Shape Recovery for Real 16