• Link to Facebook
  • Link to X
  • Link to Instagram
  • Link to Youtube
  • Link to LinkedIn
  • Link to Mail
Synapse Trading
  • Home
  • About
    • My Background
    • My Trading Journey
    • My Travel Log
    • Media & Interviews
  • Mentoring
    • Trading Mastery Program
    • Results & Testimonials
  • Signals
    • Telegram (Free to join!)
    • Daily Trading Signals
    • Daily Trading Signals (Results)
  • Resources
    • Free Trading Guides
    • Tools & Resources
    • Blog & Infographics
  • Contact
    • Contact Us
    • Partnership Opportunities
  • Click to open the search input field Click to open the search input field Search
  • Menu Menu

Tag Archive for: stock market

Spencer Li

How to Profit from a Stock Market Crash (Panic Sell or Buy the Dip?)

Investing & Portfolio Management
profit from market crash

What Should You Do in a Stock Market Crash?

Last updated: 3 July 2026 · By Spencer Li, CFTe


In a stock market crash, the best thing most people can do is follow a plan they wrote before the crash, not react to the one happening in front of them. Modern corrections are sharp and vicious, partly because so much volume now comes from momentum-based algorithms that all sell in the same direction at once. That speed is exactly why panic decisions go wrong. So the answer is not a clever trade. It is three calm steps: protect what you have first (cut risk, raise cash, respect your stops), then wait for the selling to exhaust itself instead of catching the falling knife, then scale in slowly once price stabilises rather than going all-in on day one. A crash is one of the few moments where good assets go on sale, but only the prepared trader gets to treat it as an opportunity. Everyone else is busy being shell-shocked.

Here is how to think about it, step by step.

Why do market crashes feel so fast and brutal now?

Years ago a correction could grind lower over weeks. Today a lot of the market is traded by momentum-based algorithms (automated systems that buy strength and sell weakness). When price breaks, these systems all lean the same way at the same time, so selling feeds on selling. The move that used to take a month can happen in a few days.

This matters for you in one practical way: there is far less time to think mid-crash than there used to be. If your plan only exists in your head, the move will be over before you have finished deciding. Hence, the real work happens before the crash, not during it.

What is the best strategy in a falling market?

Personally, I split it into three jobs, in order. Defence first, patience second, offence last.

StepWhat you doWhy it mattersCommon mistake
1. ProtectCut risk, raise cash, honour your stopsYou cannot buy the bottom if you are wiped out before itAveraging down into a position that keeps falling
2. WaitLet the selling exhaust itself before actingSharp crashes overshoot, then snap backCatching the falling knife on day one
3. Scale inAdd slowly as price stabilises, not all at onceA crash puts good assets on sale, but the bottom is only clear laterGoing all-in too early, with nothing left to add

Notice that two of the three steps are about not acting. That is deliberate. In a fast market the trader who does less, but does it on purpose, usually beats the one who is reacting to every red candle.

Do note that, this is a framework, not a signal. The specific levels, stops, and sizing depend on your system and your timeframe. The point is to have those rules written down before you need them.

How do you turn a crash into an opportunity?

A crash is the rare moment when quality goes on discount. The catch is that “cheap” can always get cheaper, so opportunity only exists if you have kept the means to act: cash in reserve, a clear shopping list, and the patience to buy in stages instead of betting everything on calling the exact low.

So the opportunity is real, but it belongs to the prepared. If you spent the whole drop fully invested and frozen, there is nothing to take advantage of with. That is the quiet difference between traders who dread crashes and traders who wait for them.

Where the human edge comes in

An algorithm can sell faster than you, and in a crash it will. It is not trying to outrun the machines on speed. The edge is judgment and discipline: deciding in advance how much risk you will carry, sitting on your hands while the knife falls, and scaling in on a plan instead of on adrenaline. The machine supplies the panic. You supply the patience. That is the first of the Five Edges, and it is the part no system can trade for you.

FAQ

What should you do during a stock market crash?
Protect your capital first (cut risk, raise cash, honour your stops), wait for the selling to exhaust itself rather than buying on the first big down day, then scale in slowly as price stabilises. Decide these rules before the crash, because modern corrections move too fast to plan mid-drop.

Why are stock market crashes so sharp these days?
A large share of volume is driven by momentum-based algorithms that all sell weakness at the same time. That clustering makes corrections faster and more violent than older, slower sell-offs.

Should you buy during a crash?
A crash can put good assets on sale, but only if you have kept cash in reserve and buy in stages instead of going all-in at once. “Cheap” can get cheaper, so scaling in beats trying to pick the exact bottom.

Should you sell everything when the market crashes?
Panic-selling the whole portfolio at the lows is usually the costliest move. A planned approach, trimming risk on the way in and keeping rules-based stops, tends to beat an all-or-nothing reaction.


That is the short version: in a crash, the plan you wrote in calm beats any move you invent in panic. Which of the three steps is weakest for you right now?

For the full routine behind this, read the pillar: The Definitive Guide to Swing Trading.

Want a plan ready before the next drop? Grab the free 15-Minute Swing Trading Starter Kit. It is the exact routine I use to scan once a day and trade any market in 15 minutes, crash or calm.


About the author. Spencer Li is the founder of Synapse Trading and a Certified Financial Technician (CFTe) with 15 years of trading across stocks, forex, crypto, commodities, and bonds. His trade log is public, 404 trades, losses left in. He teaches low-risk swing trading in 15 minutes a day, one system for any market.

Education, not financial advice. Synapse Trading is not licensed by MAS to advise on investment products. Trading carries risk of loss; past performance is not indicative of future results.


Related

Definitive Guide to Swing Trading (pillar) · How to manage risk in trading · Trading psychology and discipline

0 Comments/by Spencer Li
https://synapsetrading.com/wp-content/uploads/2020/02/profit-from-market-crash.png 522 1012 Spencer Li https://synapsetrading.com/wp-content/uploads/2019/10/logo.jpg Spencer Li2020-02-28 21:14:532026-07-06 03:04:32How to Profit from a Stock Market Crash (Panic Sell or Buy the Dip?)
Spencer Li

How I Screwed up my Tesla Stock Trade (And Made More than 100% Returns)

Trading Tips
tesla stock trade review

From 2017 to 2019, Tesla was trading between the range of $180 to $400.

All that changed when it broke above $400, then went to $500, then $600, then $700, then $800, then $900, all within the span of a few weeks. Will it hit $1000 next?

In this video, I explain my reasons for buying Tesla stock, how I screwed up the trade, and how you can tackle parabolic charts such as this.

Enjoy the video, and remember to “like” and “subscribe”!

0 Comments/by Spencer Li
https://synapsetrading.com/wp-content/uploads/2020/02/tesla-stock-trade-review.png 522 1012 Spencer Li https://synapsetrading.com/wp-content/uploads/2019/10/logo.jpg Spencer Li2020-02-23 07:39:352022-12-21 03:16:25How I Screwed up my Tesla Stock Trade (And Made More than 100% Returns)
Spencer Li

Will the Stock Market Crash or Continue Going Up for Another 10 Years?

Market Analysis
stock market crash

Since the crash of 2008, and the recovery which started in 2009, the stock markets (especially the US markets), have been on a steady uptrend.

Stock Market CrashChart: S&P 500 index (weekly chart)

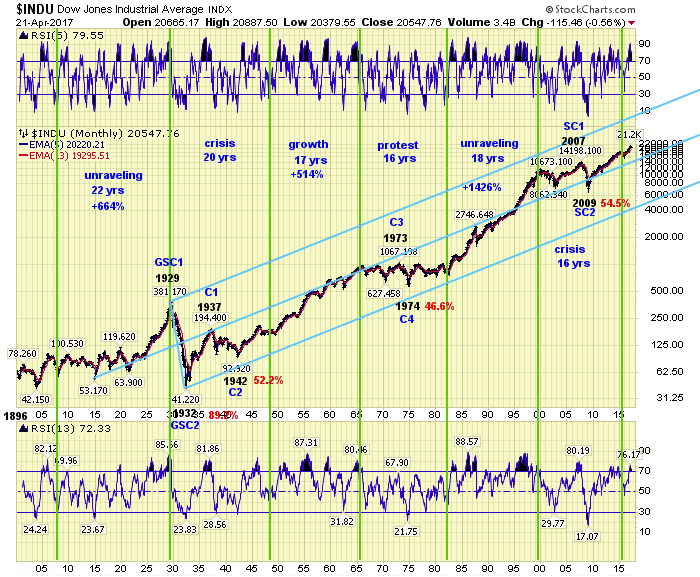
Many of us have heard about the 10 year cycle, where the market is supposed to crash once every 10 years, for example the Asian markets during the 1997 currency crisis, and the global markets in 2007 during the subprime crisis.

However, in 2017, we did not see any significant crash or correction, which have led many analysts to rethink the theory.

So, in 2019-2020, should we be expecting a delayed crash, or are we experiencing a structural change in the markets?

Stock Market Crash 2

If we observe the supercycles of major human technological innovations, we see that each major wave of progress is driven by a major technological innovation, such as the steam engine in the 1700’s or the internet and IT advancements in the 1900’s.

And based on the cycles, we could be in the early stages of the 6th wave, which is going to be driven by the upcoming huge advancements in applications of big data, artificial intelligence, virtual reality, augmented reality, internet of things, and blockchain technology.

Stock Market Crash 3Source: The Market Oracle

This means that we could be on the cusp of a super bull market, if these technological advancements are able to create a quantum leap in productivity for businesses and a huge jump in the standards of living across the globe. All these would translate into stronger stock prices, which instead of crashing the market, would propel it to new heights.

However, there are also major concerns:

  • Unequal gains across companies: the major tech companies may soon dominate all industries via the application of new technologies.
  • High unemployment: If machines take all the jobs, what are humans going to do?
  • High debt and leverage of US and European economies
  • Political risks: clash of superpowers (US and China)

In summary, many retail investors are wary of entering the stock market now because it is at all time highs and has already “gone up a lot” since 2009, hence they are waiting for a “big crash” before going in.

However, this big crash may not come if successful widespread application of new technologies and innovation are able to drive a quantum leap in productivity.

0 Comments/by Spencer Li
https://synapsetrading.com/wp-content/uploads/2018/05/stock-market-crash.jpg 667 1000 Spencer Li https://synapsetrading.com/wp-content/uploads/2019/10/logo.jpg Spencer Li2018-05-20 18:36:452022-03-07 16:19:54Will the Stock Market Crash or Continue Going Up for Another 10 Years?
Spencer Li

The January Barometer: An Accurate Predictor of Stocks for 2017?

Investing & Portfolio Management
1 5

There are many speculations about leading indicators in the market, and one of the most popular ones is the January Barometer. In this post, we will explore this phenomenon, and see if it holds up to the test, and whether it will provide any useful insights going forward.

WHAT IS THE JANUARY BAROMETER?

“As January goes, so will the market go for the year.” – Wall Street Folklore

The January barometer is a tool used to determine if the year will be bullish on the equity space. If January sees a winning month, the year would be a winning year.

January can be said to be an indicator to whether the year would be bullish or not.

This idea first emerged in the 1972 edition of Yale Hirsch’s Stock Trader’s Almanac. Here’s what was published:

“We doubt that any technique or indicator ever devised has been so remarkably accurate as the January Barometer. The barometer, which indicates that as January goes, so will the market go for the total year, has proven correct in 20 of the last 24 years…. Very few stock market indicators show such an 83.3 percent accuracy for even short spans of time.”


https://www.instagram.com/p/BPuVVnxj8Yt/?taken-by=iamrecneps


PREVIOUSLY… INVESTIGATING THE SANTA CLAUS RALLY

A couple of months back, I collected statistics for a simple ‘buy in January, sell in February’ portfolio. How it works is simple: I would purchase the stock index on 1 January, and sell it on 1 February and see the results.

Buy in January, Sell in February Statistics

2011: 4.34%

2012: 1.28%

2013: 4.55%

2014: 5.62%

2015: -0.08% — Total returns for 5 years = +15.71%!!!

Over the last 5 years, it has indeed been a great run for the ‘buy in January, sell in February’ portfolio.

This got me excited, but I decided to look further back in history…

Breaking up the time periods into 5-year chucks, here are the statistics:

5-year “Buy in January, Sell in February” Statistics

2011-2015: +15.71%

2006-2010: -8.7%

2001-2005: +0.88%

1996-2000: -6.38%

The santa claus rally didn’t really exist as claimed by most sensationalists.

This time, we want to look at whether January tells us if the year would be a winning year.


JANUARY BULL RUN = WHOLE YEAR BULL RUN?

Quantpedia has a good summary of this, and the strategy is simple: Invest in equity market in each January. Stay invested in equity markets (via ETF, fund or futures) only if January return is positive otherwise switch investments to T-Bills.

To put it more simply, there are two scenarios:

Scenario 1: January positive –> Stay invested in equities

Scenario 2: January negative –> Exit equities

The results are shocking. Quoting from a research paper titled: “What’s the Best Way to Trade Using the January Barometer?” (M. J. Cooper, J. J. McConnell, A. V. Ovtchinnikov, 2009)

“We investigated the power of the January market return to predict returns for the next 11 months using 147 years of U.S. stock market returns.

Using 147 years of U.S market data, this was the result:

We found that, on average, the 11-month holding period return following positive Januarys was significantly higher, by a wide margin, (-7.76%) than the 11-month holding period return following negative Januarys.”

This meant that on average, a year with a positive January outperformed a year with negative January by 7.76%. This is a very significant difference.


https://www.instagram.com/p/BOquPBmjdbj/?taken-by=iamrecneps


5 TRADING STRATEGIES THAT WERE RESEARCHED

In the research paper that I mentioned above (you can read the whole paper by downloading it in the link at the bottom of this article), here are 2 strategies that can be taken knowing that January is a good predictor of the market for the rest of the 11 months:

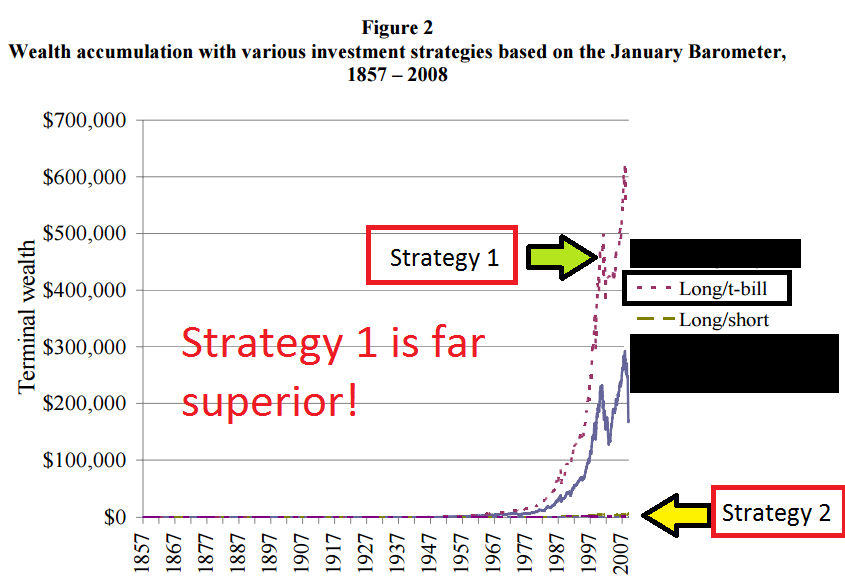
(1) LONG/T-BILL STRATEGY

Long in Jan, continue being long if Jan is positive, but exit and go long on bonds if Jan is negative.

(2) LONG/SHORT STRATEGY

Long in Jan, continue being long if January is positive, but go short if Jan is negative.

The results for 1857 – 2008 are highlighted below:

1-4Strategy 1 ( completely outperformed strategy 2.
Source: Page 21 of “What’s the Best Way to Trade Using the January Barometer?” (M. J. Cooper, J. J. McConnell, A. V. Ovtchinnikov, 2009)

In the research paper, 5 strategies were outlined, but I only cover the 2 that are relevant to our discussion.

It seems that this would be a very profitable strategy:

Firstly, buy stocks in January.

If January is positive, remain long on stocks from February to December.

If January is negative, exit stocks and go long on bonds from February to December.

In addition, the research paper also published returns for the years 1940 – 2008:

2
Strategy 1 completely outperformed strategy 2, even in the recent 70 years.
Source: Page 23 of “What’s the Best Way to Trade Using the January Barometer?” (M. J. Cooper, J. J. McConnell, A. V. Ovtchinnikov, 2009)


https://www.instagram.com/p/BOZFaacjNwq/?taken-by=iamrecneps

WHAT HAPPENED THIS YEAR?

sti-1030x478The STI is up 5.5% for the month of January 2017. Going by the strategy outlined above, if you are a buy-and-hold investor, it would be wise to hold the STI until the end of 2017.


dow-1030x473On the contrary, for the Dow, we’ve only seen a +0.4% increase in Jan 2017. At the time of writing this (2:00am Singapore Time, 1 Feb), it still makes sense to hold the U.S stock index until the end of 2017 (if you’re a buy-and-hold investor). That being said, it’s wise to employ price action strategies and focus on a precision entry/exit if you are already long.

While the January barometer is good information to know, it’s largely a super long-term strategy (10-20 years) and investors will position themselves well if they have strong price action fundamentals in a generally bullish market.

Going forward, I expect the stock market in both Singapore and U.S to be bullish. This is a probabilistic approach; I would still be making trades based on solid price action strategies, and make portfolio adjustments where necessary.

All the best for 2017, and happy trading! I hope that this article has shed some light for those who hate reading research papers 🙂


RESEARCH SOURCES & REFERENCES

investopedia.com/terms/j/januarybarometer.asp
cnbc.com/2014/01/30/uld-totally-ignore-the-january-barometer.html
quantpedia.com/screener/Details/113
papers.ssrn.com/sol3/papers.cfm?abstract_id=1436516
fullertreacymoney.com/content/2010-03-02/Januaryeffrct.pdf
Cover Image: wallpapercave.com

0 Comments/by Spencer Li
https://synapsetrading.com/wp-content/uploads/2016/12/1-5.png 1080 1080 Spencer Li https://synapsetrading.com/wp-content/uploads/2019/10/logo.jpg Spencer Li2017-02-01 10:00:442022-03-15 18:40:36The January Barometer: An Accurate Predictor of Stocks for 2017?
Page 2 of 212

Free Trading Guides

Free Trading Guides

Blog Categories

  • Beginner's Guide
  • Blockchain & Crypto
  • Book Summaries
  • Economics & News Trading
  • Investing & Portfolio Management
  • Living Your Best Life
  • Market Analysis
  • Markets & Products
  • News & Events
  • Promotions
  • Risk & Money Management
  • Stock Trading
  • Technical Analysis & Price Action
  • Testimonials
  • Tools & Resources
  • Trading Psychology
  • Trading Strategies
  • Trading Tips
  • Travel & Lifestyle

Free Trading Guides

Free Trading Guides

Contact Us

Synapse Trading Pte Ltd
Registration No. 201316168H

Whatsapp: +65-8897-1204
Telegram: @iamrecneps
Email: info@synapsetrading.com

Links

Disclaimer
Privacy policy
Terms & Conditions
Contact us
Partnerships

© 2012-2024 Synapse Trading | All rights reserved | - powered by Enfold WordPress Theme
  • Link to Facebook
  • Link to X
  • Link to Instagram
  • Link to Youtube
  • Link to LinkedIn
  • Link to Mail
Scroll to top Scroll to top Scroll to top