

How to Pick a Market Bottom (and a Top): 2 Simple Ways to Time the Market Without Calling the Exact Turn
Want the daily routine? Get the free 15-Minute Swing Trader’s Checklist. Get it free →
By Spencer Li, CFTe · Last updated: 26 October 2026
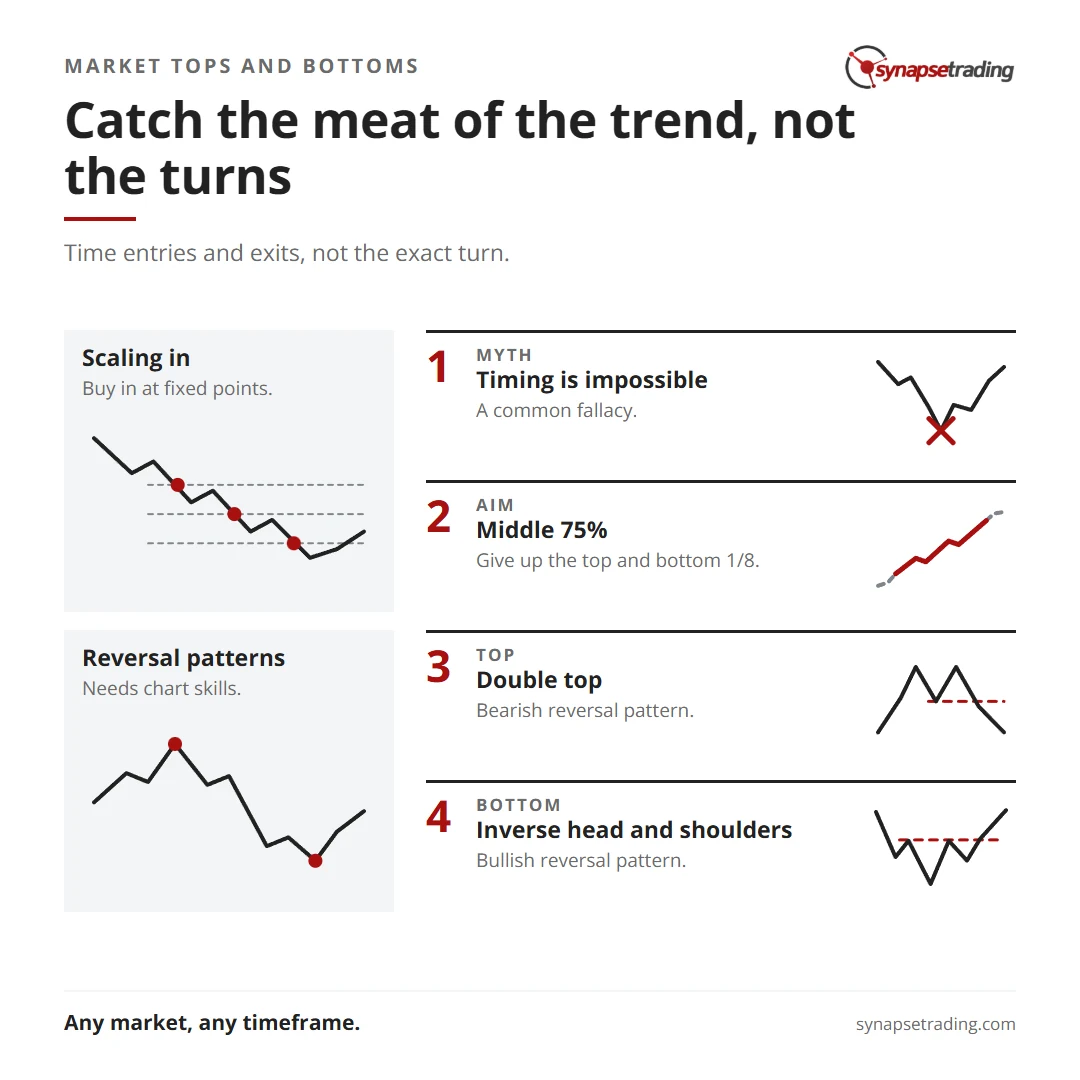
You cannot buy the exact market bottom or sell the exact top, but you can time your entries and exits well enough to lower your risk and get a better average price. The trick is to give up the top 1/8 and the bottom 1/8 of every move and aim for the 75% in the middle. There are two simple ways to do it. The first needs no charts at all, because you scale in at fixed depths as the market falls. The second needs a little technical analysis, because you watch for reversal chart patterns near the top and near the bottom. Both work on stocks, forex and commodities, and on any timeframe.
Can you time the market if you cannot call the exact bottom?
There is a common belief among investors that goes like this. Nobody can call the exact top or the exact bottom, therefore nobody can time the market, therefore market timing should be avoided altogether.
I have always thought this was a fallacy. I said so in a video on this blog in May 2020, when the market had just crashed and everyone wanted to know whether the bottom was in.
The belief mixes up two different skills. Calling the precise turning point is close to impossible, and anyone who claims to do it reliably is selling something. Timing your entries and exits well enough to manage risk is a very different job, and it is quite learnable. Giving up on the first is no reason to give up on the second.
Why give up the top 1/8 and the bottom 1/8?
A wise trader once told me that if you want to time the market, you must be willing to give up the top 1/8 and the bottom 1/8 of any move.
The arithmetic is simple. One eighth at the bottom plus one eighth at the top is a quarter of the move. That leaves 75%, the meat of every trend. Say a market falls from 100 to 60 and then climbs back to 100. If you buy at 65 and sell at 95, you have missed the 5 points at each end, and you have still captured 30 of the 40 points on the way back up.
What changes is the pressure. Once you accept that you will miss both ends, you stop trying to catch a falling knife on the way down and stop trying to sell the exact high on the way up. You are only trying to get on board for the middle of the trend, which is where most of the money is anyway.
How deep do stock markets usually fall?
In early 2020, the S&P 500 went from a record high to a 33.9% loss in just 23 trading days, from 19 February to 23 March, which was fast enough to make the question “how far can this go?” feel quite urgent. Nobody knew.
So I went back and measured it. Using the S&P 500’s daily closes from Yahoo Finance, from January 1950 to 23 October 2026, the index had 11 falls of 20% or more from a high, the usual line for a bear market. Of those 11, six reached 30%, three reached 40%, and only one went past 50%, which was the 56.8% fall from October 2007 to March 2009.
In the original 2020 video, I said stock markets usually fall 30% to 60% during corrections. That was too loose. A “correction” usually means a fall of 10% to 20%, and five of the 11 bear markets since 1950 stopped short of 30%. The 30% to 60% range describes the deeper half of the bears. It tells you the most that history has asked of a buyer, which is a different thing from the usual case.
If you would rather have a short daily routine than a crash plan, my free 15-minute swing trader checklist is the one I run myself.
Strategy #1: how does scaling in at fixed depths work?
The first method has to do with scaling in, which is similar to dollar-cost averaging, except the trigger is the depth of the fall rather than the date on the calendar.
You split the money you want to invest into tranches and decide in advance where each one gets spent, so the decision gets made once, on a quiet day, rather than fifty times on the worst days of the year. In the 2020 video, the example was the 30% mark, the 40% mark and the 50% mark. The deeper the market falls, the more you buy, so your average price ends up in the lower part of the decline without you ever needing to know where the actual low is.
The best part is that you do not need any knowledge of how to read charts or how to analyse price trends. You need a plan written down while you are calm, cash kept aside, and the stomach to keep buying when the headlines are at their worst. That last part is much harder than it sounds, which is the whole point of deciding the levels in advance.
Now, the data above shows the catch. A plan that starts buying at 30% buys nothing at all in about half of all bear markets.
Take 2025. In my weekly outlook on 20 November 2025, I looked back at the year on the QQQ. I said that “in 2025 we actually saw like a correction of about 25%”, that the market “bottomed up around in April”, and that from there it “went up all the way, right about 60%”. On my own check of the S&P 500 closes, the index fell 18.9% from 19 February to 8 April 2025, and it was back at a new high by 27 June. A 30% buyer would have watched the whole thing from the sidelines.
So the levels are a trade-off you choose. Start shallower and you buy in more of the falls that turn early, but you also spend more of your cash in the falls that keep going. There is no setting that wins in every year, and anyone who shows you one has almost certainly fitted it to the past, by testing levels until one happened to look good on the falls already behind us.
Do note that this is a method for building a long-term position rather than for trading in and out. It suits someone accumulating a broad index they want to hold for years, and it works best in an investing account kept separate from a trading account.
Strategy #2: how do reversal patterns mark a top or a bottom?
The second method needs a bit more skill, because you need to recognise reversal chart patterns, and the payoff is that it can help you near the top as well as near the bottom.
Near a top, you look for bearish reversal patterns. Near a bottom, you look for bullish ones. The 2007 to 2009 cycle had one of each.
The double top of 2007. The S&P 500 made a closing high on 19 July 2007 and dipped to a low on 15 August. Then it rallied to a slightly higher close on 9 October, and could not push on. Two peaks at about the same level, with a dip between them, make a double top, and the pattern was only complete when the index closed below the August low, which happened on 8 January 2008. In the 2020 video I called this the 2008 top, which was loose. The two peaks were in 2007, and the pattern finished in January 2008.
The inverse head and shoulders of 2009. Near the bottom, the index made a low on 20 November 2008, a lower low on 9 March 2009, and then a higher low on 10 July 2009. A low, a lower low and a higher low form an inverse head and shoulders, and on 20 July 2009 the index closed above its June high, which completed the turn.
Both patterns finished late. The double top completed about three months after the October peak, and the inverse head and shoulders completed more than four months after the March low. That gap is the 1/8 you agreed to give up, and it is the price of waiting for proof instead of hoping.
The waiting is the hard bit. In my weekly outlook on 5 February 2026, talking about gold and silver, I said we would only look to enter if there was some kind of consolidation. Why wait? “Because we just want to make sure that we are not, you know, catching a falling knife.” As I put it, “sometimes when there’s a huge spike in the prices, the price can actually continue going lower”.
You do not need a big vocabulary of patterns to start. The double top and double bottom, and the head and shoulders and its inverse, cover a surprising share of major turns, and my guide to trading price chart patterns walks through each one.
Reading the market calmly through a fall is a habit, and habits are easier with a routine. The free 15-minute swing trader checklist is mine.
Why is the bottom-picker usually the unhappiest person in the room?
In 1956, the economist Herbert Simon published a paper arguing that real people rarely optimise. They “satisfice”, which means they pick the first option that is good enough and move on. He later won the 1978 Nobel Prize in economics for his work on how decisions really get made.
In 2002, the psychologist Barry Schwartz and his colleagues tested the two types. Across seven samples, the more someone scored as a maximiser, always chasing the best possible choice, the lower their happiness and optimism tended to be, and the higher their regret and depression. Maximisers were also less satisfied with their purchases.
Bottom-picking is pure maximising. There is exactly one best price in a bear market, and every other price is, by definition, a regret. The 1/8 rule is satisficing written as a trading rule. It sets “good enough” before the decision, so that buying 10% above the low counts as a success rather than a failure.
Can the bottom only be identified in hindsight?
On 20 March 2025, a trader on Reddit’s r/investing asked a fair question: “can the bottom really only be identified in hindsight?”
For the exact low, yes. Neither method above tells you where the low is while it is happening, and I would be suspicious of anything that claims to. What both methods do is replace a prediction with a plan. The first one buys in steps as the market falls, so it never needs to know the low. The second one waits for the market to show its hand, so it accepts arriving late in exchange for some proof.
The timing of that question is a good lesson in itself. It was posted 19 days before the S&P 500 closed at its 2025 low on 8 April, and nobody reading it that day could know that.
I should also concede the limit of my own example. As at 26 October 2026, counting S&P 500 closes since 1950, five of the 11 bear markets never reached 30%. The scale-in levels from my 2020 video would have sat unused in almost half of them. The levels are your choice about how much of the move to miss, and history only tells you how often each one would have been reached.
FAQ
Can you time the market?
Partly. You cannot buy the exact bottom or sell the exact top, but you can time entries and exits well enough to lower your risk. The realistic aim is the middle 75% of a move, giving up the top 1/8 and the bottom 1/8.
How do you pick a market bottom?
Two simple ways. Without charts, scale in at fixed depths as the market falls, with the levels written down in advance. With some technical analysis, wait for a bullish reversal pattern such as an inverse head and shoulders, which marked the 2009 bottom.
How much do stock markets usually fall in a bear market?
On S&P 500 daily closes since 1950, there were 11 falls of 20% or more. Six reached 30%, three reached 40%, and one passed 50%. A correction, by the usual definition, is a smaller fall of 10% to 20%.
Which chart patterns signal a market top or bottom?
Bearish reversal patterns such as the double top warn of a top, and the S&P 500 made one in 2007. Bullish reversal patterns such as the inverse head and shoulders mark a bottom, as in 2009. Both only count once price breaks out of them.
Does this only work for stocks?
No. The same ideas apply to forex, commodities and other markets, and on any timeframe, from intraday trading to position trading.
Is scaling in the same as dollar-cost averaging?
It is a close cousin. Dollar-cost averaging buys on a fixed date, and scaling in by depth buys at fixed levels of decline, so it spends more of your cash when prices are lower.
Which kind of bottom-picker are you, the one who buys in steps or the one who waits for the pattern? And have you ever missed a rebound because you were waiting for a better price? Let me know in the comments.
If you want the bigger picture on what to do when the whole market is falling, read how to handle a stock market crash, and my free trading guides collect the rest.
And if you want a routine that does not need you watching every tick of a crash, grab the free 15-minute swing trader checklist.
About the author. Spencer Li is The 15-Minute Trader and the founder of Synapse Trading. He is a Certified Financial Technician (CFTe) with 15+ years of trading, run from 70+ countries. He holds a B.Acc and B.BM from SMU. Every trade he takes is public, dated, losses left in. He teaches rules-based swing trading in 15 minutes a day, one system for any market.
Education, not financial advice. Synapse Trading is not licensed by MAS to advise on investment products. Trading carries risk of loss, and past performance is not indicative of future results.
Want the daily routine? Enter your email for the free 15-Minute Swing Trader's Checklist.
Free 5-page PDF, then occasional trading emails. Education only, not financial advice. Unsubscribe anytime. Kit stores your email in the US: see our privacy policy.
Want to learn the full method? The Trading Mastery Program teaches the 4 strategies I have traded since 2011. It suits beginners and experienced traders.
Rather follow the trades as they happen? Daily Trading Signals is our Telegram channel: my trade ideas with entry, stop and exit, and every trade is public.
Questions about this post? Ask in the free Telegram channel →
Educational content only, not personalised financial advice. Trading carries risk, including loss of capital. Past performance is not indicative of future results. Synapse Trading is not licensed or regulated by MAS.

