

Market Crash: Should You Sell Everything or Hold On? How to Decide Before the Panic
Want the daily routine? Get the free 15-Minute Swing Trader’s Checklist. Get it free →
By Spencer Li, CFTe · Last updated: 26 October 2026
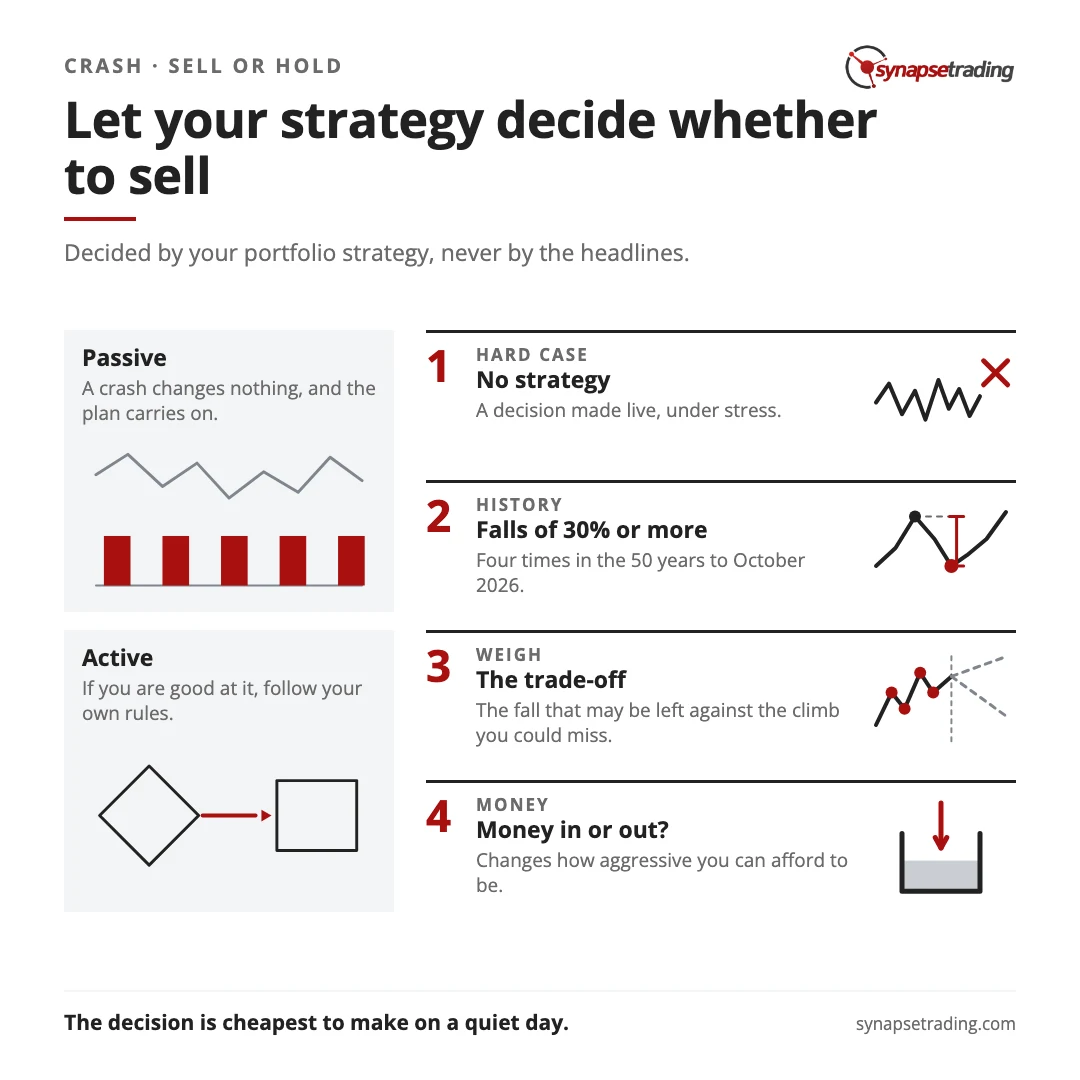
In a market crash, whether you sell everything or hold on should be decided by your portfolio strategy, and never by the headlines or the knot in your stomach. If you invest passively, a crash changes nothing and the plan carries on. If you invest actively and you are genuinely good at it, you follow your own rules, which may mean moving into cash or bonds. The hard case is the investor with no strategy at all, who has to weigh how much fall is likely left against how much climb they could miss.
I first wrote about this in March 2020, in the middle of a crash, because I kept getting the same question. The answer has not changed since.
What did March 2020 teach about selling in a crash?
On 18 March 2020, I put out a short video and a post that opened like this: “Recently in this stock market crash I have been getting this question a lot”. People wanted to know whether to sell their long-term portfolios before things got worse.
The S&P 500 closed at 2,398 that day, 29.2% below its record close of 3,386 on 19 February. Every chart was red, and every headline seemed to promise a worse one tomorrow.
The bottom came three sessions later. On 23 March the index closed at 2,237, only 6.7% below the day of my post, and by 18 August 2020 it had closed above the February record again. So anyone who sold on the day I posted saved themselves a 6.7% further fall, then watched the market climb 41% back to the old high without them.
That is the whole dilemma. Do note that it could have gone the other way, and we will get to the crash where it did.
Are you an active or a passive investor?
Before you decide anything in a crash, you need to know which of two games you are playing, because they call for opposite behaviour.
Passive investing means a fixed rule makes your buy and sell decisions. Dollar-cost averaging, where you invest a fixed sum on a fixed schedule, is passive. So is an all-weather portfolio that you reset to its target mix once a year. As I wrote in 2020, for a passive investor “there is no reason to change your portfolio strategy and panic sell just because there is a market crash.”
In fact, a crash is when the passive rule earns its keep. Your fixed monthly sum simply buys more units at lower prices, and the rule does the brave thing so you do not have to.
Active investing means you make the calls yourself. Value investing buys what you judge to be underpriced, and asset rotation moves money between asset classes as conditions change. If that is you, and your record says you are good at it, follow your strategy into safe havens like cash or bonds. That is the strategy working as designed.
| If your strategy is… | A crash means… | So the move is… |
|---|---|---|
| Passive, such as dollar-cost averaging or a yearly rebalance | Nothing has changed | Keep running the rule |
| Active, such as value or asset rotation, and you are good at it | A condition your rules already cover | Follow your own rules |
| No strategy at all | A decision made live, under stress | Weigh the fall left against the climb you could miss |
In the first two rows, the answer comes from the strategy. The crash only supplies the date.
If you would rather build your rules on a quiet weekday than in a crashing market, my free 15-minute swing trader checklist is the daily routine I run myself.
What if you never had a strategy?
This is the honest reason the question feels so hard. Most people bought some things, the market fell, and now they are staring at a red screen trying to invent a plan in real time.
In 2020 I framed it as a trade-off. “In the past 50 years, the market has only corrected 30% or more about 5 times, and only 50% or more about twice.” Then, if it has already fallen 30%, “how much lower can it go? Another 20-30% more?” And if you sell and it recovers before you buy back in, “the gains you will miss out are 40-50%.”
I went back to the S&P 500’s daily closes this week to check. In the 50 years to 2020, the falls of 30% or more came in 1970, 1973 to 1974, 1987, 2000 to 2002 and 2007 to 2009, which makes five. The two biggest were 56.8% and 49.1%, so “about twice” holds if you round the second one up. Over the 50 years to October 2026 the count is four, because the early-1970s falls slide out of the window and 2020 slides in.
The 40-50% is plain arithmetic. Say your portfolio was worth $100 and has fallen to $70. Getting back to $100 needs $30 on top of $70, which is
a 42.9% climb just to get back to where you were.
So the climb you could miss is fixed by the size of the fall. Nobody knows the fall still to come.
How much further did the market fall after the first 30%?
This is where history gets less tidy. Here are the four falls of 30% or more in the last 50 years, measured from the first close that was 30% below the old record.
| Fall | First close 30% below the record | Further fall to the bottom | Climb from that close back to the record | Months from old record to new record |
|---|---|---|---|---|
| 1987, 33.5% | 19 Oct 1987 | 0.4% | 49.8% | 23 |
| 2000 to 2002, 49.1% | 17 Sep 2001 | 25.2% | 47.0% | 86 |
| 2007 to 2009, 56.8% | 6 Oct 2008 | 36.0% | 48.1% | 66 |
| 2020, 33.9% | 20 Mar 2020 | 2.9% | 46.9% | 6 |
S&P 500 price index, daily closes, dividends left out. Re-fetched 27 October 2026.
The climb back was between about 47% and 50% every time, right in the range I gave in 2020. The further fall was all over the place, from almost nothing in 1987 and 2020 to 36% in 2008, well past the 20-30% I guessed.
So in two of the four, a seller at the 30% mark sold within a few percent of the bottom. In the other two, the seller dodged a further fall of a quarter or more. The trade-off is real, and it does not hand you a guaranteed answer.
Is selling and coming back later a better plan?
In May 2017, a trader on Reddit’s r/investing argued the other side. When things go out of control, they wrote, “quit markets and return few months later.”
They have a point, and 2008 is their best evidence. Lehman Brothers filed for bankruptcy on 15 September 2008, and the S&P 500 closed at 1,193 that day. It fell another 43% to 677 on 9 March 2009, and did not close above the Lehman-day level again until 9 April 2010. Anyone who sold that day and bought back within six months did well.
But the same move in 2020 sold near the low, then needed a second correct call to get back in while the market climbed 47% in five months. Selling is one decision. Coming back is a second one, made while the news is still terrible, and most people find it far harder than the first.
So the fair test of the idea is whether you could have told 2008 from 2020 in the week it was happening, which is far harder than it looks once the bottom is marked on the chart.
The free 15-minute swing trader checklist is the 15-minute routine I run each day, crash or no crash.
Does it matter whether money is going in or coming out?
This is the second thing I raised in 2020, and it changes how aggressive you can afford to be.
If you are still adding money from a salary, a crash is partly an opportunity, because each new contribution buys more at lower prices, and the long recoveries in the table matter much less when time is on your side.
If you are drawing money out, for example in retirement, the same table reads very differently. The record set on 24 March 2000 was not seen again on a closing basis until 30 May 2007, about 86 months later. If you have to sell units to pay this year’s bills, you cannot wait seven years, so the protection has to be built well before the crash arrives.
Even the safe havens can let you down in the first week. In my outlook on 2 April 2026, I explained why gold often drops at the start of a stock sell-off. As stock prices fall, liquidations and margin calls force people to sell their gold to raise cash. Then, once the “panic selling phase is over”, they “might start to see gold as a safe haven” again.
The same thing happened in 2020. Gold futures fell from 1,674.50 on 9 March to 1,477.30 on 18 March, a drop of 11.8% in the week stocks were at their worst. So even a well-built plan can hurt before it helps.
What can a Greek sailor teach you about a crash?
In Homer’s Odyssey, Odysseus knows his ship will pass the Sirens, whose song drives sailors onto the rocks. So he has his crew tie him to the mast while he is still calm, and orders them to ignore whatever he says once the singing starts.
Behavioural scientists call this a commitment device, and James Clear, in Atomic Habits, gives its other name, a “Ulysses pact”. You lock in the decision while your mind is clear and leave nothing for the version of you who hears the music.
Nassim Taleb adds a humbler twist in Fooled by Randomness. He says he is no Odysseus. At best he is one of the sailors who need wax in their ears. As he puts it, “If my brain can tell the difference between noise and signal, my heart cannot.”
A crash is the Sirens’ song for investors, and so is the talk of one. On 17 December 2025, I said in my weekly outlook that “some people are saying that there’s gonna be a crash next year”. My own read was different: “to me when I look at the price action I see that it is overall still an uptrend”. For the record, the S&P 500’s worst fall so far in 2026 was 9.1%, from 27 January to 30 March on closing prices, and it made a record close on 6 October.
None of that tells you what the next crash will look like. It does tell you when the decision is cheapest to make, which is on a quiet day like today, long before anyone starts singing.
FAQ
Should I sell my stocks during a market crash?
Only if your own strategy says so. A passive strategy keeps running through a crash, and an active one follows its own rules. Without a strategy, weigh the fall that may be left against the climb you could miss, and write the rule before the next one.
How often does the stock market fall 30% or more?
Four times in the 50 years to October 2026, on S&P 500 closes: 1987, 2000 to 2002, 2007 to 2009 and 2020. Only 2007 to 2009 fell more than 50%.
How long does the market take to recover from a crash?
It varies a lot. The S&P 500 took about 6 months to regain its 2020 record, 23 months after 1987, 66 months after 2007 and 86 months after 2000, on closing prices with dividends left out.
Do safe havens like gold always go up in a crash?
No. In the panic phase of a sell-off, people often sell gold to raise cash. Gold futures fell 11.8% between 9 and 18 March 2020, while stocks were falling too.
Should retirees handle a market crash differently?
Yes. Someone drawing money out cannot always wait years for prices to recover, so the protection has to be in place before the crash.
Did you sell, hold or buy in March 2020, and would you make the same call again? Let me know in the comments.
I compare what each hedge costs in how to hedge your portfolio against a market crash. The maths of resetting your mix after a fall is in how often to rebalance your portfolio, the bigger picture is in what to do in a stock market crash, and my free trading guides collect the rest.
And if you want a daily routine that takes 15 minutes, red days included, grab the free 15-minute swing trader checklist.
About the author. Spencer Li is The 15-Minute Trader and the founder of Synapse Trading. He is a Certified Financial Technician (CFTe) with 15+ years of trading, run from 70+ countries. He holds a B.Acc and B.BM from SMU. Every trade he takes is public, dated, losses left in. He teaches rules-based swing trading in 15 minutes a day, one system for any market.
Education, not financial advice. Synapse Trading is not licensed by MAS to advise on investment products. Trading carries risk of loss, and past performance is not indicative of future results.
Want the daily routine? Enter your email for the free 15-Minute Swing Trader's Checklist.
Free 5-page PDF, then occasional trading emails. Education only, not financial advice. Unsubscribe anytime. Kit stores your email in the US: see our privacy policy.
Want to learn the full method? The Trading Mastery Program teaches the 4 strategies I have traded since 2011. It suits beginners and experienced traders.
Rather follow the trades as they happen? Daily Trading Signals is our Telegram channel: my trade ideas with entry, stop and exit, and every trade is public.
Questions about this post? Ask in the free Telegram channel →
Educational content only, not personalised financial advice. Trading carries risk, including loss of capital. Past performance is not indicative of future results. Synapse Trading is not licensed or regulated by MAS.

