skillsfuture feedback 060621

Last weekend, we conducted an online workshop (SkillsFuture credit-claimable) on the basics of trading and investing, and the response was overwhelming.

Thanks for the support! ?

Here is some of the feedback and learning points from participants, after our hands-on market analysis session to find trading opportunities in the market.

If you are keen to learn more using your SkillsFuture credits, you can check out our courses:

P.S. To ensure optimal learning, we have capped the maximum class size.

Register early to avoid disappointment!

Future Credit-Eligible CourseFuture Credit-Eligible Course 2

thumbnail how to trade rectangle price patterns

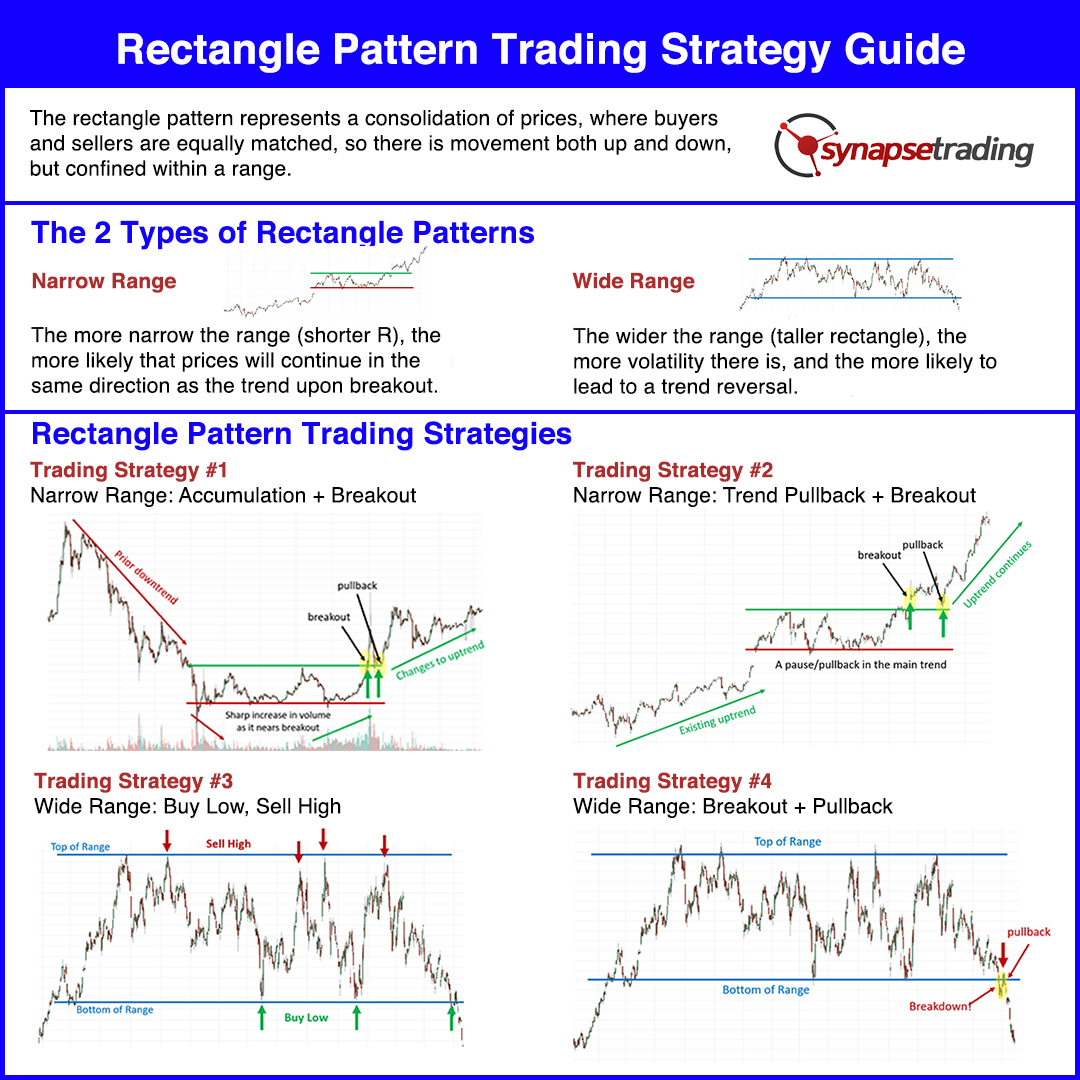
The rectangle pattern represents a consolidation of prices, where buyers and sellers are equally matched, so there is movement both up and down, but confined within a range.

This makes the rectangle pattern a very versatile price pattern for trading breakouts.

There are 2 main varieties of rectangles – namely the wide range and narrow range rectangles, each with different trading strategies.

In this post, I will show you how to take advantage of the rectangle pattern to trade breakouts, how to avoid false breakouts, and the best trading strategies for this price pattern.


Rectangle Chart Pattern Trading Strategy Guide

Rectangle Chart Pattern Trading Strategy Guide


The 2 Types of Rectangle Patterns

A rectangle pattern, as its name suggests, is a rectangular consolidation range in which prices move about.

Buying and selling forces are balanced, so prices could technically break out of either direction, but there is a higher probability of prices breaking out in the same direction as the prior trend, hence it is classified as a continuation price pattern, because it continues the movement in the same direction.

Trading Strategy Guide


There are 2 main varieties:

  • The narrow range rectangle pattern
  • The wide range rectangle pattern

The main difference is the height of the pattern, and this has major implications.

The wider the range (taller rectangle), the more volatility there is, and the more likely to lead to a trend reversal.

The more narrow the range (shorter rectangle), the more likely that prices will continue in the same direction as the trend upon breakout.


Rectangle Pattern Psychology

In a narrow range rectangle, the trend is taking a pause, and buyers and sellers are building up their positions for the next big move, which means that there is likely to be a strong move and another leg of the trend after breakout.

Trading Strategy Guide 2


In a wide range rectangle, buyers and sellers are not sure of direction, and are just trading within the range. During this range, there are likely to be more false breakouts than real breakouts.

Trading Strategy Guide 4

The main idea is to position ourselves strategically and enter the market just as a big move is likely to happen.


Rectangle Pattern Trading Strategies

There are 4 main trading strategies, 2 for the narrow range rectangle, and 2 for the wide range rectangle.

  1. Narrow Range: Accumulation + Breakout
  2. Narrow Range: Trend Pullback + Breakout
  3. Wide Range: Buy Low, Sell High
  4. Wide Range: Breakout + Pullback

Now, let’s go through each strategy in greater detail.


Trading Strategy #1: Accumulation + Breakout

Our first strategy is used for narrow range rectangles, where we wait for an accumulation followed by a breakout of prices.

Trading Strategy Guide 5

Although a narrow range typical leads to a trend continuation, it is also possible that a trend reversal takes places, especially if the range is very long (in terms of time duration).

A long range can “neutralise” the strength of the prior trend, as the longer the consolidation takes place, the more the people from the existing trend will start to doubt the strength of the trend.

In this example, we see that volume decreases as the rectangle pattern (accumulation phase) starts forming, and then sharply increases once a breakout is about to happen.

As a trader, we can look to enter when the breakout happens, or wait for the first pullback after the breakout to enter the market. This will get us onto the new trend right from the start.


Trading Strategy #2: Trend Pullback + Breakout

Our second trading strategy for the rectangle price pattern is to look a small rectangle which forms in the middle of a trend, and wait for an opportunity to enter when the trend resumes.

Trading Strategy Guide 6

As mentioned earlier, the longer the consolidation, the less likely the trend will continue, so the faster the breakout happens, the higher the probability of a successful trade.

In this example, we can see the rectangle pattern form in the middle of an existing uptrend, and shortly after, prices break upwards to resume the uptrend.

As a trader, we can look to enter at the breakout, or the first pullback after the breakout. This will provide a low risk entry point to ride on the next leg of the trend.


Trading Strategy #3: Buy Low, Sell High

Our next rectangle price pattern trading strategy is for the wide range rectangle.

In a wide range, breakouts have a much lower success rate, and false breakouts are more common than actual breakouts, so it makes sense to buy low and sell high within the range, and sometimes that even means fading (trading against) breakouts and expecting them to fail.

Trading Strategy Guide 7

For this strategy to work, the range needs to be clearly defined, and it also needs to be wide enough, so that there is enough “meat” on the trade, meaning there needs to be enough room for the trade to move from one end of the range to the opposite end.

In this example, the green and red arrows show the buying and selling opportunities on the chart, where you can take buy positions near the bottom of the range, and flip to sell positions at the top of the range.

You can also use dynamic scaling at different parts of the range, such as accumulating multiple buy positions as prices are in the lower end of the range, and as price move to the upper end of the range, start selling off the buy positions and start accumulating sell positions.

Do note that eventually, after numerous false breakouts, one of the breakouts is going to be real, so when that happens make sure you cut the position and get out fast.


Trading Strategy #4: Breakout + Pullback

Our last strategy for the rectangle price pattern is a breakout from the wide range.

As mentioned previously, successful breakouts are rare in a wide range, so to avoid any false breakouts, we should only enter breakouts from a wide range after a pullback, meaning we do not enter immediately upon the breakout itself.

Trading Strategy Guide 8

In the example above, we see price breaking down from the bottom of the range, and the first clue would be how strong the breakout is, and how far it continues moving after the breakout.

For trading, we would look to enter only during the pullback, which gives us a high probability and low risk entry point.

Note that this large range eventually leads to a reversal (change of trend direction).


Profit Target for Rectangle Pattern

Once a rectangle pattern is completed, one of the most useful things about it is its ability to provide a price projection, which can be used to estimate a minimum profit target for your trade.

This can be done by taking the maximum height of the rectangle, and projecting that distance from the breakout point.

Trading Strategy Guide 9

In the chart above, the maximum height of the rectangle is indicated by the blue rectangular box, which is then used as a price projection at the breakout point.

The black horizontal arrow indicates the price level which serves as the minimum profit target for the rectangle pattern breakout.

If the rectangle is small, you can even use multiple rectangle projections for multiple profit targets.

This price projection technique can be used in conjunction with other methods, such as support and resistance levels, and if there is any confluence, gives an added layer of confirmation.


Tips from the Trading Desk

  1. Trade with the larger trend
  2. The wider the range, the greater the uncertainty, and the bigger the risk
  3. When in doubt, wait for a pullback after breakout
  4. The longer the pattern takes to form, the bigger the potential move after breakout
  5. The wider the range, the higher the chance of a change in trend

Trading Strategy Guide 10

I mentioned this near the start of the guide, that it can serve as a useful gauge of how likely a rectangle consolidation is going to lead to a trend continuation or a trend reversal.

As you can see in the diagram, when the range/consolidation is narrow, there is a higher chance of the prior trend continuing, whereas if the range is wide, there is a higher chance of a reversal occurring.

The reason for this is that in a narrow range, the buyers/sellers who are riding on the existing trend are mostly still holding onto their positions, with only a minority taking profits (and waiting to enter again), so there is not much pressure to change the trend.

In a wide range, buyers/sellers will attempt to trade within the range, so they will sell near the top and buy near the bottom, creating a more balanced bullish/bearish pressure, meaning there is an equal chance that the trend can swing either way.

If you look at continuation chart patterns like the flag and pennant, they tend to have a narrow range, whereas in reversal patterns like head and shoulders and double top/bottom, they tend to have a wide range.

Taking this into account, the best approach is to trade with the trend if the rectangle pattern is narrow, and trade both sides when the rectangle pattern is wide.

Now that I have shared the various trading strategies for the rectangle price pattern, which is your favourite strategy?

Let me know in the comments below.


thumbnail the definitive guide to trading price chart patterns

If you would like to learn all the different price chart patterns, also check out: “The Definitive Guide to Trading Price Chart Patterns”

crypto updates profits

In the most recent FOMC meeting, the Fed held rates unchanged, which was no surprise, and it meant that this liquidity-driven long-term bull market in stocks and crypto will continue running.

Stocks and crypto are actually pretty correlated, and the biggest danger to the uptrend is if yields start rising.

In this post, I’m going to do an overview of the stock and crypto market, as well as review some of our recent trades.


Covid updates

Before we go into the markets, let’s take a quick look at the Covid situation, with a focus on vaccination.

vaccinations

As you can see from this chart, vaccination rollout globally is progressing slowly, with less than 10% of the world population having at least one vaccine dose.

In addition, numerous variants have been detected globally, such as Britain’s B117 strain, Brazilian P1 variant, South Africa’s B1351 and India’s “double-mutant” variant called B1617.

This does not bode well, and we can see a large disparity between the richer and less affluent countries.

Nevertheless, the financial markets seem to disjointed from the real world, as asset prices continue to climb.


Earnings & Employment (NFP)

If we look at the daily trends, the crypto market, stock market, and even the oil market are all in a strong bull trend.

vaccinations


And with the recent earnings season, a record 87% of S&P 500 companies have beat earnings estimates, and earnings look to be growing by more than 46%, according to Refinitiv.

Credit Suisse’s chief U.S. equity strategist, Jonathan Golub, has raised his forecast for the S&P 500 based on strong earnings.

He wrote, “we are raising our 2021 S&P 500 price target to 4600 from 4300, representing 9.2% upside from current levels, and 22.5% for the year.”


market-news

This coming week, we will also see the data from the NFP (non-farm payrolls), which will tell us how good the job market is amidst the US recovery from Covid.


Stock Market Targets Hit

In my previous market analysis posts, I predicted the breakout of the S&P 500 with the first target of around 4120 and the second target of 4215.

market-news

On 13 April 2021, it hit the first target of 4120, and in the Telegram screenshot above, I said that it would continue to the next price target of 4215.


SP-500


Just a few days ago, we saw that exact target being hit. Congrats! ???


Bitcoin: 24% profit in 7 days!

Bitcoin was very exciting because we traded it downwards, and then upwards, and both trades were very proftable!

bitcoin-btcusd

We spotted this rising wedge in Bitcoin, which was bearish, so we took a short position, and from here we saw a 25% correction from its all-time highs.


bitcoin-btcusd1

Following that, I pinpointed a rebound for Bitcoin, with uncanny precision.


bitcoin-btcusd3

Within just 2 days, we saw a sharp rebound of 17% from the lows, but we were still not done.


bitcoin-btcusd4

Finally, after 7 days, we took profit at the resistance level, netting a 24% profit in 7 days. Ka-ching! ???


Dogecoin: 38% profit in 5 days!

Dogecoin admittedly was a more volatile creature, so we had to be more careful in finding trading opportunities for this.


bitcoin-btcusd

Finally, we spotted a huge pin bar (bullish hammer candle), and this was the perfect opportunity for a long trade.


bitcoin-btcusd

From there, it went up 38% in the next 5 days, and it still looks like it can continue going up, so we are still holding on to this. ??


Ethereum: 50% Profit in 13 days!

I mentioned in my previous market analysis post that Ethereum is even more bullish than Bitcoin based on the chart, and now you can see why.


bitcoin-btcusd37

In just 13 days after hitting the support level (great place to buy), we netted a profit of 50%, and the price still looks to be heading higher.

At this point, I won’t be too greedy and will take most profits and wait for the next pullback to enter again.


bitcoin-btcusd121

Here’s some feedback from one of my new students, and I’m glad to see they are profiting from the Crypto bull run as well.


I have come to the end of this market analysis.

Now that I have shared my views on the various markets, do you think the markets will continue going up, or will it be a case of “sell in May and go away”?

Let me know in the comments below!

Overconfidence Bias in Trading

Consider this: “Despite the fact that more than 90% of car accidents involve human error, three-quarters (73 percent) of drivers consider themselves better-than-average drivers.”

This might sound delusional, but we also see this phenomenon in trading.

Most people think they can beat the markets. But is this true?

If you would like to learn all about investing and trading psychology, also check out: Complete Guide to Investing & Trading Psychology


Overconfidence Bias in Trading

In this post, I’m going to share about overconfidence, and how this behavioral bias affects your trading decisions.


What is Overconfidence Bias?

Firstly, what is confidence?

According to Wikipedia, “confidence is a state of being clear-headed either that a hypothesis or prediction is correct or that a chosen course of action is the best or most effective. Confidence comes from a Latin word ‘fidere’ which means “to trust”; therefore, having self-confidence is having trust in one’s self.”

So confidence is a good thing to have.

But too much of a good thing can make it bad. What happens when there is too much confidence?

Overconfidence bias is the unwarranted faith in one’s intuitive reasoning, judgments, and cognitive abilities.

In other words, people tend to think that they are smarter and make better decisions than they actually do in reality.

“Too many people overvalue what they are not and undervalue what they are.” – Malcolm S. Forbes


Reasons for Overconfidence Bias

What leads to overconfidence bias?

Studies conducted have shown that people overestimate both:

  1. Their own predictive abilities and
  2. The precision of information that they have been given.

In the first instance, people think that they are smarter, while in the second instance, people think that they have better information than they actually do.

For example, someone might get a tip from a broker or read something off the internet, and based on that information, they are ready to take action, such as placing a trade, based on the perceived knowledge advantage.

If there is no logical basis for the advantage, then this perceived edge does not exist at all, despite what the trader thinks he knows.

In other words, they are overly-confident that the information they got is accurate and gives them an advantage, without taking the necessary measures to verify the accuracy of the information before acting on it.

In addition, people are poorly calibrated in estimating probabilities – events which they think are certain to happen are often less than 100% certain to happen.


Reasons for Overconfidence Bias


Types of Overconfidence Bias

There are two kinds of overconfidence bias:

  1. Prediction overconfidence bias and
  2. Certainty overconfidence bias.

The latter leads you to think you have a higher chance of being right, while the former leads you to think of how accurately right you are.

Let’s look at how each type of behavioral bias affects your trading.


1. Prediction Overconfidence Bias

In prediction overconfidence bias, the confidence intervals that traders assign to their predictions are too narrow.

An example of this is when “experts” try to forecast precise price targets.

Quite often, we see in the news that certain celebrities or analysts or banks give some ridiculous price projections or price targets.

It is simply not possible to forecast with such accuracy.

Even for professional traders, they can only get an idea of the direction and some idea of magnitude, but no way is anyone going to be able to pinpoint exactly what price a particular stock is going to reach in a particular number of days.

That is prediction overconfidence, or most of the time, just fabricating numbers for attention.


b) Certainty Overconfidence Bias

In certainty overconfidence bias, traders are too certain of their judgments.

At the professional level, even when you find a good trade, you are at most 60-70% certain, and that is good enough to make you profitable in the long-run.

But when amateurs see that same trade, they become 90-100% certain that that is going to be a winning trade.

As a result of that overconfidence bias, amateurs think that every trade they enter is a “sure-win” trade, and they become blind to the prospect of a loss, and then feel disappointed or surprised that the trade performs poorly.

This also leads them to take larger positions, higher risk, and have no contingency plan or stoploss. After all, why would you need a stoploss if your trade is a “sure-win”?


How Does this Affect your Trading?

The dangers of overconfidence are numerous.

For example, if traders overestimate their ability to pick a winning trade, they become blind to warning signs or information that indicate that their decision was wrong.

This might make them enter bad trades or hold on to losing positions.

On the other hand, if traders believe they have special knowledge, they may also end up trading excessively.

Overconfidence can also cause traders to underestimate downside risk, and in worse cases not using a stoploss.


How to Prevent Overconfidence Bias?

Like I mentioned earlier, there is a fine line between confidence and overconfidence.

You need to have enough confidence to trust your analysis and not get swayed by the crowd, yet not get carried away and think that your analysis is 100% correct.

So no matter how good your analysis and research is, always assume that the edge you have is at most 60-70%, meaning there is still a 30-40% chance you will be wrong.

If you enter the trade with that mentality, you will still do your proper risk and money management, have a contingency plan, and place your stoploss to limit your risk.

This prevents you from succumbing to the overconfidence bias.

Always keep in mind that trading is a game of probabilities, and nothing is 100%.

Now that I have shared what the overconfidence bias is, how do you think it has affected your trading decisions?

Let me know in the comments below.


complete guide to investing and trading psychology cover

If you would like to learn more about trading psychology, also check out: “The Complete Guide to Investing & Trading Psychology”

draft 2 market analysis what to buy now e1618222224862


As countries around the world roll out their vaccine plans, we can see different industries and different countries recovering at different rates.

However, only a small percentage (about 5%) of the global population is vaccinated, so it might take a while before we start to see the results of the vaccines kick in to reduce new Covid cases.

Stock Market Surges As Predicted

Stock Market Surges As Predicted 2

If you look at the graph of new cases, it is still on the rise.

Given such a scenario, how does this affect the financial markets, and what are some of the investment opportunities we can look at?


Stock Market Surge

On 31 March 2021, I shared this important snippet in the public Telegram channel, because I felt that S&P 500 was going to have a breakout.


Stock Market Surge

“Following up on the S&P 500, it is still within the range, but now the odds are much higher that it will continue going higher.

If I had to guess, I would estimate 70% bullish and 30% bearish.

This means it’s a good low-risk opportunity to add long positions, with a SL just below the recent swing low (around 3840).

Shared this with my students a few days ago, will tonight be the night the S&P 500 makes a new high?”


That very night, stocks broke to a new high, and has been steadily heading up for the past 1-2 weeks.


Stock Market Surge 2

“Following up on our last post, the market is surging up as predicted. Congrats to those who followed! ???


As of Friday last night (9 April 2021), the S&P 500 has hit our first price target of 4125, giving us close to 4% gain so far.


Stock Market Surge 3


We have taken half profits, and there might be small pullback where we can add positions before gunning for the next price target.


Not Much Upside for Oil Markets

On 27 March 2021, I shared a chart on the long-term outlook of the Crude Oil market, and I felt that that most of the post-Covid recovery has been priced into oil, and since it won’t be going up much, I suggested taking a long-term short position on it.

Upside for Oil Markets

“Looking at the long-term chart of Crude Oil, we saw it bottom around April last year, before recovering all the way to previous highs in a 2-legged move.

Something interesting to note is that the 2 legs of the 2-legged move are exactly the same length.

Now that it has reached the pre-Covid highs, I do not see much more upside for Crude Oil.”


Upside for Oil Markets 2

“Following up on Crude Oil, it has started turning down as predicted. Possible short entry for the next leg down.”

Since then, prices have started to turn down a little, and I will continue to hold my short positions for another possible leg of price movement downwards.


Will USD Become Bullish?

On 27 March 2021, I noticed that the USD was picking up strength, which was surprising, considering how much money the US has been printing.

My guess is that currently, the US is recovering faster from Covid as compared to many of the less developed countries.


USD Become Bullish

“Looking at the US Dollar Index (DXY), it seems like after a multi-year downtrend, the USD is picking up strength.

It has broke the long-term bearish trendline, formed a small double bottom, and is now challenging the 200-EMA.”


USD Become Bullish 2

Looking at the larger chart of the US Dollar Index (DXY), you can see that price has formed a double bottom, however the size of this pattern is not that convincing since it is comparatively small.

Price is now fighting in the middle of the EMAs, and we will need to see if it can emerge victorious and stay above all the EMAs.


Relative Strength of Forex Pairs

Let’s take a look at the other currencies and their relative strength.

Strength of Forex Pairs 2This shows the current ranking of different currencies, from strongest to weakest.


Strength of Forex Pairs 2

“Stocks continue to surge as predicted, and because the JPY is weakening, all pairs of /JPY are very bullish too.”

This shows the trends of the different currency pairs, stocks indices, commodities and bonds.

From these 2 tables, we can see that JPY & GPY are bearish, while USD & CHF are bullish.


Crypto: Bitcoin & Ethereum

Cryptocurrencies are really heating up right now, and I’ll be focusing on the 2 major ones – Bitcoin (BTC/USD) and Ethereum (ETH/USD).


Bitcoin & Ethereum

Looking at the chart of Bitcoin (BTC/USD), it is still staying nicely within the uptrend channel, with a nice ascending triangle building up for more bullish pressure.

It is very likely that it will break new highs this weekend.


Bitcoin & Ethereum 2

Looking at the chart of Ethereum (ETH/USD), it is possibly even more bullish than Bitcoin, after a breakout of a ascending triangle, a pullback to test the breakout, which also formed a bull flag.

That is already a confluence of 3 bullish factors.

Needless to say, I will be holding on to this as well.


Market Summary

In this post, I have covered many markets, and the key things to note are:

  • Bullishness of the stock market
  • Long-term bearishness of Crude Oil
  • Potential bullish reversal of the USD
  • Bearishness of JPY & GPY
  • Bullishness of USD & CHF
  • Bullishness of cryptocurrencies

Now that I have shared my views on the various markets, what do you think is the best investment at this point of time?

Let me know in the comments below!