final draft how to trade heads and shoulders new 2021

The head and shoulders and inverse head and shoulders are a type of common reversal pattern found at the end of major trends.

The bearish version is called the head and shoulders pattern, while the bullish version is called the inverse head and shoulders pattern.

In this post, I will show you how to take advantage of the head and shoulders pattern to identify major market reversals, and the best trading strategies for this price pattern.


Head and Shoulders Pattern Trading Strategy Guide


What is a Head and Shoulders Pattern?

The head and shoulders and inverse head and shoulders are another type of common reversal patterns found at the end of major trends.

What is a Head and Shoulders Pattern

When prices are unable to surpass the prior swing high (the head) and forms a lower high (the shoulder) instead, this forms the bearish head and shoulders reversal pattern.

When prices are unable to surpass the prior swing low (the head) and forms a higher low (the shoulder) instead, this forms the bullish inverse head and shoulders reversal pattern.


Head and Shoulders Pattern Psychology

Here is a quick recap of the 2 types of patterns:

  • Head and shoulders pattern – bearish reversal
  • Inverse head and shoulders pattern – bullish reversal

Head and Shoulders Pattern Psychology (Bearish Reversal)

In the head and shoulders pattern, bulls (buyers) are originally in control of the market, and the market is in an uptrend.

What is a Head and Shoulders Pattern 2

At some point in time, bears (sellers) try to take control, pushing down prices, which creates the “left shoulder” of the pattern.

Bulls resume control and push prices to new highs, which forms the “head” of the pattern.

Bears try to fight for control again, pushing prices back down to the level of its first push.

Bulls try one last time to resume control by pushing prices up, but it is unable to make new highs. This forms the “right shoulder” of the pattern.

Finally, bears take full control and push prices further down.

Bears are now in control of the market, and the market is in a downtrend.

Inverse Head and Shoulders Pattern Psychology (Bullish Reversal)

In the inverse head and shoulders pattern, bears (sellers) are originally in control of the market, and the market is in a downtrend.

What is a Head and Shoulders Pattern 3

At some point in time, bulls (buyers) try to take control, pushing up prices, which creates the “left shoulder” of the pattern.

Bears resume control and push prices to new lows, which forms the “head” of the pattern.

Bulls try to fight for control again, pushing prices back up to the level of its first push.

Bears try one last time to resume control by pushing prices down, but it is unable to make new lows. This forms the “right shoulder” of the pattern.

Finally, bulls take full control and push prices further up.

Bulls are now in control of the market, and the market is in an uptrend.


Head and Shoulders Pattern Trading Strategies

There are 3 main strategies, which focus on the taking advantage of the change in trend, and the difference lies in how early to enter the reversal when it happens.

  1. Early Entry: Enter immediately
  2. Pre-Breakout Entry: Enter immediately
  3. Pullback Entry: Wait for a pullback after the breakout

What is a Head and Shoulders Pattern 4

Since the head and shoulders is a reversal pattern, we can expect to see its swing counts change as the pattern unfolds.

For the bearish reversal of the head and shoulders pattern, we see the swing counts change from a series of higher highs and higher lows, to one of lower highs and lower lows.

For the bullish reversal of the inverse head and shoulders pattern, we see the swing counts change from a series of lower highs and lower lows, to one of higher highs and higher lows.

For all 3 strategies, they involve entering a position at various stages during this transition of swing counts.

Now, let’s go through each strategy in greater detail.


Trading Strategy #1: Early Entry

Our first strategy for the head and shoulders price pattern is to enter early as the 2nd shoulder (right shoulder) is forming, by using the 1st shoulder (left shoulder) as a guide.

What is a Head and Shoulders Pattern 5

As mentioned previously, the head and shoulders pattern is a reversal pattern, and we can expect to see swing counts change as the pattern unfolds.

The early entry takes advantage of this by shorting on the first LH (bearish H&S reversal), or going long on the first HL (bullish inverse H&S reversal). You can scroll up to the previous infographic (entries in head & shoulders pattern) to observe where the colour changes.

In the examples above, we see a prior trend, followed by the head and shoulders pattern which attempts to change the direction of the trend.

The first sign of the change of trend comes from the 2nd shoulder (right shoulder), because it is not able to reach the same level or exceed the head, which shows that the existing trend is weakening.

Most of the time, the 2nd shoulder (right shoulder) will form at roughly the same level as the 1st shoulder (left shoulder). This means that we can pre-empt the potential turning point of prices, and use that for our early entry.

For trading, we would look to enter near the point of the 2nd shoulder, keeping an eye for reversal candlestick bars/price action and volume which signals that momentum is weakening and it cannot go past the shoulder level.

We can then look to place our stoploss (SL) somewhere between the shoulder and the head levels.

This strategy works best if the price movement to resume the current trend is weak, and looks to be struggling just to touch the shoulder level, which suggests that it will most likely not be able to go past.


Trading Strategy #2: Breakout Entry

Our second strategy for the head and shoulders price pattern is to enter on the breakout/breakdown of the neckline.

What is a Head and Shoulders Pattern 6

As mentioned previously, the head and shoulders pattern is a reversal pattern, and we can expect to see swing counts change as the pattern unfolds, meaning a LH & LL if we want to short, and a HL & HH if we want to go long.

In the previous strategy (early entry), the entry was given on the first LH (shorting a bearish H&S reversal), or the first HL (going long on a bullish inverse H&S reversal).

In this strategy (breakout entry), the entry is given on the LL (shorting a bearish H&S reversal), or the HH (going long on a bullish inverse H&S reversal). Breaking the neckline automatically gives rise to a LL and HH respectively.

In the examples above, we can see the neckline (blue horizontal line) which denotes this crucial price level. Sometimes, if there is no clear neckline, this might result in a zone, or multiple necklines.

For trading, we would look to enter just as the breakout occurs at the neckline, keeping an eye for strong price action and volume which signals conviction in the breakout.

We can then look to place our stoploss (SL) somewhere between the neckline and the 2nd shoulder (right shoulder).

This strategy works best if there is a clear neckline which price is trying to break, followed by strong price momentum on the breakout.

If the price action is choppy/volatile, or if the neckline is not clear, then it would be better to wait for a pullback and use Strategy #3 (pullback entry) instead.


Trading Strategy #3: Pullback Entry

Our third strategy for the head and shoulders price pattern is to wait for the break of the neckline to occur (Strategy #2), then enter on the 1st pullback after that happens.

What is a Head and Shoulders Pattern 7

As mentioned previously, the head and shoulders pattern is a reversal pattern, and we can expect to see swing counts change as the pattern unfolds.

In the previous strategies, we shorted on a LH (Strategy #1) and LL (Strategy #2); or went long on a HL (Strategy #1) and HH (Strategy #2).

In Strategy #3, we will be shorting on the next LH (LH > LL > LH), or going long on the next HL (HL > HH > HL).

Therefore, since the new trend is slightly more established, the chance of success is higher, but the reward-to-risk ratio (RRR) will not be as good as the prior strategies. As we mentioned many times before, every trade is a trade-off between the hit rate and the RRR.

In the examples above, we can see where the 1st pullback occurs (yellow highlight), depending on which neckline you treat as the breakout.

Most of the time, the pullback will retrace to touch the neckline, but if the breakout momentum is strong, the pullback may not come all the way back to the neckline.

For trading, we would look to enter near the point of the pullback (usually near the neckline), keeping an eye for reversal candlestick bars/price action and volume which signals that momentum is weakening and it cannot go past the neckline.

We can then look to place our stoploss (SL) somewhere between the neckline and the 2nd shoulder (right shoulder).

If you have already entered a position during the breakout, this strategy can be an opportunity for you to add on more positions.


Profit Target for the Head and Shoulders Pattern

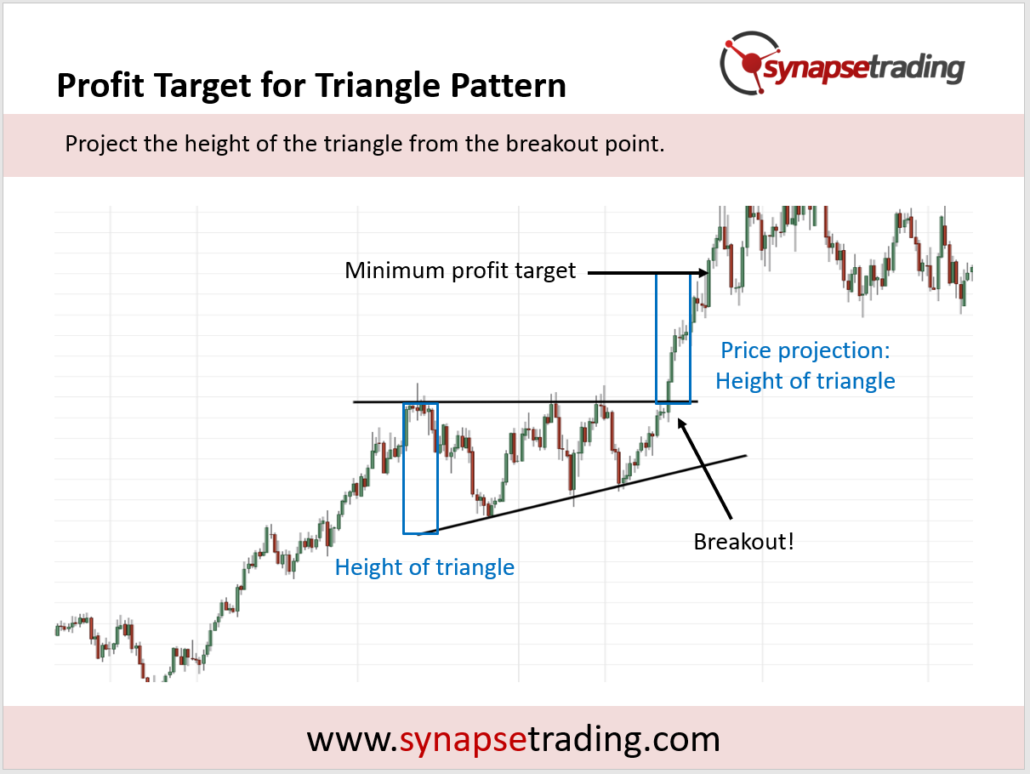
Once a head and shoulders pattern is completed, one of the most useful things about it is its ability to provide a price projection, which can be used to estimate a minimum profit target for your trade.

This can be done by taking the maximum height of the pattern (distance from the head to the neckline), and projecting that distance from the breakout point.

If the neckline is not clear or there are multiple necklines, it is advisable to go with the most conservative option, and use a smaller projection.

What is a Head and Shoulders Pattern 8

In the chart above, the maximum height of the head and shoulders pattern is indicated by the blue rectangular box, which is then used as a price projection at the breakout point.

The horizontal arrow indicates the price level which serves as the minimum profit target for the head and shoulders pattern breakout.

This price projection technique can be used in conjunction with other methods, such as support and resistance levels, and if there is any confluence, gives an added layer of confirmation.


Tips from the Trading Desk

  1. Make sure the trend is in the late stage – the longer the trend has been running, the more exhausted it is likely to be.
  2. Use the completed pattern for price projection – shoulders tend to be roughly the same height.
  3. The size of the pattern should be proportional to the trend it is trying to reverse.

What is a Head and Shoulders Pattern 9

As you can see from the chart above, this is an example of a strong trending market (3 green rectangle boxes), which ended in a head and shoulders bearish reversal (1 red rectangular box).

This means that for the whole move up, if we only measure the vertical distance (height), the trend accounts for 75%, and the reversal pattern accounts for 25%. This is within the healthy range, meaning the pattern size is proportional to the whole trend.

Typically, a reversal pattern works best when its height is about 25% to 33% (1/4 to 1/3) of the whole move.

If the pattern size is less than 25%, the pattern is too small to reverse the trend, which means that it might likely lead to a consolidation before the trend resumes, or the reversal pattern is still in the midst of forming, and might evolve to something bigger.

If the pattern is large than 33%, the pattern is too large to be classified as a head and shoulders pattern, and it could just be large swings within a wide range.

I have not come across any authors talk about price pattern proportionality in any books, but I see a lot of new traders making this mistake when trying to identify price patterns. And this applies to other price patterns as well.

Now that I have shared the various trading strategies for the head and shoulders price pattern, which is your favourite strategy?

Let me know in the comments below.
 

thumbnail the definitive guide to trading price chart patterns

If you would like to learn all the different price chart patterns, also check out: “The Definitive Guide to Trading Price Chart Patterns”

cup and handle pattern trading strategy

The cup and handle is an accumulation buying pattern, which is found during long periods of consolidation, and can lead to powerful explosive moves once the pattern is fully completed.

There are 2 main varieties of this pattern – the cup and handle reversal pattern, and the cup and handle continuation pattern.

In this post, I will show you how to take advantage of the cup and handle pattern to trade breakouts, how to avoid false breakouts, and the best trading strategies for this price pattern.


Cup and Handle Pattern Trading Strategy Guide


What is a Cup and Handle Price Pattern?

The cup and handle is an accumulation buying pattern, which is found during long periods of consolidation, and can lead to powerful explosive moves once the pattern is fully completed.

In the diagram below, you can see that the price pattern consists of a larger accumulation base (the cup), before forming a smaller accumulation base (the handle), before finally leading to a breakout.

What is a Cup and Handle Price Pattern

From a practical viewpoint, we will usually start to notice the pattern only when it starts forming the “cup” part of the pattern, which is quite identifiable by the smooth gradual curve upwards of trending swing counts of higher highs and higher lows on the chart.

The confirmation will come from the “handle” part of the price pattern, which is like a small pullback before the price explodes upwards. You can think of it as pushing down on a loaded spring, to build up more pressure just before the release.


The 2 Types of Cup and Handle Patterns

Unlike other chart patterns, the cup and handle pattern does not work equally for both the bullish and bearish scenario, as it is almost exclusively found in the bullish scenario only. Hence, we don’t hear people talking about “bullish cup and handle” or “bearish cup and handle”, because when they say “cup and handle”, it is understood to refer to the bullish version.

Based on the 2 main categories of chart patterns (continuation vs reversal), most people tend to classify the cup and handle pattern under the “Reversal Patterns” category, however I feel that the cup and handle can be both a reversal or continuation pattern.

In the diagram below, I illustrate the 2 different types of cup and handle patterns.

The 2 Types of Cup and Handle Patterns

a) Cup and Handle Reversal Pattern

In the reversal cup and handle, prices start off in a prolonged downtrend, where they gradually lose momentum and become more sideways. Prices start to bottom out and form a reversal base, before leading to a change in direction.

b) Cup and Handle Continuation Pattern

In the continuation cup and handle, prices are on an existing uptrend, and when the trend loses some steam or takes a pause, prices start to move sideways. The cup and handle pattern helps to buy up more buying pressure, before prices break to new highs and resume the uptrend.

In both scenarios, the context is very different, but the pattern is the same, and can be traded in exactly the same way.


Cup and Handle Pattern Psychology

In the cup and handle pattern, as the downtrend starts to weaken (less bears/sellers), the bulls/buyers start trying to take control from the bears, by gradually accumulating long positions.

Cup and Handle Pattern Psychology

As they build up their positions, we start to see a wide U-shape bottom (the cup), where bulls and bears are almost balanced. This suggests that the bears are no longer in control, and the downtrend has been neutralized.

In the final stage, where the handle forms, this is where the final battle of the bulls and bears take place.

By this time, the bulls have the upper hand as they have been accumulating positions during the cup formation, which in turn attracts more buyers.

Once the last bears are killed, bulls take full control, and the explosive price breakout takes place.


Cup and Handle Pattern Trading Strategies

There are 2 main strategies, which focus on the final battle between the bull and bears, because that is usually the tipping point where large explosive moves happen once the bears give up and get overwhelmed by the bulls.

  1. Pre-Breakout Entry: Enter before the breakout
  2. Pullback Entry: Wait for a pullback after the breakout

Cup and Handle Pattern Trading Strategies

Since the cup and handle is inherently a bullish pattern, the basic idea is to look for low risk buying opportunities to enter.

Looking at the diagram above, you might think that the best place to enter a trade is during the cup phase, because you can get the best entry price.

However, during the cup phase, the odds are 50-50, and there is no real edge, because the market is still sideways at that point of time.

In addition, the cup phase might last a really long time, and may not lead to a handle.

Hence, it makes more sense to make good use of your trading capital, and only enter the trade as the action is about to start.

The first opportunity would be to enter during the handle phase before the breakout, but if you miss that, they next best chance is to enter on the first pullback after the breakout.

Now, let’s go through each strategy in greater detail.


Trading Strategy #1: Pre-Breakout Entry

Our first strategy for the cup and handle price pattern is to enter just before the completion of the pattern, during the handle formation.

Cup and Handle Pattern Trading Strategies 1

During the cup formation, buyers would have been accumulating long positions and building bullish pressure, with the occasional test of the resistance level by trying to break out.

As the handle forms, it is very close to the breakout happening, and this provides a good low-risk opportunity to enter the trade just before the action begins.

Once the breakout happens, the price and volume is expected to surge, which would make it more challenging to enter a position, hence it is recommend to take a position before that.

For trading, we would look to enter during the handle formation, which would be very close to the resistance level.

We can then place a stoploss below the handle, and since the handle is usually pretty small relative to the pattern, the risk will not be very high.


Trading Strategy #2: Pullback Entry

Our next strategy for the cup and handle pattern is to enter on the first pullback after the initial breakout.

Cup and Handle Pattern Trading Strategies 2

As covered in the previous setup, one of the ways to trade the cup and handle pattern is to enter just before the price breaks out of pattern.

However, sometimes the breakout might be too fast, or you might have missed the breakout opportunity.

After such a long build-up (the cup and also the handle), it is very likely that any resulting move up would have more than 1 leg, so the first pullback/pause is a good place to enter because there is a high chance of a 2nd leg after the trend resumes.

In the example above, we see prices surge after the initial breakout, followed by a small pause which looks like a bull flag, before prices continue to surge again after breaking out from the flag pattern.

That small pause (in this case the bull flag) gives us a good low risk opportunity to get into the trade to ride the next wave of uptrend. Do note that the pause may not always be a flag, sometimes it might take other forms, but the idea is the same.

For trading, we would look to enter during the pause (formation of the small flag), when the risk and volatility is low.  The bottom of the pullback pattern would be a good place to put your stoploss.

If you have already taken a position using Strategy #1 on the pre-breakout, you can also use Strategy #2 to add more positions on the first pullback.


Profit Target for the Cup and Handle Pattern

Once the cup and handle pattern is identified, you can use the completed pattern to do a price projection, which can serve as a good estimate for a target profit for your trade.

To measure the target price, take the maximum height of the cup, and project that distance from the breakout point.

Profit Target for the Cup and Handle Pattern

In the chart above, the maximum height of the cup is indicated by the blue rectangular box, which is then used as a price projection at the breakout point.

The black horizontal arrow indicates the price level which serves as the minimum profit target for the cup and handle pattern breakout.

To get an added layer of confirmation, you can look for confluence with with tools and methods, such as support and resistance levels.


Tips from the Trading Desk

  1. For cup and handle continuation, look to trade with the trend, especially if the trend is strong.
  2. For cup and handle reversal, look for a strong accumulation base to build the move.
  3. Look for multiple attempts to break the resistance, but also avoid the false breakouts!

Tips from the Trading Desk

As you can see from the chart above, a key component of the cup and handle pattern lies in the resistance level, because in a sense the whole build-up during the cup and the battle during the handle is an attempt to break though this level.

Hence during the build-up phase, we should look out for attempts to break the resistance levels, and it is expected that the first few attempts will fail, so do not try to trade those breakouts.

These “false breakout” attempts are more to probe for weaknesses, and the chances of a successful breakout at this point of time is low because there is insufficient build-up, which usually takes the form of the handle.

Hence, it is more prudent to only enter this setup during the handle formation, especially if previous attempts have been made to break the resistance.

Now that I have shared the various trading strategies for the cup and handle price pattern, which is your favourite strategy?

Let me know in the comments below.


thumbnail the definitive guide to trading price chart patterns

If you would like to learn all the different price chart patterns, also check out: “The Definitive Guide to Trading Price Chart Patterns”

Die with Zero Summary

Recently I read this book, “Die with Zero” by Bill Perkins, which put forth an interesting concept to plan your finances so that you die with zero, instead of the usual advice to hoard a large sum of money to live off the interest/dividends, and die with the capital.

Book Summary

How Much Time Should You Exchange for Money?

Life energy is all the hours that you’re alive to do things—and whenever you work, you spend some of that finite life energy. So any amount of money you’ve earned through your work represents the amount of life energy you spent earning that money.

If you die with extra money, it means you have sacrificed hours of your life for those money, which effectively means you have wasted those hours of your life.

This means that there is an optimal amount of work (to exchange time into money) you will need to do in order to live the lifestyle you want, but any more than that is unnecessary. But people tend to work and save way more than necessary, usually out of fear or habit.

Our culture’s focus on work is like a seductive drug. It takes all of your yearning for discovery and wonder and experiences, promising to give you the means (money) to get all those things—but the focus on the work and the money becomes so single-minded and automatic that you forget what you were yearning for in the first place. The poison becomes the medicine—that’s nuts!

For some people, it is easier to keep doing what you’ve been doing, especially when what you’ve been doing continues to reward you with society’s universal form of recognition for a job well done, aka money. Once you’re in the habit of working for money to live, the thrill of making money exceeds the thrill of actually living.


What to Spend Money On For Maximum Value

Many psychological studies have shown that spending money on experiences makes us happier than spending money on things. Unlike material possessions, which seem exciting at the beginning but then often depreciate quickly, experiences actually gain in value over time: They pay what I call a memory dividend.

The main idea here is that your life is the sum of your experiences. This just means that everything you do in life—all the daily, weekly, monthly, annual, and once-in-a-lifetime experiences you have—adds up to who you are.

Start actively thinking about the life experiences you’d like to have, and the number of times you’d like to have them. The experiences can be large or small, free or costly, charitable or hedonistic. But think about what you really want out of this life in terms of meaningful and memorable experiences.

What’s the best way to spend our money for maximum enjoyment and in order to generate maximum memories?

What’s the best way to allocate our life energy before we die?

What are the life experiences you would like to have in this lifetime?


How to Minimise Regrets in Life

Here are the 5 biggest deathbed regrets:

  • I wish I’d had the courage to live a life true to myself, not the life others expected of me.
  • I wish I hadn’t worked so hard.
  • I wish I’d had the courage to express my feelings.
  • I wish I had stayed in touch with my friends.
  • I wish that I had let myself be happier.

The problem of confronting overly delayed gratification and the resulting regret doesn’t occur just once, at the end of one’s life. Rather, it can occur at every period during your life, from the bookworm teenager who missed out on all the fun of high school by making too many sacrifices for the sake of a supposedly brighter future to the middle-aged dad who repeatedly skipped irreplaceable experiences with his own teens by constantly hustling for one job promotion after another.

Sometimes people realize their mistake just before the window of opportunity closes—like when one’s children are getting ready to leave the nest—and sometimes the recognition comes when it’s too late to do anything at all about it except resolve to do better in their next life stage.

That is what I mean when I say that we die many deaths in the course of our lives: The teenager in you dies, the college student in you dies, the single unattached you dies, the version of you that’s a parent of an infant dies, and so on. Once each of these mini-deaths occurs, there’s no going back.

Because of this eventual finality of all of life’s passing phases, you can delay some experiences for only so long before the window of opportunity on these experiences shuts forever.

When the end is near, we suddenly start thinking, What the hell am I doing? Why did I wait this long? Until then, most of us go through life as if we had all the time in the world.

So to increase your overall lifetime fulfillment, it’s important to have each experience at the right age.


Balancing Time, Money & Energy

Balancing Time, Money & Energy

In other words, to get the most out of your time and money, timing matters.

There is a sweet spot in everyone’s lifetime during which they can most enjoy the fruits of their wealth.

The problem is that people continue to save well past that optimal point. This is the senselessness of indefinitely delayed gratification.

When you are young, you should focus more on building good experiences instead of earning money, because your earning power will definitely increase over time, meaning your dollar earned per unit time is higher.

Some researchers asked people of different ages what prevented them from taking a trip. They found that people under age 60 are most constrained by time and money, whereas people 75 and older are most constrained by health problems.

Balancing Time, Money & Energy 2

We keep putting off wonderful experiences, as if in our final month we can easily squeeze in all those experiences that we had put off all our lives.

What I’m saying is that dying with zero is not only about money: It’s also about time. Start thinking more about how you use your limited time, your life energy, and you’ll be well on your way to living the fullest life you possibly can.


Bucket List vs. Time Buckets

Bucket List vs. Time Buckets

Some experiences can only be enjoyed at certain times

Your declining health and diminishing interests mean that your list of activities will narrow as you age, which means that your spending rate won’t remain constant: If you want to die with zero and make the most of whatever health you have at every point in your lifetime, you will need to spend more in your fifties than in your sixties, and more in your sixties than in your seventies, let alone your eighties and nineties!

Many people are willing to spend tens or even hundreds of thousands of dollars to prolong life for just a few more weeks. Think about it: That’s money that they spent years or decades working hard for. They gave up years of their life while healthy and vibrant to buy a few extra weeks of life when they are sick and immobile.

The key is to strike the right balance between spending on the present (and only on what you value) and saving smartly for the future.


Financial Planning for Dying with Zero

To plan to die with zero, it is actually not that hard.

Start off by estimating the maximum possible age that you will live too, then look at how much cash you will need.

Do note that your expenses (except medical) will be much lower as you age, and can be covered with a combination of annuities, insurance, savings, plus some buffer.

For every single thing you might be worried about in your future, there is an insurance product to protect you.

Financial Planning for Dying with Zero

With this new approach, your net worth should peak earlier (in your 50s-60s), instead of peaking at your death. This means that you can retire earlier, because you do not need to hoard that much assets.


Giving Your Money Away at the Best Time

Most people wait till they pass away before “giving” their wealth to their kids, or to charities. But have you wondered, why not give it away while you are still alive?

Why not give it to your children during the time when they can make the most of it?

Giving Your Money Away at the Best Time

I actually did an informal Twitter poll recently in which I asked people what their ideal age was to receive an inheritance windfall, and most of them agreed. Of the more than 3,500 people who voted on this question, very few (only 6 percent) said the ideal age to inherit money is 46 or older. Another 29 percent voted for ages 36 to 45, while only 12 percent said 18 to 25.

The clear winner, with more than half the votes, was the age range 26 to 35.

Why? Well, some people mentioned the time value of money and the power of compound interest, suggesting that the earlier you get the money, the better. On the other hand, a bunch of people pointed out the immaturity problem of getting the money too young. And to those two concerns, I would add the element of health: You always get more value out of money before your health begins to inevitably decline.

Bottom line? The 26-to-35 age range combines the best of all these considerations—old enough to be trusted with money, yet young enough to fully enjoy its benefits.

The upshot of all this is that if you wait until you die to have your children inherit your money, you’re leaving the outcome to chance. I call it the three Rs—giving random amounts of money at a random time to random people (because who knows which of your heirs will still be alive by the time you die?).


What Do You Want to Give Your Kids?

Just as you’re trying to form memories of times with your kids, it makes sense to want your kids to form memories of you. Both sets of memories will yield a memory dividend—one stream of dividends for you and one for your kids. So how do you want your kids to remember you?

Your kids will only have their childhood for a certain number of years. What experiences do you want to have with them? Or rather, what experiences do you want them to have with you?

Does each additional hour of work you do really worth it to you and your children? Does your work add to your legacy—or does it actually serve to deplete it?


My Views: Why Am I Not Working Harder?

I get this question quite often, as people wonder why I am not working harder, trading more, scaling my business, making more money?!?!?

My question to them is, “what is the point of making more money?”

I have more than enough money to create the experiences I want, to give to the people/charities I support, and to retire and die with zero.

I choose to spend my time doing the things I enjoy, such as playing sports, hanging out with my friends/family, reading 2000+ books, and travelling around the world (70+ countries to date).

I probably will start a family at some point, which is why I have travelled to the more challenging places so far, while leaving the family-friendly places for the future.

And I look forward to creating more awesome memories and experiences in the next 2/3s of my life. ?


best books on trading and investing

If you would like to find more book summaries and recommendations, also check out: “Best Investing & Trading Books of All Time”

how to pick the market bottom

There is a common fallacy amongst many investors that because you cannot time the exact market tops and market bottoms in the stock market, therefore you cannot time the market at all, and market timing should be avoided.

This is simply not true.

While it is impossible to buy at the exact market bottom and sell at the exact market top, it is definitely possible to time your entries and exits to minimise your risk and maximise your returns.

A wise trader once told me that if you want to time the market, you must be willing to give up the top 1/8 and the bottom 1/8 of any move.

This means that instead of trying to capture the precise turning points in the market, we should focus on capturing the remaining 75% of the move, which forms the meat of every trend.

This is true not just for the stock market, but also very relevant to any market, like forex, commodities, etc. It also works on any timeframe, such as swing trading, intraday trading, position-trading, etc.

In this video, I share 2 simple strategies that a new investor or trader can use to pick tops and bottoms easily.

The first method has to do with scaling in, which is similar to dollar-cost averaging.

By studying how much stock markets usually decline (30-60% during corrections, you can allocate your capital to buy in at certain fixed points, such as the 30% mark, the 40% mark, the 50% mark, etc.

This allows you a low-risk way to buy in near the bottom, and the best part is that you do not even need any knowledge about how to read charts or how to analyse price trends.

The second method requires a bit more skill, as you will need to be familiar with technical analysis and reversal chart patterns.

By identifying bearish reversal chart patterns (such as the double top at the 2008 top), as well as bullish reversal chart patterns (such as the inverse head and shoulders pattern at the 2009 bottom), you will be able to time your trade near the top and bottom of every major move.

Enjoy the video, and remember to “like” and “subscribe”!

how to deal with too much market news

Quite often, when we dive into the financial market, we find that there is simply too much market news. When we try to trade the news, we have no idea what is important or trivial, because we are so overloaded with information. This makes news trading quite an impossible task.

To make matters worse, we often get conflicting views from experts, with some being bullish all the time, while others are bearish all the time. And because some of them have pretty convincing arguments, we easily get swayed and our own opinions tend to fluctuate from extremely bullish to extremely bearish.

So what is the way around this?

The first thing you need to know as a trade relying on market news is to be able to differentiate between FACTS and OPINIONS.

Facts are like raw data, statistics, research from credible sources, economic data, etc. These are usually unbiased and come without opinions, and provide the basis for you to form your opinion.

Opinions, on the other hand, are views formed based on the analysis of facts/data, so there is inherent bias, and the conclusions drawn from the data may or may not be correct. Hence as a trader or investor, we need to zoom in on a handful of credible sources of good analysis.

The second thing you need to know when doing news trading is to “trade what you SEE, not what you THINK”.

Opinions often give you preconceived notions or views on the market, for example you might think that the market is bullish, and hence it should go up. However, in reality, the market may not move according to your opinion.

The only reality in the market is what we see on the charts, which is the price action of the market.

No matter how bullish you think the market is, the truth is that you will not be able to make money unless the price actually moves up. So when it comes to trading, your strategies, setups and analysis of the chart should take precedence over your opinions.

And that will help you filter out all the unnecessary noise in the market to zoom in on the best trading opportunities.

Enjoy the video, and remember to “like” and “subscribe”!