I think enough has been said about how life-changing 2020 was, because of how it forced us to take a break from routine, and allowed us to step out of our comfort zones.
Change is a good catalyst for growth, and gives us new perspectives on what is really important in life.
Before diving into 2021, let just do a brief review of 2020.
Review of 2020
Markets were a wild ride, but provided great opportunities to ride strong trends, such as Tesla, Bitcoin, etc. This gave us one of the best years of returns.
https://synapsetrading.com/wp-content/uploads/2021/01/2020-09-21-14.57.51-1.jpg10801440Spencer Lihttps://synapsetrading.com/wp-content/uploads/2019/10/logo.jpgSpencer Li2021-01-11 12:22:062022-12-16 16:32:38What Do You Want to Achieve in 2021?
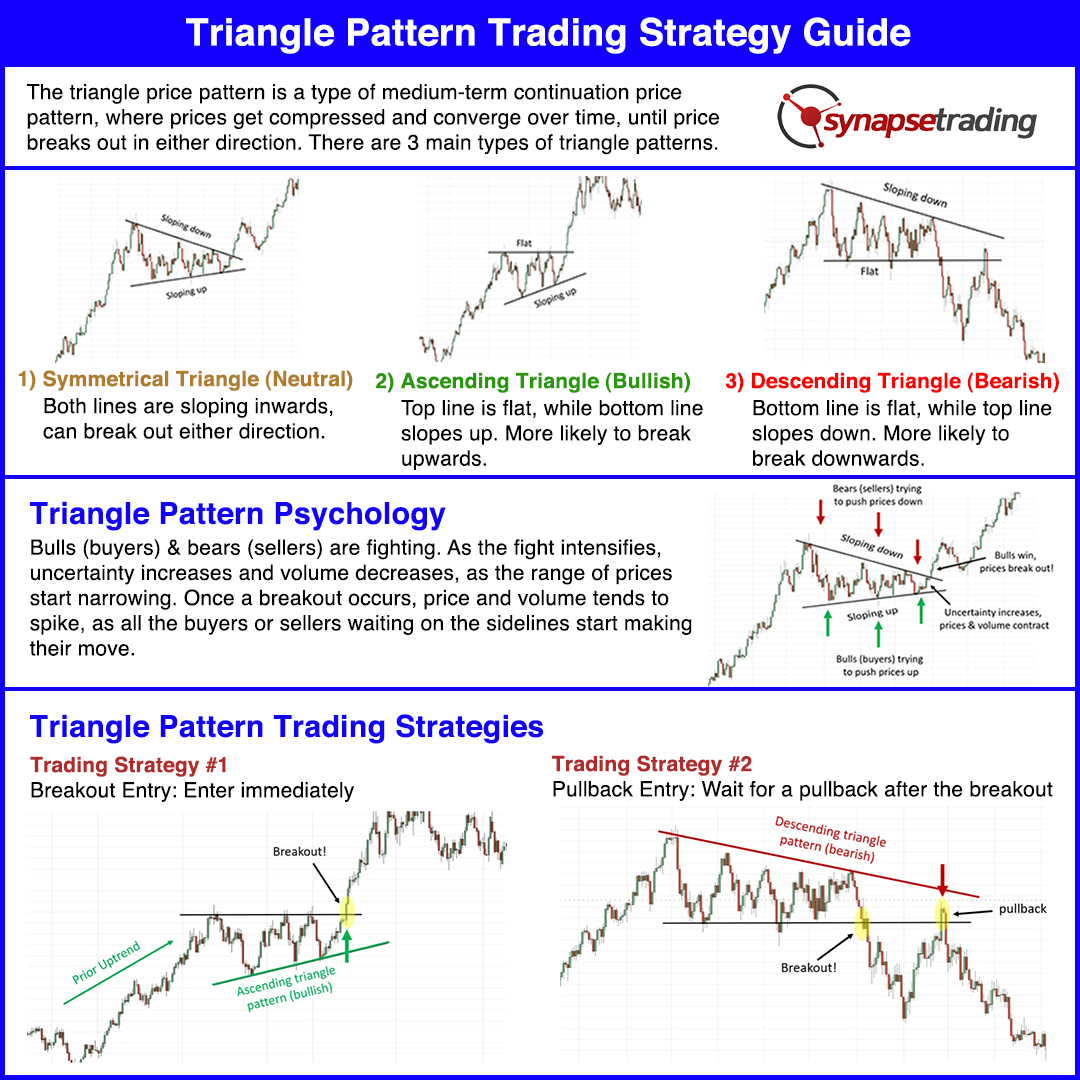
The triangle price pattern is a type of continuation price pattern, where prices get compressed and converge over time, until price breaks out in either direction.
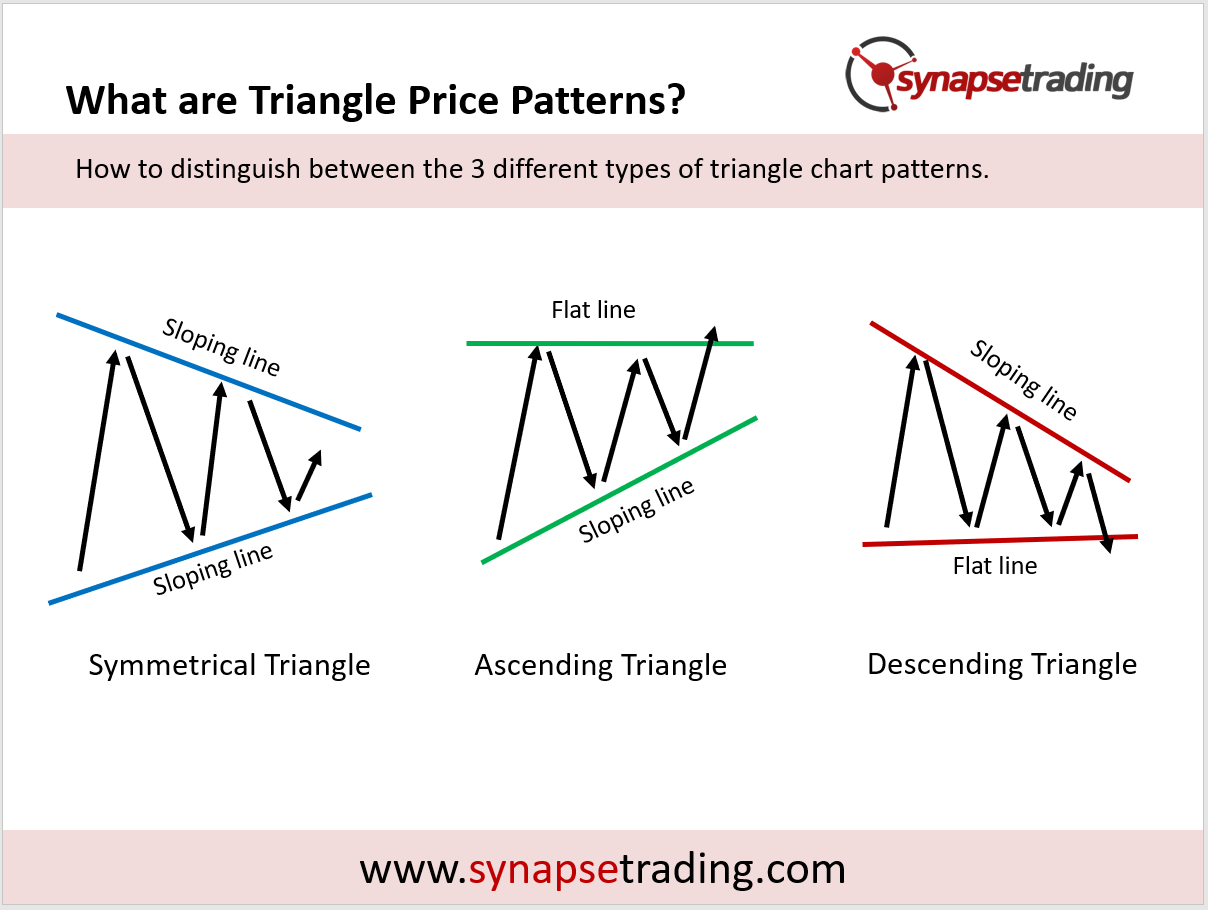
There are 3 different types of triangle patterns – the symmetrical triangle, the ascending triangle, and the descending triangle, each with different trading strategies.
In this post, I will show you how to take advantage of the triangle pattern to trade breakouts, how to avoid false breakouts, and the best trading strategies for this price pattern.
What are Triangle Price Patterns?
A triangle pattern, as its name suggests, is a triangular consolidation range in which prices moves about.
The triangle pattern generally represents a medium-term consolidation of prices, and is usually found in the mid/late stages of a trend.
Since it is a medium-term pattern, the triangle pattern usually consists of 50-100 bars, and most of the time results in prices breaking out in either direction as prices get compressed.
As prices get squeezed towards the tip of the triangle, prices will be forced to break out of the pattern, and the direction is takes will depend on the type of triangle.
There are 3 main varieties of triangles – namely the ascending triangle, the descending triangle, and the symmetrical triangle, and we will be going through each one in more detail later on.
Triangle Pattern Psychology
In the triangle pattern, bulls (buyers) & bears (sellers) are fighting and both sides are trying to gain control. Bulls want higher highs and higher lows, while bears want lower highs and lower lows.
As the fight intensifies, uncertainty increases and volume decreases, as the range of prices start narrowing, so both bulls and bears choose to wait on the sidelines until the direction becomes clear before jumping in again.
That is why once a breakout occurs, price and volume tends to spike, as all the buyers or sellers waiting on the sidelines start making their move.
How to Tackle Each Type of Triangle Pattern
As we have seen, all triangles consist of 2 sloping lines which converge, but the main difference lies in the gradient for each pairs of lines.
Symmetrical triangle – both lines are sloping inwards (top line slopes down and bottom line slopes up)
Ascending triangle – top line is flat, while bottom lines slopes up
Descending triangle – bottom line is flat, while top line slopes down
The slope of these lines have a great significance, which I will cover in greater detail by going through each triangle pattern.
a) Symmetrical Triangle Price Pattern
The symmetrical triangle with its converging lines show that both sides (buyers and sellers) are equally matched, which makes it hard to predict which side the breakout is going to happen.
Since it is a continuation pattern, the odds will tend to favour direction of the existing trend, but it is still much harder to trade compared to the next 2 triangle patterns.
b) Ascending Triangle Price Pattern
The ascending triangle, with its bottom line sloping up, shows a bullish bias, as this indicates a series of higher lows.
Recap: A series of higher lows and higher highs is an uptrend.
The flat line on top, which now serves as resistance, becomes a clear level for price to attack and break, and if it succeeds, will lead to higher highs.
Hence, there is a higher probability of an upside breakout for the ascending triangle, especially if it forms in the middle of an existing long-term uptrend.
c) Descending Triangle Price Pattern
The descending triangle, with its top line sloping down, shows a bearish bias, as this indicates a series of lower highs.
Recap: A series of lower highs and lower lows is a downtrend.
The flat line at the bottom, which now serves as support, becomes a clear level for price to attack and break, and if it succeeds, will lead to lower lows.
Hence, there is a higher probability of a downside breakout for the descending triangle, especially if it forms in the middle of an existing long-term downtrend.
Triangle Pattern Trading Strategies
There are 2 main strategies, which focus on the directional triangles (ascending triangle and descending triangle), and the difference lies in how early to enter the breakout when it happens.
Breakout Entry: Enter immediately
Pullback Entry: Wait for a pullback after the breakout
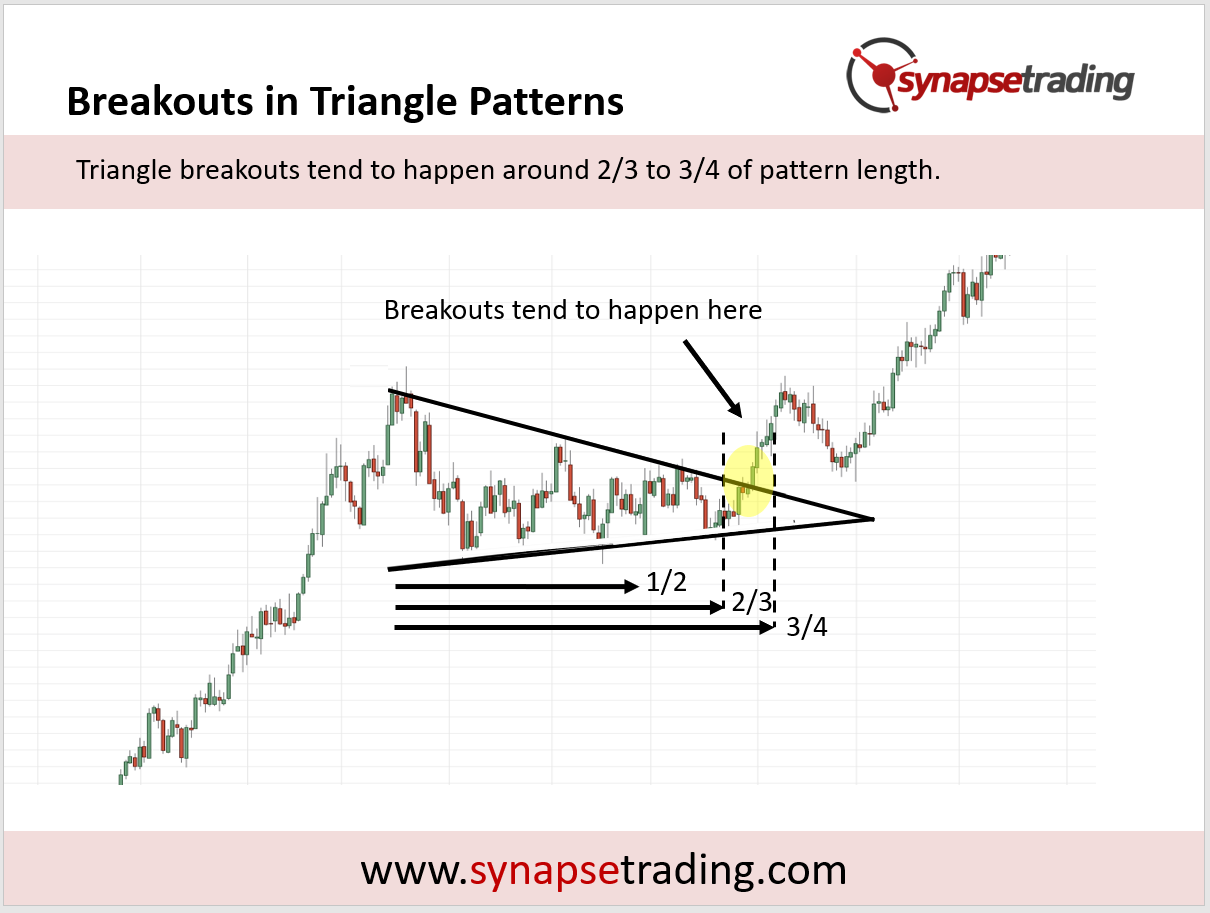
Something to take note of, breakouts usually occur when prices are around 2/3 to 3/4 of the pattern length, and if prices go past the 3/4 mark, there is a possibility that prices may just continue to meander sideways without breaking out. This would mean a failed pattern.
Now, let’s go through each strategy in greater detail.
Trading Strategy #1: Breakout Entry
Our first strategy for the triangle price pattern is to enter on the breakout of an ascending triangle or descending triangle pattern.
As mentioned previously, a triangle is a compression of prices while buyers and sellers wait on the sidelines for a breakout. For this setup, we will be looking to enter just as the breakout happens.
In the example above, we see a prior uptrend, so we know the odds for an upside breakout are higher.
As the ascending triangle forms, we see a series of higher lows (and similar highs) forming, showing a gradual build-up of bullish pressure. We also see prices pushing against the resistance level formed by the similar highs.
Finally, the resistance gives way, and prices through.
For trading, we would look to enter near the point of breakout, keeping an eye for strong price action and volume to support the breakout. We can also use the breakout bar(s) to place a stoploss.
Note that this strategy works just as well with a descending triangle, you’ll just have to flip the pattern around for a downside breakout.
This strategy works best if the prior trend (before forming the triangle pattern) is strong, and has a higher chance of success if the triangle is smaller, in terms of height and duration.
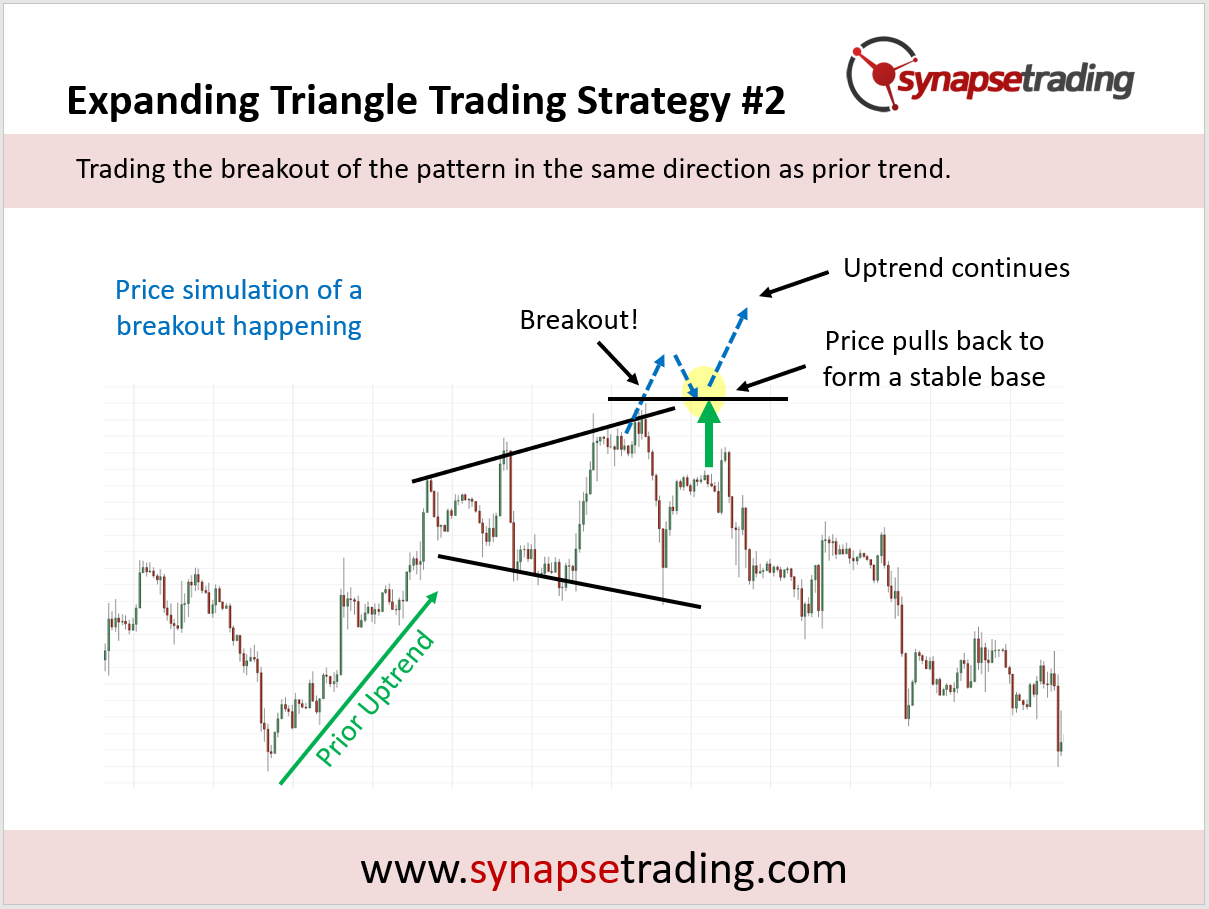
Trading Strategy #2: Pullback Entry
Our next strategy for the triangle price pattern is to enter on a pullback after the initial breakout.
As covered in the previous setup, one of the ways to trade an ascending triangle or descending triangle is to enter the moment price breaks out of pattern.
However, sometimes the odds of a successful breakout might be lower, for example if the triangle pattern is large (more uncertainty), or the pattern goes against the prior trend (bullish ascending triangle in a downtrend, or bearish descending triangle in an uptrend).
In the example above, we see a prior uptrend, followed by a bearish descending triangle. This sets up up a little contradiction, which suggests that the breakout might not be as strong or as clear-cut.
Therefore, when the breakout happens, instead of entering the trade immediately, we wait to see if there is a pullback to test the support-turned-resistance level (which was the flat line of the descending triangle).
For trading, we would look to enter once the pullback is completed, and prices start to head back down. The end of the pullback would also be a good place to put your stoploss.
Note that this strategy works just as well with an ascending triangle, you’ll just have to flip the pattern around for an upside breakout.
Which Triangle Pattern to Avoid?
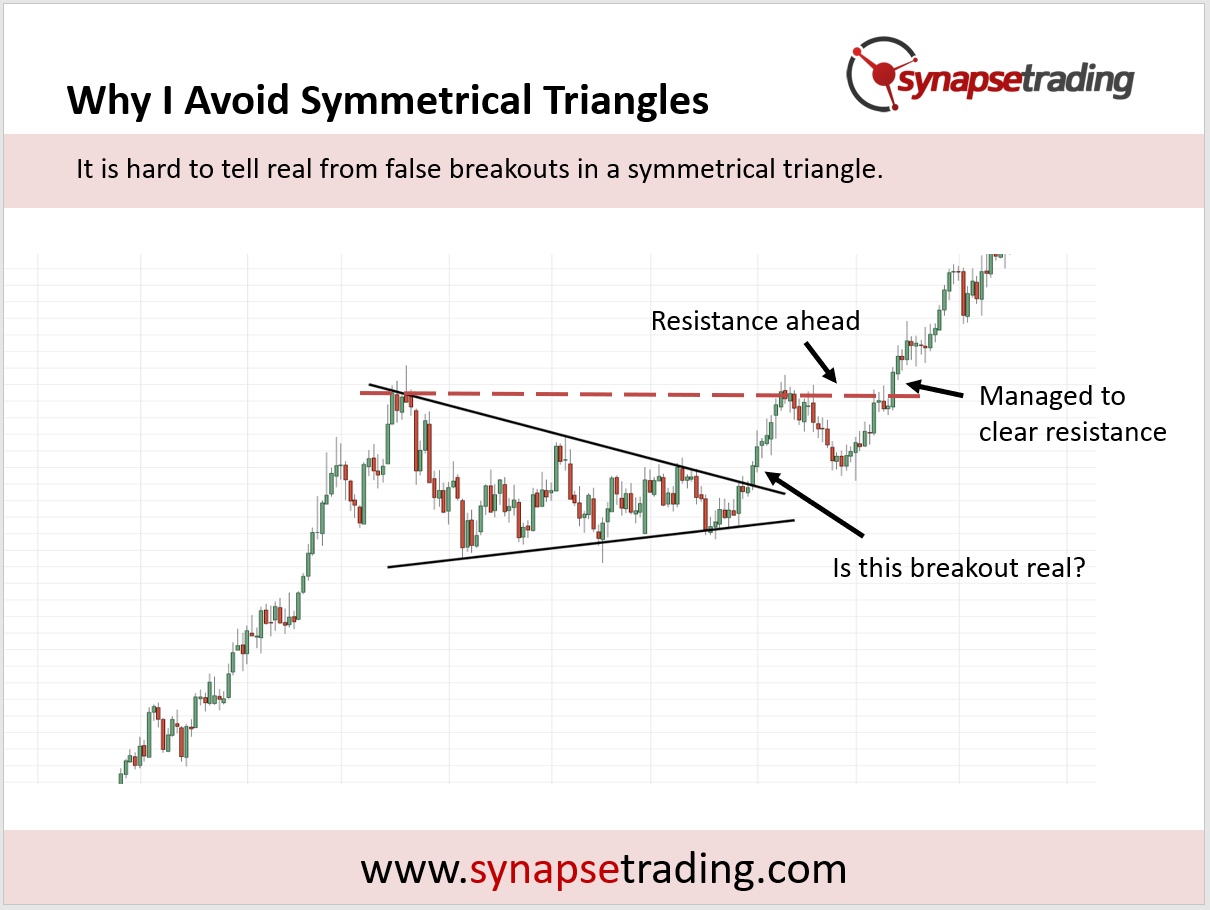
You might have noticed that I left out the symmetrical triangle in both the strategies mentioned earlier.
The reason is that I find the symmetrical triangle the least reliable pattern of the 3 triangle patterns.
This is because it is hard to confirm a successful breakout of this pattern, and even harder to determine a good entry point.
In the example above, prices have broken out to the upside of the symmetrical triangle pattern.
However, because of the nature of the pattern, there will still be another high (or low, if it broke to the downside) which prices have to surpass, and it becomes a resistance level.
As a result, even after the breakout, we are not sure if prices have starting trending, or whether prices are still within a wider range.
We can only be sure after prices have broken the new resistance level and continues climbing, in which case the original symmetrical triangle breakout did not really have much significance or trading opportunity.
Hence, I would prefer to focus on those patterns which have a more predictable outcome.
Profit Target for the Triangle Pattern
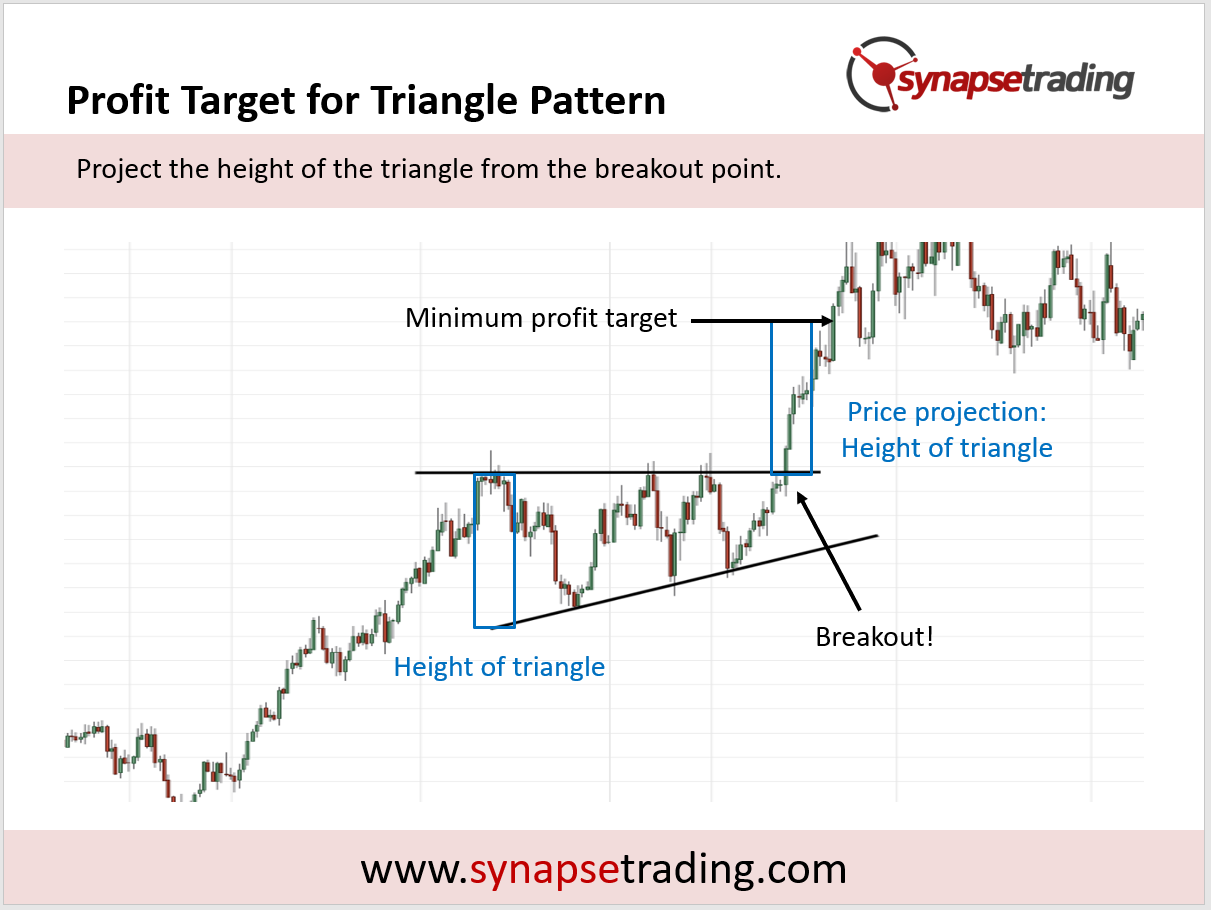
Once a triangle pattern is completed, one of the most useful things about it is its ability to provide a price projection, which can be used to estimate a minimum profit target for your trade.
This can be done by taking the maximum height of the triangle, and projecting that distance from the breakout point.
In the chart above, the maximum height of the triangle is indicated by the blue rectangular box, which is then used as a price projection at the breakout point.
The black horizontal arrow indicates the price level which serves as the minimum profit target for the triangle pattern breakout.
This price projection technique can be used in conjunction with other methods, such as support and resistance levels, and if there is any confluence, gives an added layer of confirmation.
Tips from the Trading Desk
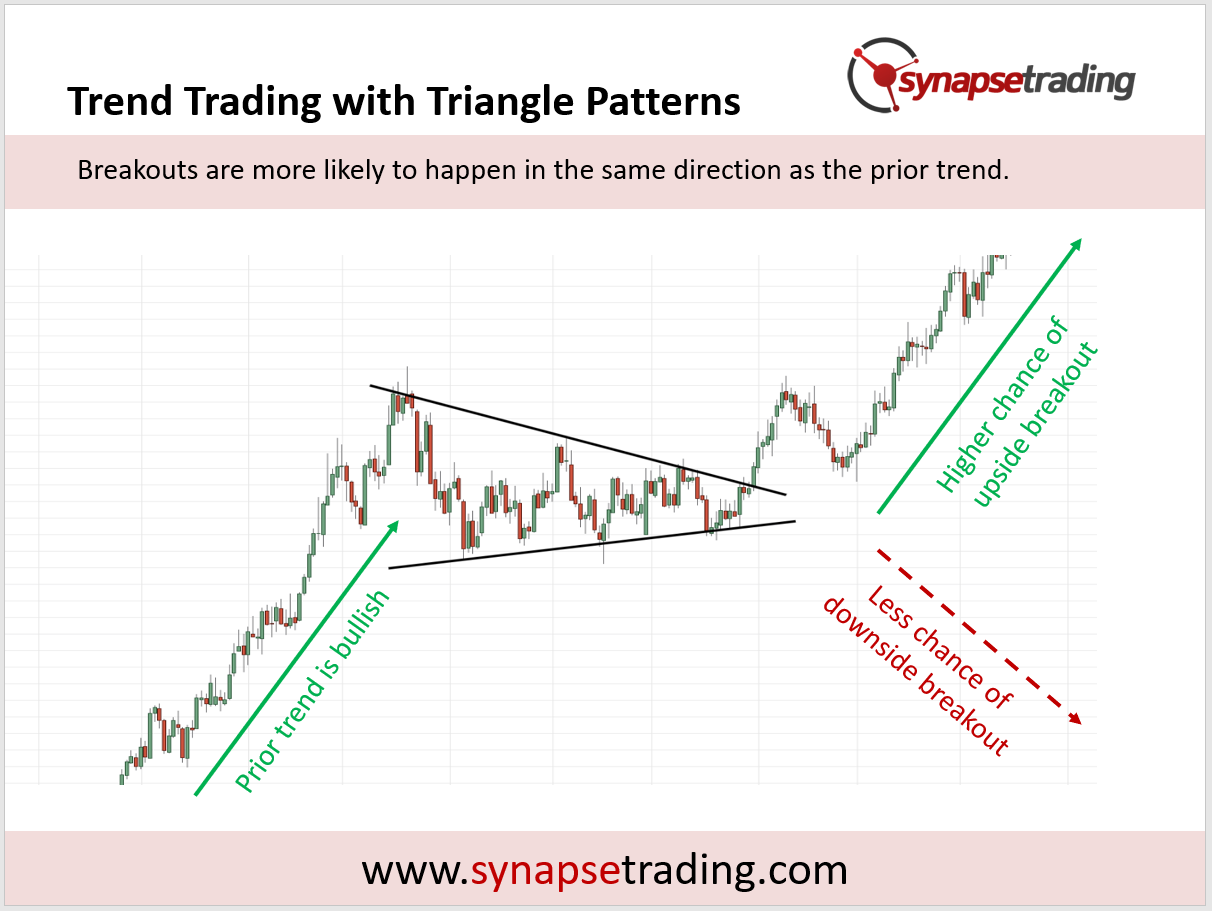
Trade with the larger trend, as breakouts are more likely to happen in the same direction as the prior trend
Watch out for triangles that are themselves a part of a larger price pattern
Look out for major support and resistance levels
As you can see from the chart above, this is an example of trend trading using the triangle pattern, because the triangle formed is actually a consolidation pattern within the major trend, so this whole triangle is actually a pullback opportunity to enter the underlying trend.
Although we generally do not like trading symmetrical triangles, the odds in this case are better than 50-50 because there us a higher chance of an upside breakout due to the context (triangle pattern pullback in major uptrend).
Besides strong trends, triangle patterns can also form near the edges of support or resistance levels, when prices are trying to push through that price level, so you might see them near the necklines of other patterns, such as the double top/bottom, or head and shoulders pattern.
In a sense, the triangle pattern becomes part of these larger patterns depending on the context.
Now that I have shared all about the triangle pattern, what is your favourite triangle pattern strategy for trading?
The head and shoulders and inverse head and shoulders are a type of common reversal pattern found at the end of major trends.
The bearish version is called the head and shoulders pattern, while the bullish version is called the inverse head and shoulders pattern.
In this post, I will show you how to take advantage of the head and shoulders pattern to identify major market reversals, and the best trading strategies for this price pattern.
What is a Head and Shoulders Pattern?
The head and shoulders and inverse head and shoulders are another type of common reversal patterns found at the end of major trends.
When prices are unable to surpass the prior swing high (the head) and forms a lower high (the shoulder) instead, this forms the bearish head and shoulders reversal pattern.
When prices are unable to surpass the prior swing low (the head) and forms a higher low (the shoulder) instead, this forms the bullish inverse head and shoulders reversal pattern.
Head and Shoulders Pattern Psychology
Here is a quick recap of the 2 types of patterns:
Head and shoulders pattern – bearish reversal
Inverse head and shoulders pattern – bullish reversal
Head and Shoulders Pattern Psychology (Bearish Reversal)
In the head and shoulders pattern, bulls (buyers) are originally in control of the market, and the market is in an uptrend.
At some point in time, bears (sellers) try to take control, pushing down prices, which creates the “left shoulder” of the pattern.
Bulls resume control and push prices to new highs, which forms the “head” of the pattern.
Bears try to fight for control again, pushing prices back down to the level of its first push.
Bulls try one last time to resume control by pushing prices up, but it is unable to make new highs. This forms the “right shoulder” of the pattern.
Finally, bears take full control and push prices further down.
Bears are now in control of the market, and the market is in a downtrend.
Inverse Head and Shoulders Pattern Psychology (Bullish Reversal)
In the inverse head and shoulders pattern, bears (sellers) are originally in control of the market, and the market is in a downtrend.
At some point in time, bulls (buyers) try to take control, pushing up prices, which creates the “left shoulder” of the pattern.
Bears resume control and push prices to new lows, which forms the “head” of the pattern.
Bulls try to fight for control again, pushing prices back up to the level of its first push.
Bears try one last time to resume control by pushing prices down, but it is unable to make new lows. This forms the “right shoulder” of the pattern.
Finally, bulls take full control and push prices further up.
Bulls are now in control of the market, and the market is in an uptrend.
Head and Shoulders Pattern Trading Strategies
There are 3 main strategies, which focus on the taking advantage of the change in trend, and the difference lies in how early to enter the reversal when it happens.
Early Entry: Enter immediately
Pre-Breakout Entry: Enter immediately
Pullback Entry: Wait for a pullback after the breakout
Since the head and shoulders is a reversal pattern, we can expect to see its swing counts change as the pattern unfolds.
For the bearish reversal of the head and shoulders pattern, we see the swing counts change from a series of higher highs and higher lows, to one of lower highs and lower lows.
For the bullish reversal of the inverse head and shoulders pattern, we see the swing counts change from a series of lower highs and lower lows, to one of higher highs and higher lows.
For all 3 strategies, they involve entering a position at various stages during this transition of swing counts.
Now, let’s go through each strategy in greater detail.
Trading Strategy #1: Early Entry
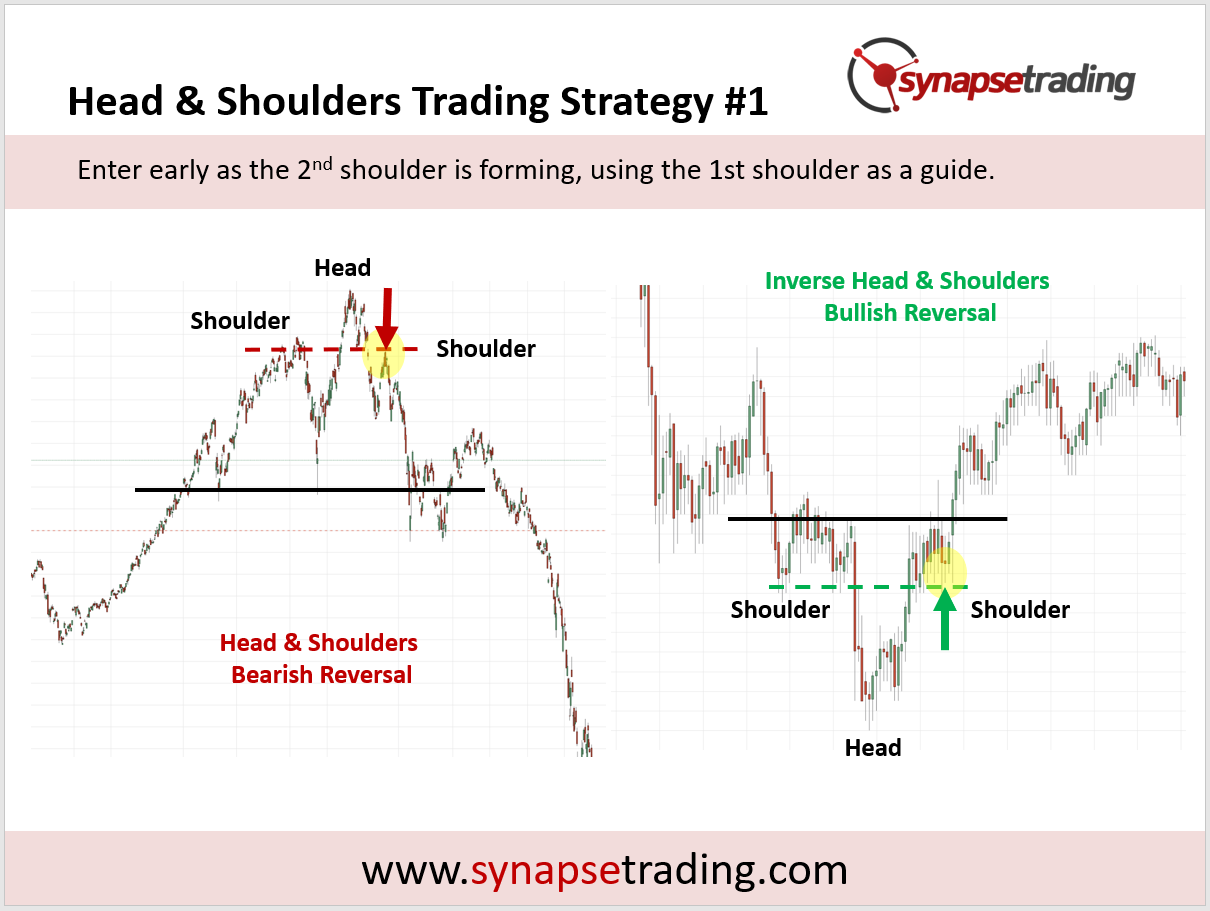
Our first strategy for the head and shoulders price pattern is to enter early as the 2nd shoulder (right shoulder) is forming, by using the 1st shoulder (left shoulder) as a guide.
As mentioned previously, the head and shoulders pattern is a reversal pattern, and we can expect to see swing counts change as the pattern unfolds.
The early entry takes advantage of this by shorting on the first LH (bearish H&S reversal), or going long on the first HL (bullish inverse H&S reversal). You can scroll up to the previous infographic (entries in head & shoulders pattern) to observe where the colour changes.
In the examples above, we see a prior trend, followed by the head and shoulders pattern which attempts to change the direction of the trend.
The first sign of the change of trend comes from the 2nd shoulder (right shoulder), because it is not able to reach the same level or exceed the head, which shows that the existing trend is weakening.
Most of the time, the 2nd shoulder (right shoulder) will form at roughly the same level as the 1st shoulder (left shoulder). This means that we can pre-empt the potential turning point of prices, and use that for our early entry.
For trading, we would look to enter near the point of the 2nd shoulder, keeping an eye for reversal candlestick bars/price action and volume which signals that momentum is weakening and it cannot go past the shoulder level.
We can then look to place our stoploss (SL) somewhere between the shoulder and the head levels.
This strategy works best if the price movement to resume the current trend is weak, and looks to be struggling just to touch the shoulder level, which suggests that it will most likely not be able to go past.
Trading Strategy #2: Breakout Entry
Our second strategy for the head and shoulders price pattern is to enter on the breakout/breakdown of the neckline.
As mentioned previously, the head and shoulders pattern is a reversal pattern, and we can expect to see swing counts change as the pattern unfolds, meaning a LH & LL if we want to short, and a HL & HH if we want to go long.
In the previous strategy (early entry), the entry was given on the first LH (shorting a bearish H&S reversal), or the first HL (going long on a bullish inverse H&S reversal).
In this strategy (breakout entry), the entry is given on the LL (shorting a bearish H&S reversal), or the HH (going long on a bullish inverse H&S reversal). Breaking the neckline automatically gives rise to a LL and HH respectively.
In the examples above, we can see the neckline (blue horizontal line) which denotes this crucial price level. Sometimes, if there is no clear neckline, this might result in a zone, or multiple necklines.
For trading, we would look to enter just as the breakout occurs at the neckline, keeping an eye for strong price action and volume which signals conviction in the breakout.
We can then look to place our stoploss (SL) somewhere between the neckline and the 2nd shoulder (right shoulder).
This strategy works best if there is a clear neckline which price is trying to break, followed by strong price momentum on the breakout.
If the price action is choppy/volatile, or if the neckline is not clear, then it would be better to wait for a pullback and use Strategy #3 (pullback entry) instead.
Trading Strategy #3: Pullback Entry
Our third strategy for the head and shoulders price pattern is to wait for the break of the neckline to occur (Strategy #2), then enter on the 1st pullback after that happens.
As mentioned previously, the head and shoulders pattern is a reversal pattern, and we can expect to see swing counts change as the pattern unfolds.
In the previous strategies, we shorted on a LH (Strategy #1) and LL (Strategy #2); or went long on a HL (Strategy #1) and HH (Strategy #2).
In Strategy #3, we will be shorting on the next LH (LH > LL > LH), or going long on the next HL (HL > HH > HL).
Therefore, since the new trend is slightly more established, the chance of success is higher, but the reward-to-risk ratio (RRR) will not be as good as the prior strategies. As we mentioned many times before, every trade is a trade-off between the hit rate and the RRR.
In the examples above, we can see where the 1st pullback occurs (yellow highlight), depending on which neckline you treat as the breakout.
Most of the time, the pullback will retrace to touch the neckline, but if the breakout momentum is strong, the pullback may not come all the way back to the neckline.
For trading, we would look to enter near the point of the pullback (usually near the neckline), keeping an eye for reversal candlestick bars/price action and volume which signals that momentum is weakening and it cannot go past the neckline.
We can then look to place our stoploss (SL) somewhere between the neckline and the 2nd shoulder (right shoulder).
If you have already entered a position during the breakout, this strategy can be an opportunity for you to add on more positions.
Profit Target for the Head and Shoulders Pattern
Once a head and shoulders pattern is completed, one of the most useful things about it is its ability to provide a price projection, which can be used to estimate a minimum profit target for your trade.
This can be done by taking the maximum height of the pattern (distance from the head to the neckline), and projecting that distance from the breakout point.
If the neckline is not clear or there are multiple necklines, it is advisable to go with the most conservative option, and use a smaller projection.
In the chart above, the maximum height of the head and shoulders pattern is indicated by the blue rectangular box, which is then used as a price projection at the breakout point.
The horizontal arrow indicates the price level which serves as the minimum profit target for the head and shoulders pattern breakout.
This price projection technique can be used in conjunction with other methods, such as support and resistance levels, and if there is any confluence, gives an added layer of confirmation.
Tips from the Trading Desk
Make sure the trend is in the late stage – the longer the trend has been running, the more exhausted it is likely to be.
Use the completed pattern for price projection – shoulders tend to be roughly the same height.
The size of the pattern should be proportional to the trend it is trying to reverse.
As you can see from the chart above, this is an example of a strong trending market (3 green rectangle boxes), which ended in a head and shoulders bearish reversal (1 red rectangular box).
This means that for the whole move up, if we only measure the vertical distance (height), the trend accounts for 75%, and the reversal pattern accounts for 25%. This is within the healthy range, meaning the pattern size is proportional to the whole trend.
Typically, a reversal pattern works best when its height is about 25% to 33% (1/4 to 1/3) of the whole move.
If the pattern size is less than 25%, the pattern is too small to reverse the trend, which means that it might likely lead to a consolidation before the trend resumes, or the reversal pattern is still in the midst of forming, and might evolve to something bigger.
If the pattern is large than 33%, the pattern is too large to be classified as a head and shoulders pattern, and it could just be large swings within a wide range.
I have not come across any authors talk about price pattern proportionality in any books, but I see a lot of new traders making this mistake when trying to identify price patterns. And this applies to other price patterns as well.
Now that I have shared the various trading strategies for the head and shoulders price pattern, which is your favourite strategy?
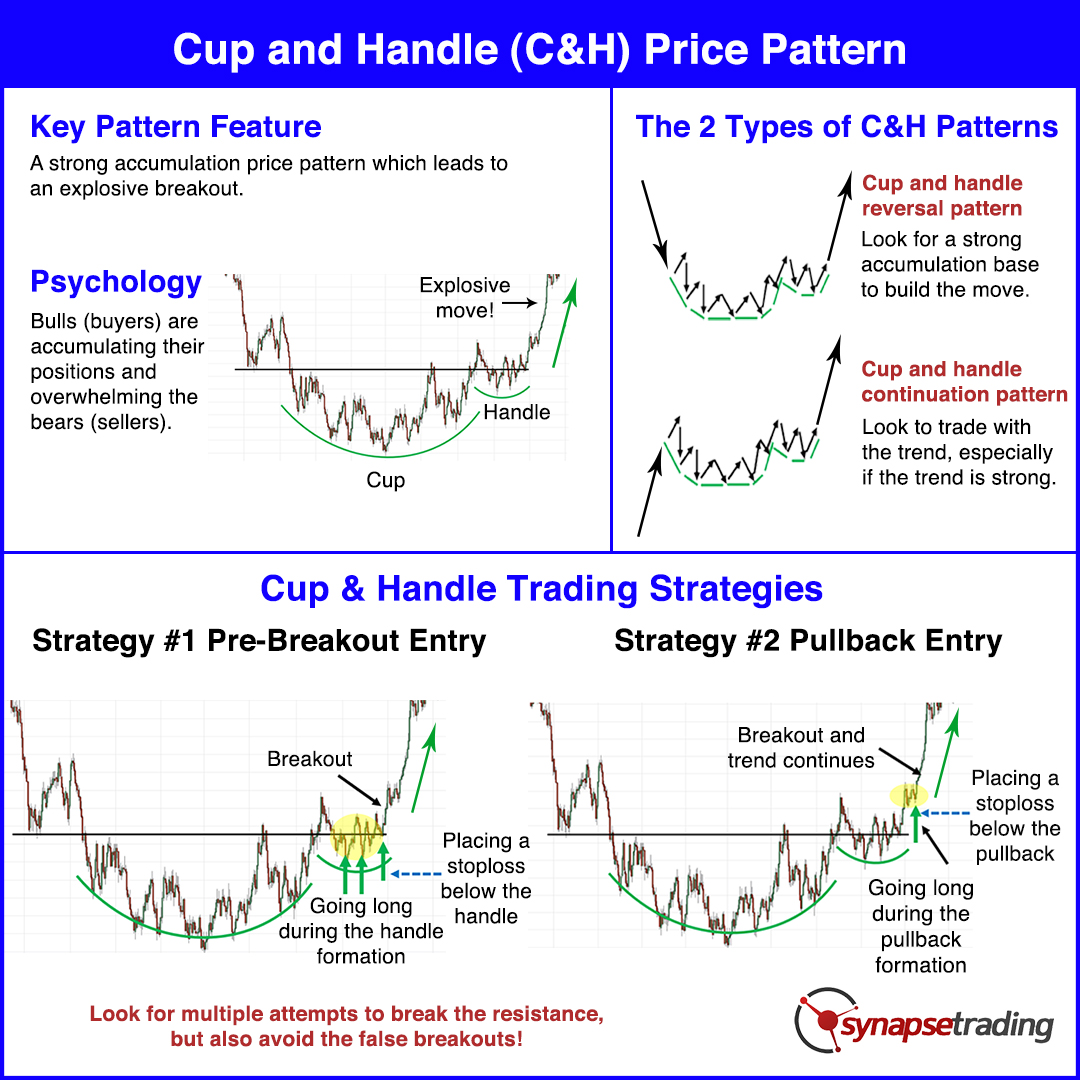
The cup and handle is an accumulation buying pattern, which is found during long periods of consolidation, and can lead to powerful explosive moves once the pattern is fully completed.
There are 2 main varieties of this pattern – the cup and handle reversal pattern, and the cup and handle continuation pattern.
In this post, I will show you how to take advantage of the cup and handle pattern to trade breakouts, how to avoid false breakouts, and the best trading strategies for this price pattern.
What is a Cup and Handle Price Pattern?
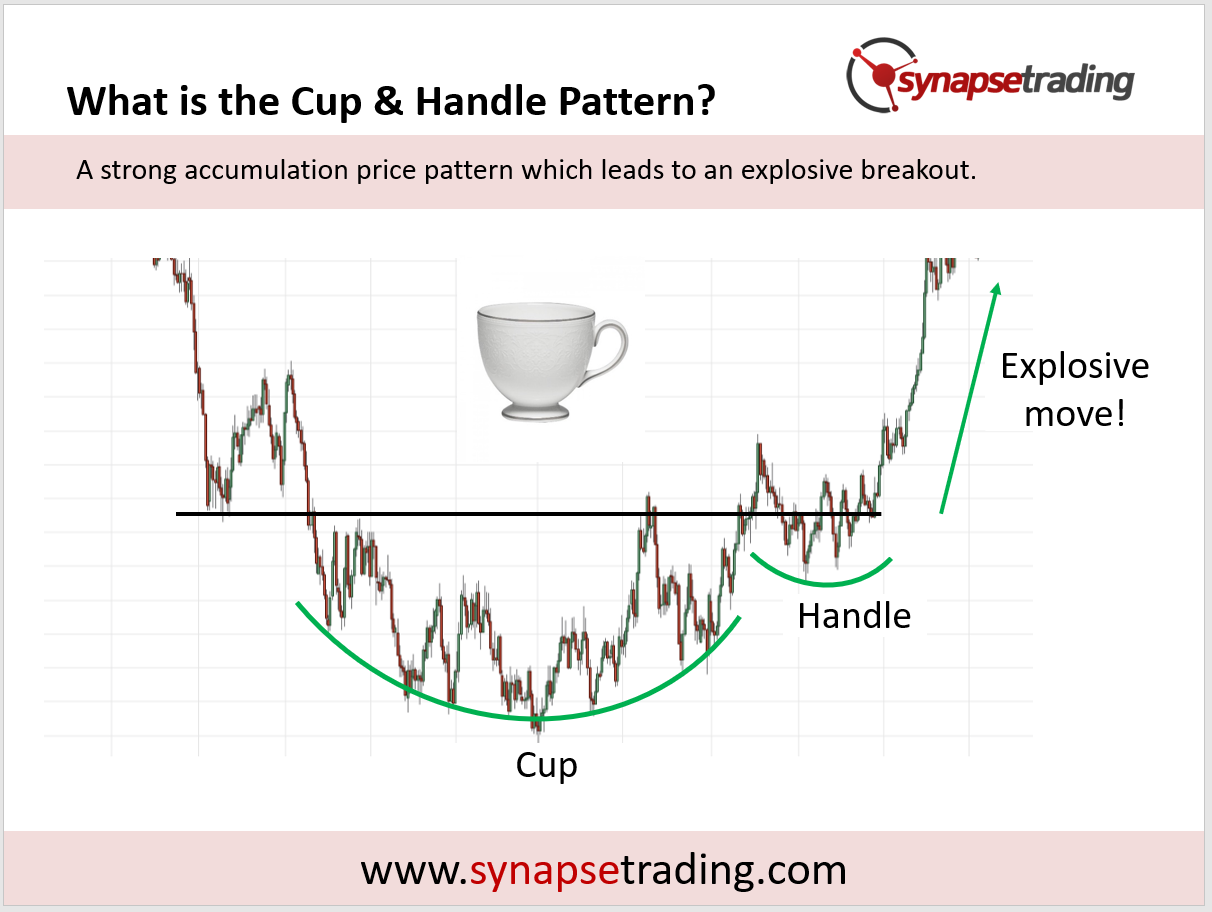
The cup and handle is an accumulation buying pattern, which is found during long periods of consolidation, and can lead to powerful explosive moves once the pattern is fully completed.
In the diagram below, you can see that the price pattern consists of a larger accumulation base (the cup), before forming a smaller accumulation base (the handle), before finally leading to a breakout.
From a practical viewpoint, we will usually start to notice the pattern only when it starts forming the “cup” part of the pattern, which is quite identifiable by the smooth gradual curve upwards of trending swing counts of higher highs and higher lows on the chart.
The confirmation will come from the “handle” part of the price pattern, which is like a small pullback before the price explodes upwards. You can think of it as pushing down on a loaded spring, to build up more pressure just before the release.
The 2 Types of Cup and Handle Patterns
Unlike other chart patterns, the cup and handle pattern does not work equally for both the bullish and bearish scenario, as it is almost exclusively found in the bullish scenario only. Hence, we don’t hear people talking about “bullish cup and handle” or “bearish cup and handle”, because when they say “cup and handle”, it is understood to refer to the bullish version.
Based on the 2 main categories of chart patterns (continuation vs reversal), most people tend to classify the cup and handle pattern under the “Reversal Patterns” category, however I feel that the cup and handle can be both a reversal or continuation pattern.
In the diagram below, I illustrate the 2 different types of cup and handle patterns.
a) Cup and Handle Reversal Pattern
In the reversal cup and handle, prices start off in a prolonged downtrend, where they gradually lose momentum and become more sideways. Prices start to bottom out and form a reversal base, before leading to a change in direction.
b) Cup and Handle Continuation Pattern
In the continuation cup and handle, prices are on an existing uptrend, and when the trend loses some steam or takes a pause, prices start to move sideways. The cup and handle pattern helps to buy up more buying pressure, before prices break to new highs and resume the uptrend.
In both scenarios, the context is very different, but the pattern is the same, and can be traded in exactly the same way.
Cup and Handle Pattern Psychology
In the cup and handle pattern, as the downtrend starts to weaken (less bears/sellers), the bulls/buyers start trying to take control from the bears, by gradually accumulating long positions.
As they build up their positions, we start to see a wide U-shape bottom (the cup), where bulls and bears are almost balanced. This suggests that the bears are no longer in control, and the downtrend has been neutralized.
In the final stage, where the handle forms, this is where the final battle of the bulls and bears take place.
By this time, the bulls have the upper hand as they have been accumulating positions during the cup formation, which in turn attracts more buyers.
Once the last bears are killed, bulls take full control, and the explosive price breakout takes place.
Cup and Handle Pattern Trading Strategies
There are 2 main strategies, which focus on the final battle between the bull and bears, because that is usually the tipping point where large explosive moves happen once the bears give up and get overwhelmed by the bulls.
Pre-Breakout Entry: Enter before the breakout
Pullback Entry: Wait for a pullback after the breakout
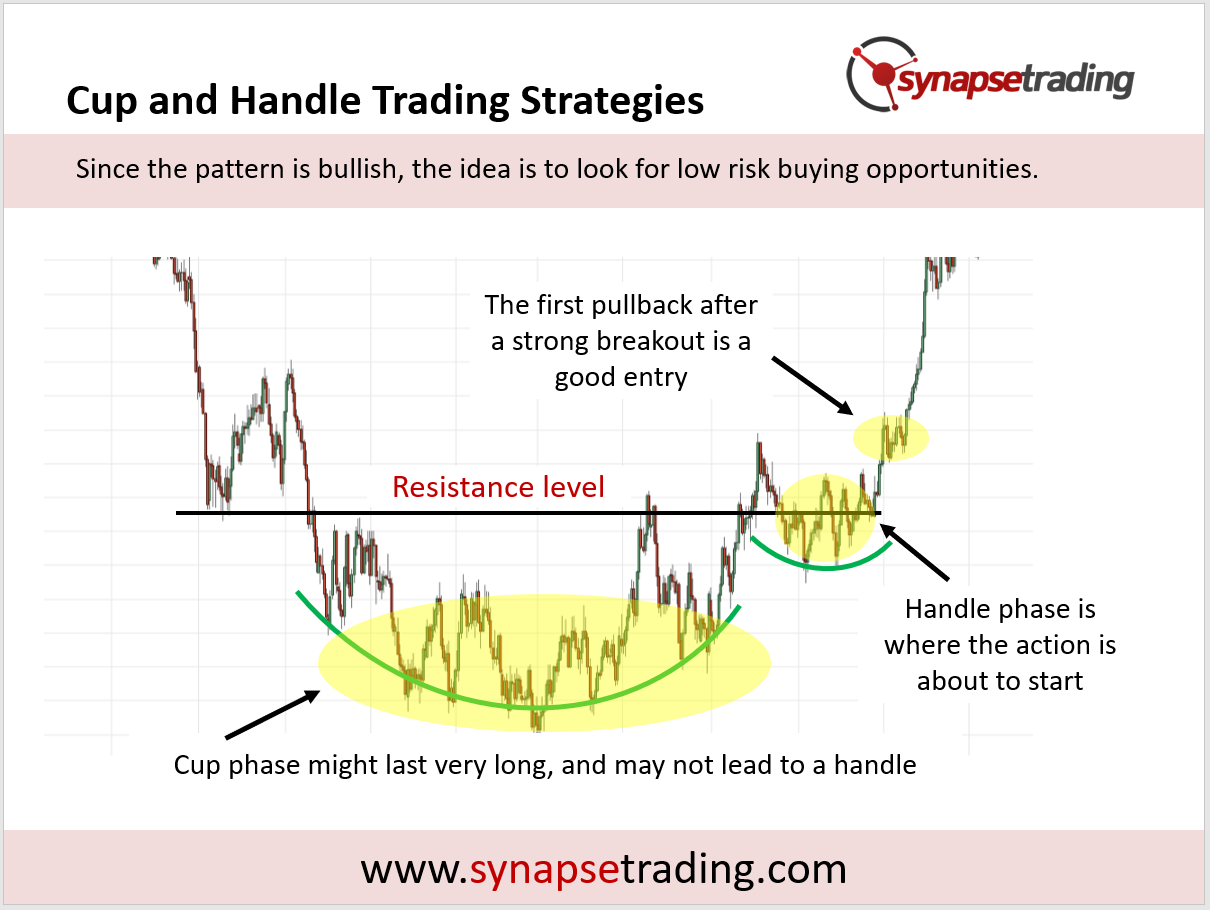
Since the cup and handle is inherently a bullish pattern, the basic idea is to look for low risk buying opportunities to enter.
Looking at the diagram above, you might think that the best place to enter a trade is during the cup phase, because you can get the best entry price.
However, during the cup phase, the odds are 50-50, and there is no real edge, because the market is still sideways at that point of time.
In addition, the cup phase might last a really long time, and may not lead to a handle.
Hence, it makes more sense to make good use of your trading capital, and only enter the trade as the action is about to start.
The first opportunity would be to enter during the handle phase before the breakout, but if you miss that, they next best chance is to enter on the first pullback after the breakout.
Now, let’s go through each strategy in greater detail.
Trading Strategy #1: Pre-Breakout Entry
Our first strategy for the cup and handle price pattern is to enter just before the completion of the pattern, during the handle formation.
During the cup formation, buyers would have been accumulating long positions and building bullish pressure, with the occasional test of the resistance level by trying to break out.
As the handle forms, it is very close to the breakout happening, and this provides a good low-risk opportunity to enter the trade just before the action begins.
Once the breakout happens, the price and volume is expected to surge, which would make it more challenging to enter a position, hence it is recommend to take a position before that.
For trading, we would look to enter during the handle formation, which would be very close to the resistance level.
We can then place a stoploss below the handle, and since the handle is usually pretty small relative to the pattern, the risk will not be very high.
Trading Strategy #2: Pullback Entry
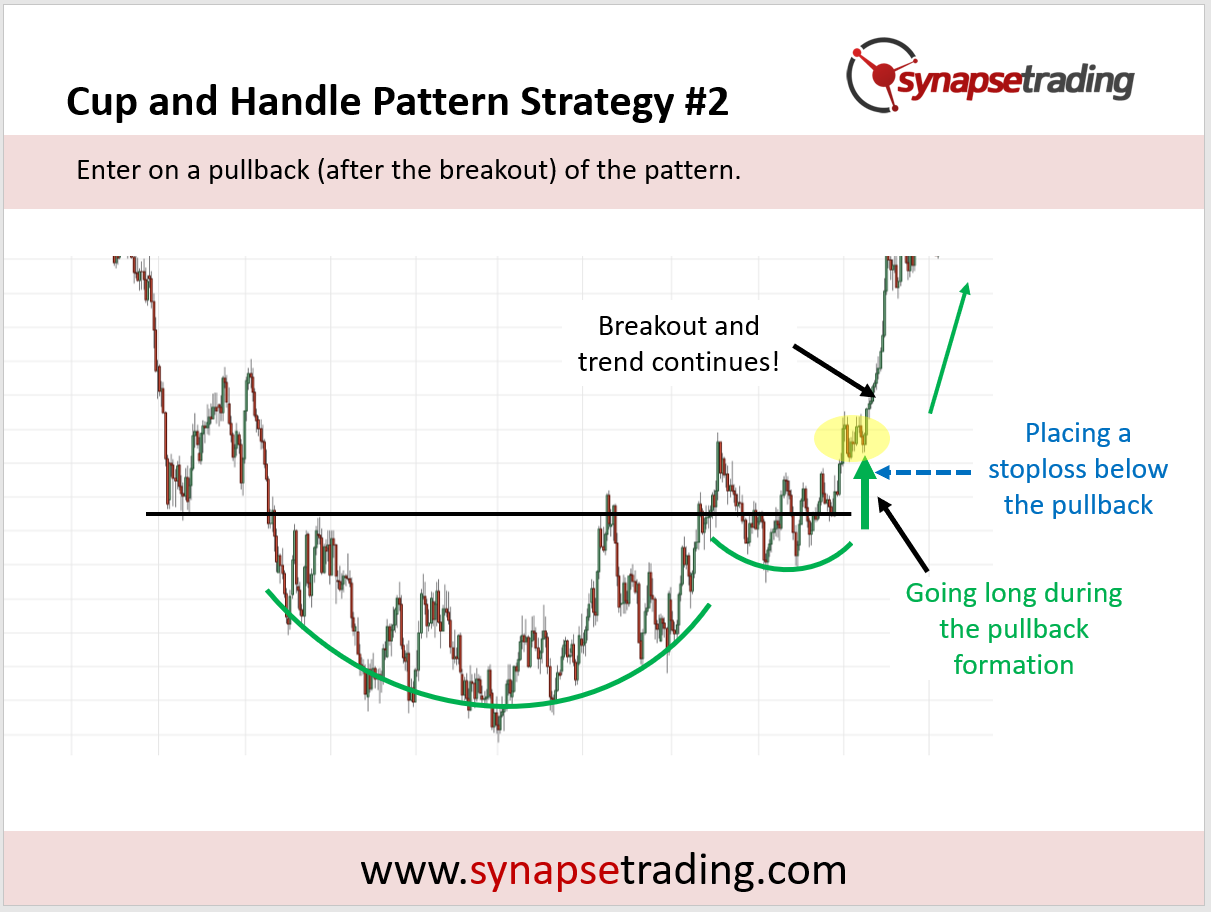
Our next strategy for the cup and handle pattern is to enter on the first pullback after the initial breakout.
As covered in the previous setup, one of the ways to trade the cup and handle pattern is to enter just before the price breaks out of pattern.
However, sometimes the breakout might be too fast, or you might have missed the breakout opportunity.
After such a long build-up (the cup and also the handle), it is very likely that any resulting move up would have more than 1 leg, so the first pullback/pause is a good place to enter because there is a high chance of a 2nd leg after the trend resumes.
In the example above, we see prices surge after the initial breakout, followed by a small pause which looks like a bull flag, before prices continue to surge again after breaking out from the flag pattern.
That small pause (in this case the bull flag) gives us a good low risk opportunity to get into the trade to ride the next wave of uptrend. Do note that the pause may not always be a flag, sometimes it might take other forms, but the idea is the same.
For trading, we would look to enter during the pause (formation of the small flag), when the risk and volatility is low. The bottom of the pullback pattern would be a good place to put your stoploss.
If you have already taken a position using Strategy #1 on the pre-breakout, you can also use Strategy #2 to add more positions on the first pullback.
Profit Target for the Cup and Handle Pattern
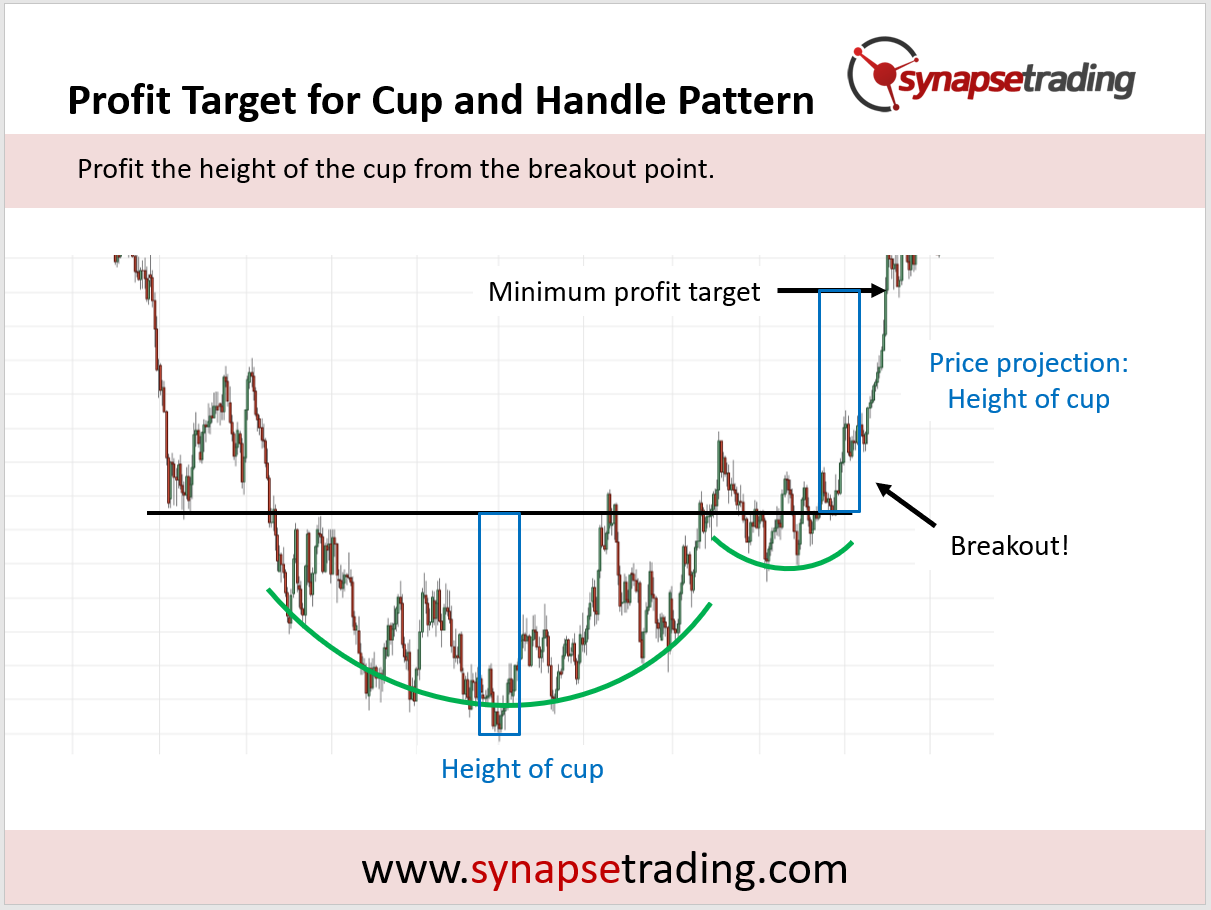
Once the cup and handle pattern is identified, you can use the completed pattern to do a price projection, which can serve as a good estimate for a target profit for your trade.
To measure the target price, take the maximum height of the cup, and project that distance from the breakout point.
In the chart above, the maximum height of the cup is indicated by the blue rectangular box, which is then used as a price projection at the breakout point.
The black horizontal arrow indicates the price level which serves as the minimum profit target for the cup and handle pattern breakout.
To get an added layer of confirmation, you can look for confluence with with tools and methods, such as support and resistance levels.
Tips from the Trading Desk
For cup and handle continuation, look to trade with the trend, especially if the trend is strong.
For cup and handle reversal, look for a strong accumulation base to build the move.
Look for multiple attempts to break the resistance, but also avoid the false breakouts!
As you can see from the chart above, a key component of the cup and handle pattern lies in the resistance level, because in a sense the whole build-up during the cup and the battle during the handle is an attempt to break though this level.
Hence during the build-up phase, we should look out for attempts to break the resistance levels, and it is expected that the first few attempts will fail, so do not try to trade those breakouts.
These “false breakout” attempts are more to probe for weaknesses, and the chances of a successful breakout at this point of time is low because there is insufficient build-up, which usually takes the form of the handle.
Hence, it is more prudent to only enter this setup during the handle formation, especially if previous attempts have been made to break the resistance.
Now that I have shared the various trading strategies for the cup and handle price pattern, which is your favourite strategy?
Die With Zero: The Book That Made Me Rethink Money, Time, and Why I Stopped Chasing More
Last updated: 3 July 2026 · By Spencer Li, CFTe
“Die with Zero” by Bill Perkins argues that the goal of money is not to accumulate as much as possible, but to convert it into life experiences before you run out of time to enjoy them. The core idea: if you die with a large pile of unspent money, you sacrificed hours of your life earning money you never used, which means you effectively wasted those hours. The book flips the usual retirement advice. Instead of hoarding a big sum to live off the interest and dying with the capital intact, Perkins says you should aim to spend down to (close to) zero, peak your net worth earlier in life, give your money away while you are alive, and time each experience for the age when you can actually enjoy it. I read it recently, and it put words to something I had already been living. Here is what it actually says, and why it changed how I think about working harder.
How much time should you exchange for money?
Perkins starts with a simple reframe: money is stored life energy.
Life energy is all the hours you are alive to do things. Whenever you work, you spend some of that finite life energy. So any amount of money you have earned represents the life energy you spent earning it.
Follow that logic and something uncomfortable falls out. If you die with extra money, you sacrificed hours of your life for money you never spent. You wasted those hours.
That means there is an optimal amount of work, enough to fund the lifestyle you actually want, and anything beyond that is unnecessary. But most people work and save far past that point, usually out of fear or habit.
Perkins is blunt about why. Our culture’s focus on work is like a seductive drug. It takes all your yearning for discovery and wonder and experiences, and promises to give you the means (money) to get those things. Then the focus on the work and the money becomes so single-minded that you forget what you were yearning for in the first place. The poison becomes the medicine.
Once you are in the habit of working for money to live, the thrill of making money quietly exceeds the thrill of actually living. That is the trap.
What should you spend money on for maximum value?
Spend on experiences, not things.
Many psychological studies have shown that spending money on experiences makes us happier than spending it on material possessions. Things feel exciting at first, then depreciate. Experiences do the opposite. They gain value over time, because they pay what Perkins calls a memory dividend (the ongoing happiness you get from recalling and re-sharing an experience long after it happened).
The frame underneath this: your life is the sum of your experiences. Everything you do, the daily, weekly, annual, and once-in-a-lifetime experiences, adds up to who you are.
So the practical move is to actively think about the life experiences you want and how many times you want to have them. They can be large or small, free or costly. The point is to decide deliberately rather than drift.
Three questions Perkins keeps asking, which are worth sitting with:
What is the best way to spend our money for maximum enjoyment and maximum memories?
What is the best way to allocate our life energy before we die?
What are the life experiences you would like to have in this lifetime?
What are the biggest regrets people have at the end of life?
The biggest deathbed regret is wishing you had lived a life true to yourself, not the life others expected of you. Perkins draws on the five most common regrets recorded by people near the end of life, and almost all of them are about experiences not had and feelings not expressed, not about money not earned.
#
The regret
What it is really about
1
I wish I’d had the courage to live a life true to myself, not the life others expected of me
Other people’s script over your own
2
I wish I hadn’t worked so hard
Over-working past the optimal point
3
I wish I’d had the courage to express my feelings
Withheld emotion
4
I wish I had stayed in touch with my friends
Neglected relationships
5
I wish that I had let myself be happier
Delayed permission to enjoy life
Notice what is missing from that list: nobody wishes they had earned more.
And here is the part most people miss. This regret does not only strike once, at the very end. It strikes at every stage of life. The bookworm teenager who skipped the fun of high school for a supposedly brighter future. The middle-aged dad who kept skipping irreplaceable moments with his teens while chasing one more promotion.
Perkins calls these mini-deaths. The teenager in you dies. The college student in you dies. The single unattached version of you dies. The parent-of-an-infant version of you dies. Once each of those passes, there is no going back. You can delay some experiences for only so long before the window shuts forever.
When the end is near, people suddenly think, “What the hell am I doing? Why did I wait this long?” Until then, most of us live as if we had all the time in the world.
Why does timing matter as much as the money?
Because some experiences can only be enjoyed at a certain age, and your ability to enjoy them declines.
There is a sweet spot in everyone’s lifetime when they can most enjoy the fruits of their wealth. The problem is that people keep saving well past that point. That is the senselessness of indefinitely delayed gratification.
When you are young, Perkins argues you should focus more on building good experiences than on earning money, because your earning power will rise over time anyway. Your dollar earned per unit of time goes up as you get older, so the cheapest time (in life-energy terms) to buy experiences is when you are young.
The constraint shifts with age, and the research bears it out. People asked what stopped them from taking a trip gave different answers by age group:
Age group
What constrains them most
Under 60
Time and money
75 and older
Health problems
That is the whole argument in one table. When you are young you have health but not money. When you are old you have money but not health. Dying with zero is not only about money. It is about time. Start thinking about how you use your limited time, your life energy, and you are well on your way to living the fullest life you can.
What are “time buckets” and how are they different from a bucket list?
A bucket list is a flat list of things to do before you die. Time buckets are the same idea, but sorted into the life decades when each experience can actually be enjoyed.
The reason this matters: your declining health and narrowing interests mean your list of doable activities shrinks as you age. So your spending rate should not stay constant. If you want to die with zero and make the most of whatever health you have at each point, you will need to spend more in your fifties than your sixties, and more in your sixties than your seventies, let alone your eighties and nineties.
Perkins makes the trade-off vivid. Many people will spend tens or hundreds of thousands of dollars to prolong life by a few weeks. That is money they gave up years, even decades, of healthy and vibrant life to earn, traded for a few extra weeks when they are sick and immobile. The key is to strike the balance between spending on the present (on what you actually value) and saving smartly for the future.
How do you actually plan to die with zero?
It is simpler than it sounds. Estimate the maximum age you might live to, then work out how much cash you will need to get there.
Do note that your expenses (except medical) will be much lower as you age. They can be covered with a combination of annuities, insurance, savings, plus a buffer. And for nearly anything you might worry about in your future, there is an insurance product designed to protect against it.
The result of this approach: your net worth should peak earlier, in your 50s or 60s, instead of peaking on the day you die. Which means you can retire earlier, because you do not need to hoard as much.
Why give your money away while you are still alive?
Because giving it after you die leaves the timing, the amount, and even the recipient to chance.
Most people wait until they pass away to give wealth to their kids or to charity. But why not give it to your children when they can make the most of it?
Perkins ran an informal Twitter poll asking people the ideal age to receive an inheritance windfall. Of more than 3,500 voters, the answers were telling:
Ideal age to inherit
Share of votes
18 to 25
12%
26 to 35
More than half (the clear winner)
36 to 45
29%
46 or older
6%
Why does 26 to 35 win? Some pointed to the time value of money and compound interest: the earlier you get it, the more it can grow. Others pointed to the immaturity problem of getting it too young. Perkins adds a third factor, health: you always get more value out of money before your health declines. The 26-to-35 range combines all three. Old enough to be trusted with money, young enough to fully enjoy it.
The alternative, waiting until you die, is what Perkins calls the three Rs: giving random amounts of money, at a random time, to random people (because who knows which of your heirs will still be alive when you go?).
What do you actually want to give your kids?
Memories, not just money.
Just as you are trying to form memories of time with your kids, it makes sense to want them to form memories of you. Both sets of memories pay a memory dividend, one stream for you and one for them. So the real question is: how do you want your kids to remember you?
Your kids only have their childhood for a certain number of years. What experiences do you want to have with them, or rather, what experiences do you want them to have with you? Does each extra hour of work really serve your legacy, or quietly deplete it?
My views: why am I not working harder?
I get this question often. People wonder why I am not working harder, trading more, scaling the business, making more money.
My question back to them is, “what is the point of making more money?”
I have more than enough money to create the experiences I want, to give to the people and charities I support, and to retire and die with zero.
So I choose to spend my time doing the things I enjoy. Playing sports. Hanging out with my friends and family. Reading (2000+ books and counting). Travelling around the world (70+ countries to date).
I probably will start a family at some point, which is why I have travelled to the more challenging places first, and left the family-friendly places for later. That is time-bucketing in practice.
And I look forward to creating more memories and experiences across the next two-thirds of my life.
Personally, the book did not convert me so much as confirm a bet I had already made. Money is the easy part to grow. Time is the part you cannot earn back.
FAQ
What is the main idea of “Die with Zero” by Bill Perkins?
The main idea is to convert your money into life experiences before you run out of time and health to enjoy them, rather than dying with a large unspent pile. Money you never spend represents wasted hours of your life energy.
Does “die with zero” mean spending all your money recklessly?
No. It means planning so your net worth peaks in your 50s or 60s and is drawn down deliberately over your remaining years, using annuities, insurance, savings, and a buffer to cover later-life expenses. It is intentional spending, not reckless spending.
What is the “memory dividend”?
The memory dividend is the ongoing happiness you keep getting from recalling and re-sharing a past experience. Unlike material things that depreciate, experiences gain value over time because you draw on the memory again and again.
What is the best age to give your children their inheritance?
In Perkins’ poll of 3,500+ people, the clear winner was ages 26 to 35: old enough to be trusted with money, young enough to enjoy it and let it compound. Giving while you are alive also lets you control the amount, timing, and recipient instead of leaving it to chance.
What are time buckets in “Die with Zero”?
Time buckets are your bucket list sorted into the decades of life when each experience can actually be enjoyed, since health and interests narrow with age. They help you schedule experiences for the right age rather than indefinitely postponing them.
If this resonated, the next book worth your time is Morgan Housel’s “The Psychology of Money,” which sits right next to this one on the same shelf. And if you want my full reading list, see the pillar below.
About the author. Spencer Li is the founder of Synapse Trading and a Certified Financial Technician (CFTe) with 15 years of trading across stocks, forex, crypto, commodities, and bonds. His trade log is public, 404 trades, losses left in. He teaches low-risk swing trading in 15 minutes a day, one system for any market. He has also read 2000+ books and travelled to 70+ countries.
Education, not financial advice. Synapse Trading is not licensed by MAS to advise on investment products. Trading carries risk of loss; past performance is not indicative of future results.
https://synapsetrading.com/wp-content/uploads/2020/09/Die-with-Zero-Summary.jpg7201280Spencer Lihttps://synapsetrading.com/wp-content/uploads/2019/10/logo.jpgSpencer Li2020-09-12 02:35:582026-07-06 01:52:11Book Summary: Die with Zero (How to Maximise Your Life)