Free trading guide
The Definitive Guide to Trading Price Chart Patterns
 By Spencer Li, CFTe · Last updated 16 October 2026
The main continuation and reversal patterns, how each one forms, and how to trade them with the trend.
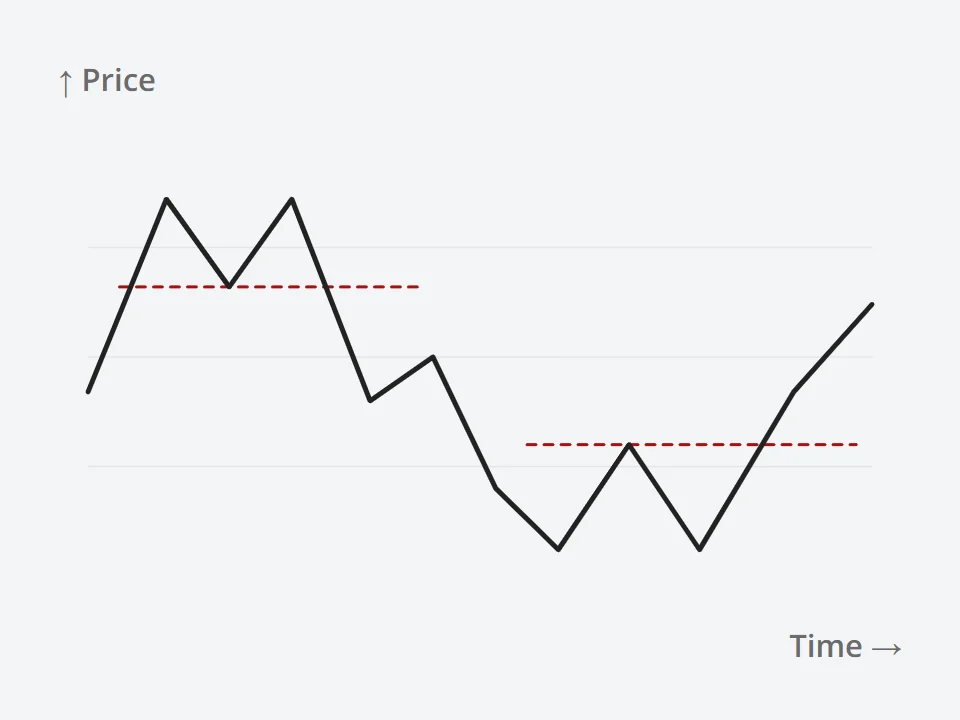

Free trading guide
By Spencer Li, CFTe · Last updated 16 October 2026
The main continuation and reversal patterns, how each one forms, and how to trade them with the trend.
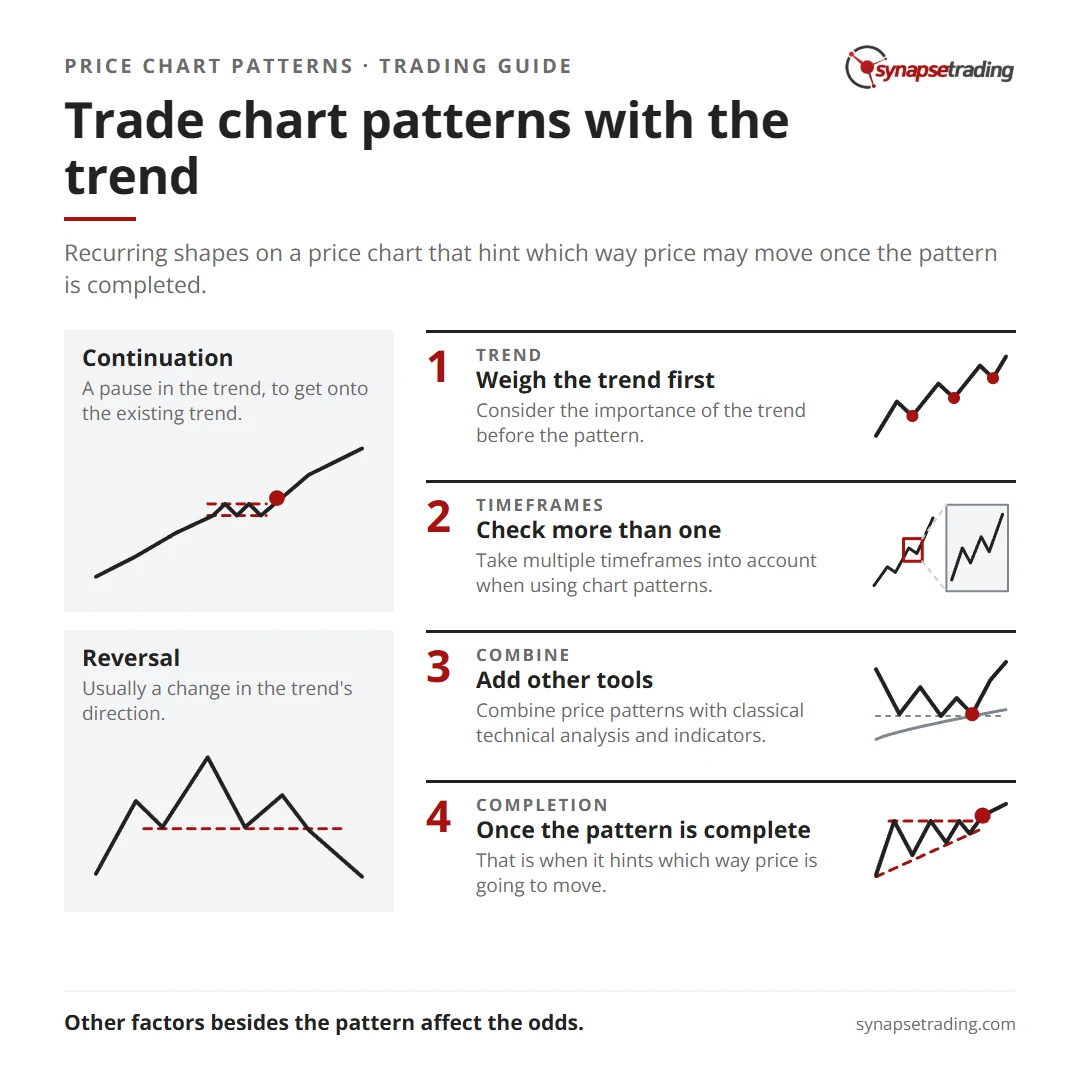
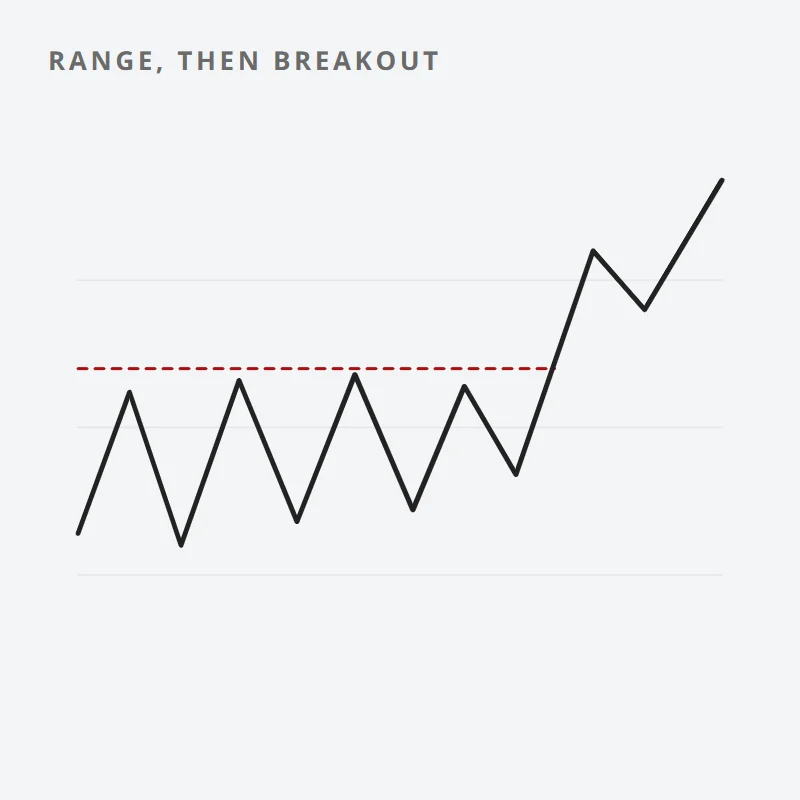
On a price chart, you will notice many recurring and repeated price patterns that not only form curious shapes, but also provide predictive value which way price is going to move once the pattern is completed.
Chapter 1 of 4
What are price chart patterns, how do they form, and how can we identify them?
There are 2 main types of chart patterns, each with different patterns that fall under each type.
Further reading
Free checklist
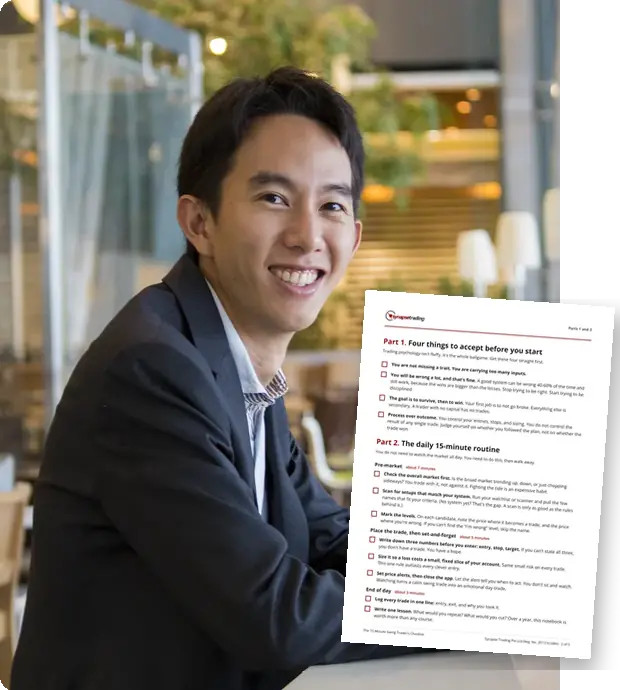
The 15-Minute Swing Trader's Checklist is the daily and weekly routine I use to find, manage and review trades in about 15 minutes a day. Five pages, free, straight to your inbox.
Free 5-page PDF, then occasional trading emails. Education only, not financial advice. Unsubscribe anytime. Kit stores your email in the US: see our privacy policy.
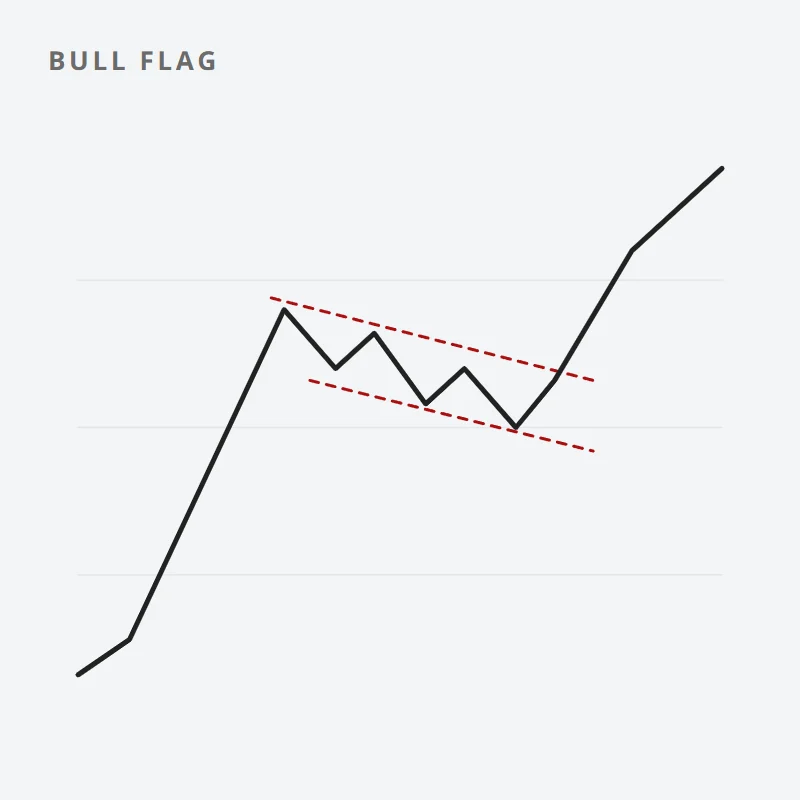
Chapter 2 of 4
Continuation patterns are a pause in the trend, and they are useful for trend-followers and breakout traders who want to wait for a good opportunity to get onto the existing trend, and ride on the momentum.
Further reading
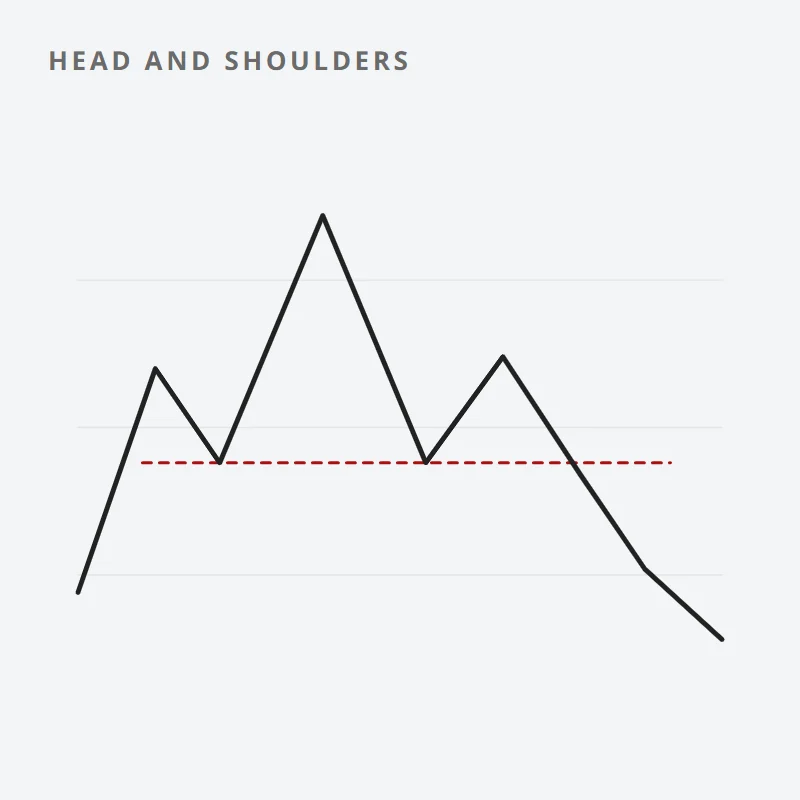
Chapter 3 of 4
Reversal patterns usually lead to a change in direction of the trend, and they are useful for contrarian traders who want to get in early on a new trend, or trend traders who want to know when the current trend will come to an end, so that they can be ready to change direction.
Further reading
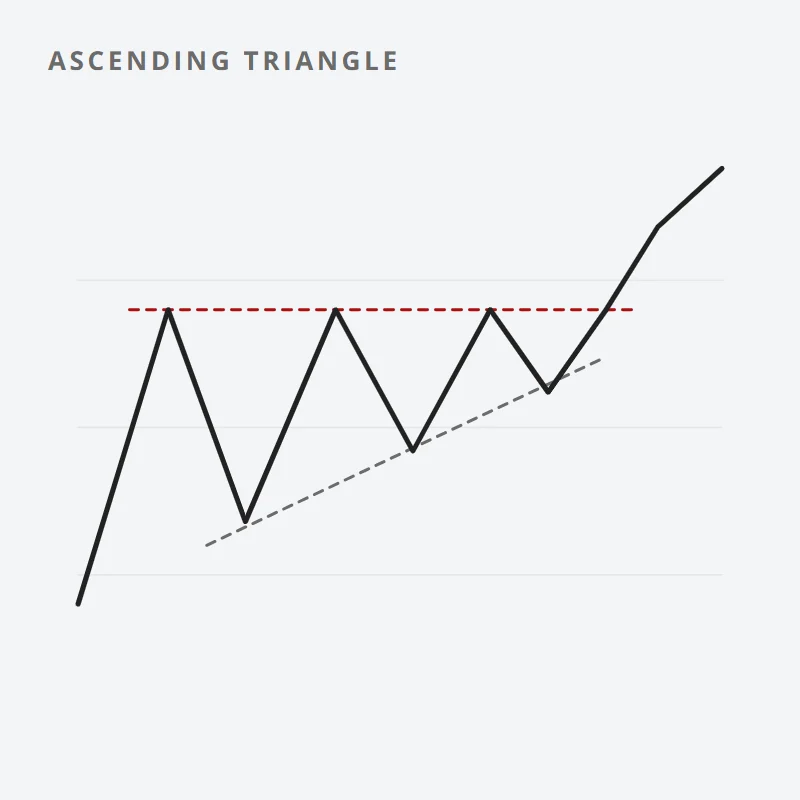
Chapter 4 of 4
When it comes to actual trading, there are many other factors to consider besides the price patterns, which can affect the probability of success of your trades.
For example, one needs to consider the importance of the trend, how to combine chart patterns with other tools, and how to take into account multiple timeframes when using chart patterns.
Further reading
About the author
Spencer Li is The 15-Minute Trader and the founder of Synapse Trading. He is a Certified Financial Technician (CFTe) with 15+ years of trading, run from 70+ countries. He holds a B.Acc and B.BM from SMU. Every trade he takes is public, dated, losses left in. He teaches rules-based swing trading in 15 minutes a day, one system for any market.
Education, not financial advice. Synapse Trading is not licensed by MAS to advise on investment products. Trading carries risk of loss; past performance is not indicative of future results.
The free 15-Minute Swing Trader's Checklist turns this guide into a routine: find the setup, size the trade, log the result.
Free 5-page PDF, then occasional trading emails. Education only, not financial advice. Unsubscribe anytime. Kit stores your email in the US: see our privacy policy.