

Price Patterns and Indicators: How to Combine Them So Each One Checks the Other
Want the daily routine? Get the free 15-Minute Swing Trader’s Checklist. Get it free →
By Spencer Li, CFTe · Last updated: 26 October 2026
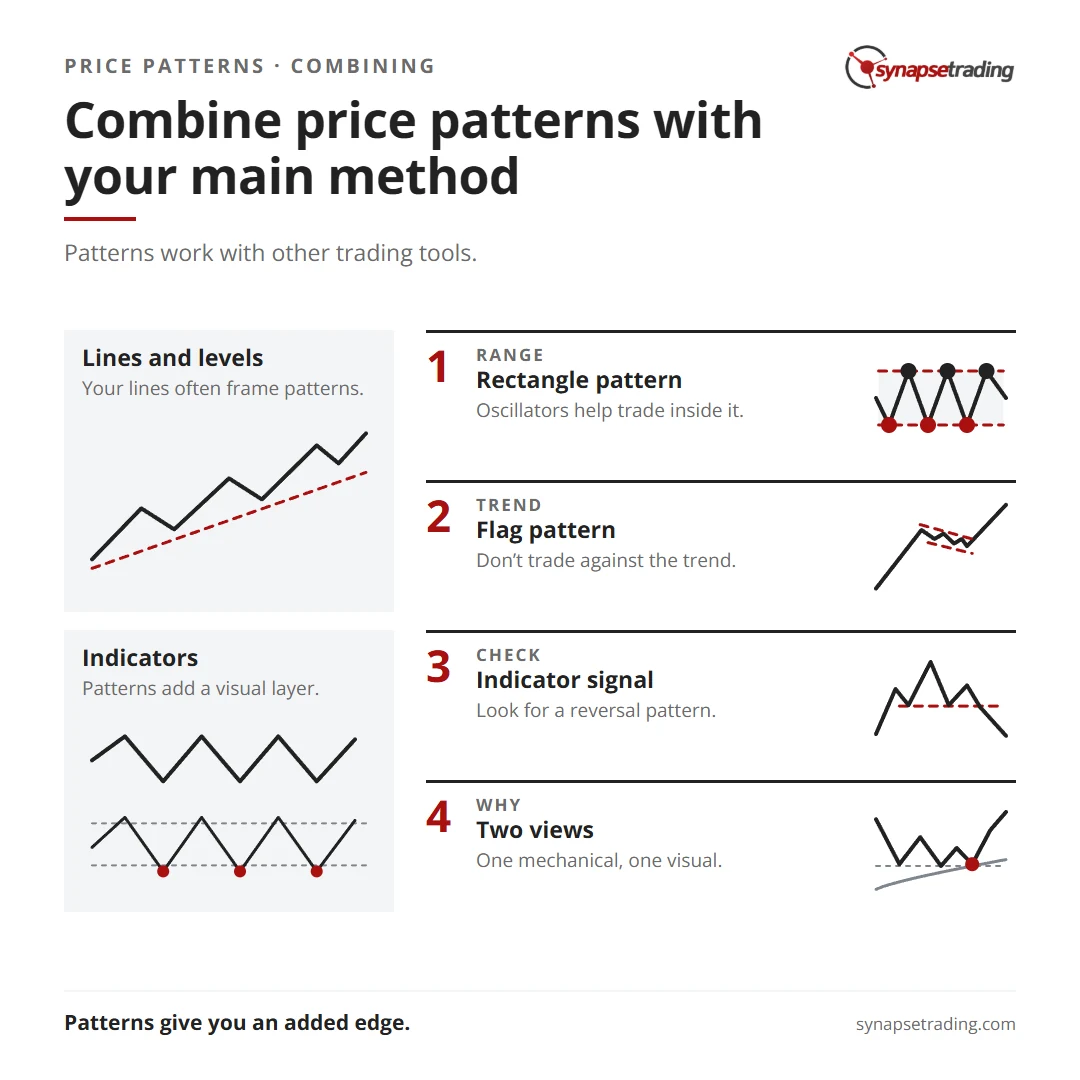
Price patterns and indicators work best together when you treat them as two separate witnesses to the same market. A price pattern is the shape price draws on the chart, like a rectangle, a flag or a double top. An indicator is a calculation done on price, like the RSI, Stochastics or the MACD. So the way to combine them is to read the pattern first, which tells you what kind of market you are in, and then let the indicator confirm it or question it. When both point the same way, you have real confirmation. When they disagree, the pattern usually tells you which one to believe, because most indicators are built for one kind of market and quietly misbehave in the other.
Patterns are also unusually easy to add to whatever you already do. They do not ask you to throw out Elliott Wave, trendlines or a screen full of indicators. They simply sit on top.
Why pair a price pattern with anything at all?
In my own study notes on technical analysis, there is a line I still agree with. Technical analysis is pattern plus indicators, with the pattern as the art and the indicators as the science. The same notes call each indicator “a piece of a jigsaw puzzle”. One piece rarely shows you the picture, but once enough of them fit, you can make a decent guess at the rest.
Martin Pring says much the same thing in his book on price patterns, only more formally. He describes technical analysis as riding a trend “until the weight of the evidence shows or proves that the trend has reversed”, and he never uses a pattern in isolation. A pattern is one piece of evidence, read alongside momentum, volume and the trend.
The reason is simple enough. Any single tool can lie to you. An oscillator can flash a buy signal in the worst possible spot, and a trendline can look perfectly clean right up to the day it breaks. The fear of being wrong on one tool is what pushes most traders to add a second, and that instinct is sound. The trick is to make sure the second tool is actually a different witness.
How does an Elliott Wave trader see a flag?
If you count waves, there is a good chance you have been trading price patterns for years under different names.
A.J. Frost and Robert Prechter, in Elliott Wave Principle, map the classic chart patterns onto their own vocabulary quite directly. A wedge is the same idea as Elliott’s diagonal triangle, with the same implications. Flags and pennants are zigzags and triangles. Rectangles are usually double or triple threes. And the famous head and shoulders can be seen inside a normal Elliott top.
So the two methods are often describing the same pause with different labels. The wave count tells you roughly where you are in the larger move, and the pattern tells you the shape of the pause inside it. When a count is ambiguous, the continuation patterns, the flags, pennants and triangles, give you a second way to read the consolidation in front of you, which is the stretch where Elliott traders usually argue the most.
Are your trendlines already drawing patterns?
Draw two lines on almost any chart and you have probably drawn a pattern without meaning to.
A channel is two parallel trendlines. A range between support and resistance is a rectangle. Two trendlines that slope towards each other make a triangle. So if classical analysis is your main method, learning to name the shape your lines make gives you something extra. A name comes with a history. It tells you how that shape tends to behave, and how it tends to fail.
That last part matters. Pring notes that triangles often “spin into” rectangles, and that some of them weave into a head and shoulders top instead. A trader who only sees “a trendline” gets surprised when the line breaks. A trader who sees the lower edge of a triangle has already read about the ways triangles go wrong, and is surprised a lot less often.
If you would rather look at your charts once a day than all day, my free 15-minute swing trader checklist is the routine I run myself.
When should a pattern overrule an oscillator?
What does an oscillator do in a market that simply refuses to stop going up?
An oscillator, such as the RSI or Stochastics, swings between overbought and oversold, and its whole job is to say that price has gone far enough for now. Inside a rectangle, where price keeps bouncing between two flat levels, that is exactly the job you want done. Price really does keep turning back, so an oscillator helps you spot when a swing inside the range is stretched.
Now put the same oscillator on a flag, which is a short, tidy pause inside a strong trend. Near the top of the move it will read overbought, and it will happily hand you a signal to sell against the trend. Trading against a strong trend is how small losses turn into big ones, which is why I treat that signal as one to ignore.
Alexander Elder explains why in The New Trading for a Living. Trend-following tools, like moving averages, do well when markets move and get whipsawed in ranges. Oscillators do well in ranges and misfire once a trend gets going. John Murphy makes a similar point in Technical Analysis of the Financial Markets, where he says oscillators matter most at extremes and in the direction of the major trend.
Hence, the pattern is doing more than confirming the indicator. It tells you what kind of market you are in, and the kind of market decides which indicator gets a vote.
How do you check a MACD signal against the chart?
Suppose your MACD, a momentum indicator built from the gap between two moving averages, gives you a reversal signal. Before you act on it, look at the chart and ask a simple question. Is there a reversal pattern forming in the same place, like a double top, a head and shoulders, or a breakout that failed?
If there is, you now have two pieces of evidence that were built in completely different ways, one a formula and one a shape, and they still agree. That is real confirmation. If there is nothing on the chart, the MACD is on its own, and a lone signal is a weaker reason to risk money.
| Your main method | Patterns that pair well | What the pairing adds | The trap it warns you off |
|---|---|---|---|
| Elliott Wave | Flags, pennants and triangles | The shape of the pause inside a wave count | Mistaking a normal pause for a trend change |
| Trendlines and support and resistance | Whatever shape your lines already draw | A name, and the ways that shape tends to fail | Trading a line break without knowing what it belongs to |
| Oscillators | Rectangles to use them, flags to overrule them | Whether the oscillator is in its element | Selling a strong trend because it reads overbought |
| MACD | Reversal patterns such as double tops | A visual check on a mechanical signal | Acting on one momentum signal with nothing behind it |
Checking a signal against the chart takes a minute once it becomes a habit, and habits stick better inside a fixed routine. The free 15-minute swing trader checklist is the daily one I run.
Why don’t three indicators count as three votes?
On 3 March 2026, a trader on Reddit’s r/technicalanalysis posted a full breakdown of the euro against the US dollar on the daily chart. Their title ended: “everything pointing down, 85% confidence. Am I missing something bearish?”
It is a fair question. The case had real substance. They had a double top and a bearish flag, which are two pieces of evidence from the shape of price. They also had a low RSI and a MACD below its signal line, and that is where the count gets generous. The RSI and the MACD are both calculated from the same closing prices, so when price falls hard, both of them fall with it. That is closer to one witness speaking twice than to two witnesses.
Elder has a good name for this mistake. He warns against “averaging the votes”, because you can always rig the count by stacking up more indicators from the same family. He compares it to gerrymandering, where whoever draws the district lines can win most of the seats with fewer of the votes. The indicators on your screen are the districts, and you are the one drawing the lines.
David Aronson, in Evidence-Based Technical Analysis, files the same habit under the knowledge illusion, where more information feels like more knowledge. His example is exactly this one, adding indicators that are redundant.
So what does count as a different witness? Pring treats volume as a variable quite separate from price, which makes it a genuine second opinion. A pattern counts too, because it reads the shape of the move rather than a formula. For what it is worth, the euro did slide for about two weeks after that post, then spent April climbing back above where it had been that day. The confidence was a number they gave themselves, and the market never agreed to it.
What does this look like on my own charts?
In my weekly outlook on 7 May 2026, I talked about IGV, a fund of US software stocks that had dropped a long way. There was a lot of volume near the lows, which suggested some accumulation, and a “nice RSI divergence”, which I mentioned “for those of you who are familiar with indicators”.
Then I set the indicator aside. “Basically just looking at the price action,” I said, there had been “a false breakout to the downside”, price had quickly recovered, and it was “forming like a double bottom kind of pattern”.
So there were three kinds of evidence in that read, a shape, a volume reading and an indicator, and the indicator came last. That is the order my study notes ask for, with the pattern first and the indicators in support.
I should be honest about what two agreeing witnesses do not tell you. A week later, on 14 May, I said there had been “not really much movement” so far, and that “only time will tell”. Agreement between a pattern and an indicator makes a turn more likely. It does not tell you when, and the waiting is part of the price you pay.
If you want to see the full family of shapes these signals sit on, the continuation and reversal patterns post sorts them by what they usually do next.

If you would like to learn all the different price chart patterns, also check out: “The Definitive Guide to Trading Price Chart Patterns”
FAQ
Can you use price patterns and indicators together?
Yes, and they work better together than apart. A pattern reads the shape of price, while an indicator is a calculation on price. When both agree you have two different kinds of evidence. When they disagree, the pattern usually tells you which one fits the market you are in.
Which indicator works best with chart patterns?
It depends on the pattern. Oscillators such as the RSI and Stochastics suit range patterns like the rectangle. Momentum tools such as the MACD pair well with reversal patterns, where the shape gives a visual check on the signal.
Do price patterns work with Elliott Wave theory?
Yes. Frost and Prechter describe flags and pennants as zigzags and triangles, and rectangles as double or triple threes. So a pattern often names the same pause a wave count is describing.
Should I ignore an oscillator signal if the pattern disagrees?
Often, yes. The clearest case is an overbought reading inside a flag during a strong uptrend. The pattern says the trend is likely to continue, so a signal to sell against it is usually one to ignore.
Are the RSI and the MACD independent confirmation?
They only partly count. Both are calculated from the same closing prices, so they tend to move together. A pattern or a volume reading is a more independent second opinion.
How many indicators should I use with price patterns?
Fewer than most people think. One or two tools of different kinds, read alongside the pattern, tell you more than five tools that all measure the same thing.
Which indicator do you lean on most, and has it ever told you to sell in a trend that kept on going? Let me know in the comments.
For every pattern in one place, start with The Definitive Guide to Trading Price Chart Patterns, and if you are new to the shapes themselves, read what are price patterns. For the wider picture, start with my free trading guides.
And if you want a daily routine that keeps you off the screen for most of the day, grab the free 15-minute swing trader checklist.
About the author. Spencer Li is The 15-Minute Trader and the founder of Synapse Trading. He is a Certified Financial Technician (CFTe) with 15+ years of trading, run from 70+ countries. He holds a B.Acc and B.BM from SMU. Every trade he takes is public, dated, losses left in. He teaches rules-based swing trading in 15 minutes a day, one system for any market.
Education, not financial advice. Synapse Trading is not licensed by MAS to advise on investment products. Trading carries risk of loss, and past performance is not indicative of future results.
Want the daily routine? Enter your email for the free 15-Minute Swing Trader's Checklist.
Free 5-page PDF, then occasional trading emails. Education only, not financial advice. Unsubscribe anytime. Kit stores your email in the US: see our privacy policy.
Want to learn the full method? The Trading Mastery Program teaches the 4 strategies I have traded since 2011. It suits beginners and experienced traders.
Rather follow the trades as they happen? Daily Trading Signals is our Telegram channel: my trade ideas with entry, stop and exit, and every trade is public.
Questions about this post? Ask in the free Telegram channel →
Educational content only, not personalised financial advice. Trading carries risk, including loss of capital. Past performance is not indicative of future results. Synapse Trading is not licensed or regulated by MAS.

